


Introduction
One method for studying live cellular events in the brain is to section fresh brain tissue and culture it in a solution of artificial cerebrospinal fluid. Using an organotypic slice culture preparation [Reference Humpel1], neural activity can be optically driven and observed using light microscopy (LM), and the ultrastructure of neurons can be observed with electron microscopy (EM). At the intersection of these two techniques is correlative light and electron microscopy (CLEM), which allows for a comprehensive investigation of the mechanisms behind neural plasticity. One subcellular target involved in neural plasticity is the dendritic spine, where about 90% of the excitatory synapses in the brain are located [Reference Harris and Kater2]. Repetitive stimulation of glutamate receptors at the synapse results in rapid and sustained functional and structural changes of the dendritic spines. This structural plasticity of dendritic spines is thought to be the basis of learning and memory and has been extensively characterized [Reference Lamprecht and LeDoux3–Reference Noguchi5]. Following excitation, the tissue can be fixed and observed using CLEM to characterize ultrastructural changes induced in the spine [Reference Sun and Wacker6–Reference Sun7]. Since initial structural changes in the dendritic spine start on a short time scale (~several seconds), capturing the process of structural plasticity requires rapid fixation of the tissue. Chemical fixation requires minutes to hours for complete fixation, but high-pressure freezing can be applied to halt structural changes, even in samples too thick for traditional freezing methods [Reference Studer8], with tight temporal control (that is, 2–3 minutes after stimulation). From this point, tissue can be processed for EM via freeze-substitution. We integrated immunogold labeling in the process to support the CLEM workflow. However, even with such labeling, it can be difficult to find the cell of interest without a correlative map of the slice, especially when using frozen tissue.
Cryo-confocal laser scanning microscopy (cryo-CLSM) provides a way to overcome these problems and to image vitrified samples with confocal microscopy (CLSM) at liquid nitrogen (LN2)-temperatures. Under cryogenic conditions, fluorescence is preserved and bleaching reduced, allowing for imaging of frozen samples [Reference Kaufmann9]. Cryo-CLSM-guided CLEM has been used successfully for vitrified samples of microorganisms [Reference Wu10] and for lamellar preparations from FIB-SEM lift-out experiments with cultured cells on grids [Reference Klein11]. It has not yet been applied to brain tissue slices [Reference Kuba12]. We integrated this technology into the freeze-substitution workflow to image a 2-photon glutamate-uncaged and cryo-fixed organotypic slice culture from the hippocampus before preparation for serial section array tomography scanning electron microscopy (ssSEM). Cryo-confocal images provided us an overview of the tissue and location of fluorescent neurons. Using the enhanced sensitivity of Airyscan detection technology (Carl Zeiss Microscopy, LLC), we were able to resolve the location of the dendritic spine that had undergone structural plasticity. This information was used during cell and dendrite correlation to identify the target spine in our volumetric EM data.
Materials and Methods
Instrumentation
Two-photon LM was performed on a custom-built microscope equipped with a Ti:sapphire laser (Figure 1A, for details see [Reference Sun and Wacker6]). High-pressure freezing of the cultured slice on a grid was done using a Leica HPM 100 with 4.6 mm carriers (Figures 1B, 1C). Cryo-CLSM was performed using an upright ZEISS LSM 980 equipped with a Linkam Cryo-Correlative Microscopy Stage (Figure 1D). A custom-made carrier adapter (Figure 1D, insert, Linkam Scientific Instruments) was used to image the cultured tissue slice on the carrier. Freeze substitution was performed using a Leica EM AFS-2 (Figure 1E). The embedded tissue was serially sectioned using an ATUMtome (RMC Boeckeler, Figure 1F). EM images were captured on a ZEISS Gemini 300 SEM equipped with a Gatan OnPoint™ BSD detector (Figure 1G).

Figure 1: Instrumentation used for the cryo-confocal CLEM workflow for brain tissue. A) Two-photon microscope setup for imaging and performing glutamate uncaging onto dendritic spines. B) The organotypic slice grown on a gold grid was placed onto a 4.6 mm gold specimen carrier lined with sticky tape. Inset: the slice was sandwiched between two carriers for freezing. C) Samples were frozen using the Leica HPM 100. Inset: view of the sample being set into the ceramic cylinder, ready to be frozen. D) The Linkam cryo-stage mounted to the ZEISS LSM 980 for imaging. Note that the mount was rotated 180 degrees due to space constraints. Inset: view of the carrier adapter set on the cryo-stage. E) Freeze-substitution was performed using the Leica AFS-2. F) Ultrathin sections were collected on tape using the ATUMtome. G) Serial sections were imaged with the ZEISS Gemini 300 SEM with Gatan OnPoint BSE detector.
Two-photon LM glutamate uncaging and high-pressure freezing
A 350 μm thick organotypic slice of mouse hippocampus was cultured for 16 days on the top of an index-gold TEM grid (G200F1-Au, EMS) placed on the culture membrane insert. Green fluorescent protein (GFP) was expressed via a biolistic transfection. A pyramidal neuron expressing GFP fluorescence was imaged with 2-photon light microscopy using a 60× water immersion lens (LUMPlan FLN 60× 1.00, OLYMPUS) with 1×–30× digital zoom to capture the target cell body, dendrite, and spine. Glutamate uncaging was performed on one single spine as previously described [Reference Sun7] to induce structural plasticity. Subsequent spine growth was monitored for approximately 1 minute (Figure 1A). The grid holding the slice was then transferred to the flat side of a 4.6 mm diameter gold specimen carrier (16770130, Leica Microsystems) lined with a ring of approximately 200 μm thick double-sided tape (Figure 1B), covered in a thin layer of artificial cerebrospinal fluid, and then sandwiched between another carrier for high-pressure freezing using the HPM100 (Figure 1C). The tissue was frozen 2–3 minutes after uncaging.
Cryo-CLSM image acquisition
Once frozen, the tissue sandwiched between two carriers was stored in LN2 until retrieved for confocal imaging. Before imaging, the lid was separated from the tissue containing carrier in LN2 and placed into the carrier adapter within the pre-chilled Linkam cryo-stage. The cryo-stage was then attached to the ZEISS LSM 980 microscope stage (Figure 1D). An epifluorescence overview image of the slice, together with the pattern of the gold grid, was captured with the GFP filter cube and a 5× objective (Plan-Apo, NA 0.16, ZEISS), which served as a correlative map in later steps of the workflow. The target neuron was then imaged in confocal mode with the 5× objective using 488 nm excitation light and a pixel size of 744 nm. From this image, the approximate location of the spine where glutamate uncaging was applied could be identified. A z-stack was then recorded with a 10× objective (C Epiplan-Apochromat, NA 0.4, ZEISS) at a pixel size of 298 nm, capturing the neuron first using standard CLSM and then with the Airyscan detection mode.
Freeze-substitution and resin embedding
After cryo-CLSM imaging, the frozen tissue on the carrier was transferred to freeze-substitution media containing 0.5% glutaraldehyde (GA), 0.2% uranyl acetate (UA), and 1% water in dry methanol and kept for 75 h at –90°C in the Leica AFS-2. Then the solution was warmed to –30°C (2 degrees per hour), rinsed several times with acetone containing 0.5% GA and 1% water, and incubated in the same fresh solution for 1 h. From here on, the tissue was kept on ice or at 4°C. Tissue was rehydrated by gradually increasing the water concentration and then transferred to 0.5% GA with 0.1 M HEPES (pH 7.4) for 10 min and 0.5% GA in PHEM buffer (90mM PIPES, 37mM HEPES, 15mM EGTA, 3mM MgCL2, pH 7.4) for 16 h. For immunogold labeling, tissue underwent two freeze-thaw cycles for 1 min and was then rinsed in PHEM with 50 mM glycine before being incubated in blocking buffer containing 10% normal goat serum and 1% fish skin gelatin in PHEM for 2 h. Tissue was incubated for 2 days in primary antibody solution (0.1 μg/mL, anti-GFP antibody, Abcam #ab6556) made in 1/10 diluted blocking buffer, washed in PHEM, and then incubated in secondary antibody (1:100 dilution, Nanogold anti-rabbit IgG, Nanoprobe #2003) for 17 h. Tissue was then post-fixed for 10 min in 2% GA buffered in PBS, rinsed with PBS followed by a water rinse, and placed in a solution of Silver Enhancement Kits (HQ Silver, Nanoprobe) for 9 min. Tissue was rinsed in water and then treated with 0.5% OsO4 for 20 min and 1% aqueous UA for 35 min. Tissue was dehydrated in a graded series of ethanol and acetone, infiltrated into Durcupan resin (Sigma), then flat embedded and polymerized for 2 days at 60°C.
Sectioning and ssSEM image acquisition
A piece of approximately 1 mm2 containing the neuron of interest was trimmed from the tissue using the CLSM image as a map. Serial sections were cut at 50 nm and collected onto Kapton tape using the ATUMtome. The tape was arrayed onto 10 cm silicon wafers using double-sided carbon tape and imaged using the ZEISS Gemini 300 and ATLAS 5 AT software. Mid-magnification images were captured at 5,600× magnification, 5 kV accelerating voltage, 1.3 nA beam current, and 20 nm/pixel resolution using the Gatan OnPoint™ detector. High-magnification images were captured at 28,000× magnification and 4 nm/pixel. All manual image correlation was performed with Adobe Photoshop CS6, and image stacks were aligned using the TrakEM2 plug-in of Fiji [Reference Schindelin13].
Results
The vitrified brain slice was kept at liquid nitrogen temperature within the Linkam cryo-stage during imaging. First, we used epifluorescence to visualize the entire shape of the frozen slice. Then we used CLSM to locate and identify the GFP-expressing neurons in the >150 μm thickness of the tissue (Figure 2). The fluorescence signal was significantly impacted by the inhomogeneous thickness of the frozen sample, caused by the uneven thickness of the slice after culturing for days, the amount of the media filled in the carrier, and frost accumulation on the sample during imaging. To assist correlation between the LM and EM images, we first captured an overview image of the entire slice with the index grid at low magnification using epifluorescence (Figure 2A). Because only a handful of neurons per cultured slice were labeled with GFP via biolistic transfection, we were able to identify the target cell by matching the general shape of the neuron from the 2-photon images to the epifluorescence image. Although thicker areas of the tissue tended to obscure any of the underlying fiducial markers of the index grid, we always used the areas with visible letters of the grid as landmarks to estimate the location of the target cell (Figure 2B). This greatly narrowed our examination area for the neuron in the embedded tissue and let us trim the slice to a smaller size (Figure 2C). Once we identified the target neuron in epifluorescence (Figure 2D), we switched to CLSM to see more details (Figure 2E). Using the original 2-photon images as guides (Figure 2F, 2G), we could trace the dendrite in the confocal image outward from the cell body until we found the specific dendritic segment containing the targeted spine (Figure 2E).

Figure 2: LM imaging of frozen tissue and identification of the target spine imaged with 2-photon LM. A) Low-magnification view of frozen tissue containing hippocampal pyramidal neurons expressing GFP. B) Higher magnification of the same region (box in A). The indexed grid provides both a substrate for the tissue and a system for identifying the location of the target cell. Arrow shows a clear fiducial that can be used to estimate the position of other alpha-numeric fiducials (overlaid onto the image). Circle shows location of target cell at C3. C) View of the sample following EM sample preparation and the location of the cell (circle). D) Epifluorescence overview of the target cell. E) Higher-magnification view of the same cell using CLSM. Outlined arrowhead indicates the base of the dendritic branch having the target spine. F) Two-photon GFP imaging done prior to confocal imaging shows the same structure as seen in E. Outlined arrowhead indicates the base of the same dendritic branch in E. G) High-magnification view of the same region (box in F). Arrowhead marks the target spine that received glutamate uncaging. Scale bars: A–C, 100 μm; D, 50 μm; E–F, 10 μm; G, 5 μm.
We then searched for the target spine by capturing z-stack images of the target dendritic segment, using both 10× (C Epiplan-Apochromat, NA 0.4, ZEISS) and 20× (Plan-Apo, NA 0.8, ZEISS) objectives. Ultimately, we were limited to using the 10× objective, as the 20× objective did not provide a sufficient SNR to depict the target spine. A buildup of ice and frost on the surface of the tissue further diminished the image quality, causing small structures such as spines to be almost impossible to see using standard confocal detection (Figure 3A, arrowhead). By switching to the more sensitive Airyscan detection on the LSM 980, we were able to increase the SNR enough to visualize and identify the spine of interest (Figure 3B, arrowhead). Throughout the imaging process we observed negligible photobleaching, which enabled us to repeatedly image the neuron even with extended beam dwell times.

Figure 3: Airyscan detection mode provides higher SNR than confocal mode. A) Image of the target cell captured with confocal mode. Inset: portion of dendritic branch containing the target spine that received glutamate uncaging, which is nearly unidentifiable (arrowhead). B) Same region but captured with Airyscan detection mode. SNR is markedly increased, and the spine is visible (arrowhead). Scale bars: 20 μm.
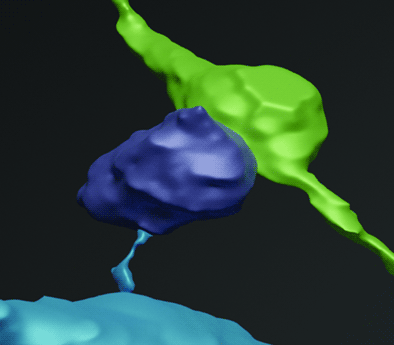
After the cryo-CLSM, the sample went through the freeze-substitution process, and we performed an additional step of pre-embedding immunogold labeling for GFP-expressing neurons. This provided one way of identifying the target cell after embedding, but finding the cell within the entire piece of tissue was still non-trivial. After matching the images of the flat embedded sample to the low-magnification epifluorescence view of the frozen tissue (Figures 2B versus 2C), the target neuron in the embedded sample was easy to follow under brightfield microscopy. We were able to specify the position of the spine of interest (Figure 4A) and trim the area of interest for sectioning. We used the ATUMtome to cut through the block and collected the serial sections on the tape. In SEM imaging, we found the target cell based on our correlation, cell shape, and presence of immunogold labeling (Figure 4B), and we re-located the exact spot where the target spine was in the sections of deeper depth. Finally, we were able to serially capture the area with high resolution (Figure 4C) and reconstruct the target spine together with the presynaptic bouton (Figure 4D). We succeeded in visualizing the morphological characteristics of the identified spine that underwent glutamate uncaging. The spine head labeled with gold particles was opposed to a presynaptic terminal filled with synaptic vesicles, with some docked to the membrane. The synaptic cleft was rigid and had slightly higher electron density, indicating external protein interactions.

Figure 4: The target cell and spine can be identified in EM. A) Brightfield image of the embedded target cell following EM sample preparation. The cell becomes brown following immunogold labeling of GFP. Box marks the location of the target spine. B) TEM image of the same field of view as in A, showing the immunogold-labeled cell. X marks the expected lateral position of the target spine, which appears at a different depth in the serial sections. C) High-magnification image of the gold-labeled target spine and its synapse to a presynaptic bouton. D) 3D reconstruction of the target spine head (purple), bouton (green), neck, and dendrite (blue). Scale bars: A–B, 10 μm; C, 500 nm.
Discussion
We show that cryo-CLSM can be useful for positioning the region of interest for CLEM-based ultrastructural analyses by acquiring fluorescence images of frozen brain tissue slices with >150 μm thickness, followed by EM imaging. Using Airyscan detection, we were able to resolve an individual dendritic spine of the GFP-expressing cell using a 10×, NA 0.4 objective lens without photobleaching the fluorescent label. Cryogenic fixation provides better temporal resolution for capturing fast or transitory biological events for CLEM, compared to conventional chemical fixation and regular confocal LM examination.
Although this workflow allowed us to successfully identify a single dendritic spine that was optically stimulated under the 2-photon microscope, several challenges still need to be addressed. First, we observed that blebbing of the target neuron had occurred sometime between 2-photon and cryo-confocal imaging, indicating the condition of the tissue slice had not been ideal. This also might be linked to the depth of the neuron within the tissue and/or the slice thickness itself, as the freezing rate is slowed deeper inside the tissue, causing freezing artifacts. Further confirmation of this is needed. Second, during cryo-confocal imaging we observed frosting and ice build-up on the sample over time in the closed cryo-stage. In addition, cracks appeared over time in the frozen tissue, possibly caused by localized temperature increases induced by extended laser exposure during image acquisition. So, even though photobleaching was not an issue during fluorescence imaging, we found that minimizing the overall imaging time helped preserve the ultrastructure of the sample.
CLEM workflow, especially when functional LM imaging and EM examination are combined, can be powerful tools for imaging cells or tissues to correlate structure and function. We previously studied structural plasticity of dendritic spines using a CLEM workflow with ssSEM [Reference Sun and Wacker6–Reference Sun7], however, a technical question remained in terms of the temporal resolution of the fixation process. To capture the morphological change of spine plasticity, we ideally want to fix the tissue within 2–3 minutes of glutamate uncaging to preserve the initial stage of the phenomena. High-pressure freezing was possible, but once the tissue was frozen we could no longer capture the CLSM images needed to map the target spine within the larger tissue slice to enable correlation with subsequent EM imaging. As we describe here, the integration of cryo-CLSM of tissue samples into the CLEM workflow opened a door for better understanding of biological phenomena that require rapid temporal resolution to analyze. The introduction of genetically encoded EM markers in the tissue will be the next step to eliminate the immuno-EM labeling process from the current workflow.
Conclusions
In this paper, we integrate cryo-confocal microscopy of frozen brain slices into a CLEM workflow to assist the identification of target cellular features between 2-photon LM and EM. We show that it is possible to image frozen tissue under cryogenic conditions and demonstrate the viability of Airyscan detection for high-SNR imaging.
Acknowledgements
This work was supported by the Max Planck Florida Institute for Neuroscience. We would like to thank Carl Zeiss Microscopy, LLC and Linkam Scientific Instruments for providing the Cryo-Correlative Microscopy Stage and with developing the prototype of the carrier adaptor; we also thank them for their kind technical support through the Research Partnership between Carl Zeiss Microscopy, LLC and MPFI.


