


Introduction
Cattle grazing temperate swards do not use nitrogen (N) and water efficiently (Satter & Roffler Reference Satter and Roffler1975; Jarvis Reference Jarvis1993; Van der Hoek Reference Van Der Hoek1998). At least 0·70 of the N they ingest is not stored or secreted in saleable products (e.g. milk, live weight gain) and >0·60 of that N is excreted with water as urinary nitrogen (UN) (Kebreab et al. Reference Kebreab, France, Beever and Castillo2001; Gregorini et al. Reference Gregorini, Beukes, Bryant, Romera, Edwards and Bryant2010, Reference Gregorini, Beukes, Dalley and Romera2016). Discharge of UN onto pasture is the greatest contributor to leached N in temperate grazing environments (Di & Cameron Reference Di and Cameron2002; Selbie et al. Reference Selbie, Buckthought and Shepherd2015). Therefore, in association with intensive livestock production and increased demand for water and nutrients (Pimentel et al. Reference Pimentel, Berger, Filiberto, Newton, Wolfe, Karabinakis, Clark, Poon, Abbett and Nandagopal2004; Hoekstra & Chapagain Reference Hoekstra and Chapagain2007), these inefficiencies frequently deplete and/or contaminate water sources (Jongbloed & Lenis Reference Jongbloed and Lenis1998; Ilea Reference Ilea2009). Individual measurements of UN excretion and water consumption by grazing ruminants are difficult, time-consuming and expensive; therefore, prediction and modelling are critical for research to improve N and water use efficiency.
The need to know about the diurnal pattern of urination relates to the great variability of N concentration, volume and diurnal frequency of individual urination events throughout the day (Betteridge et al. Reference Betteridge, Costall, Li, Luo and Ganesh2013). For beef cattle and non-lactating dairy cows grazing temperate swards, N concentration, volume and diurnal frequency of individual urination events vary considerably, 0·8–14·1 g/l, 0·3–10 litres and 13–73 times/d, respectively (Betteridge et al. Reference Betteridge, Andrewes and Sedcole1986, Reference Betteridge, Costall, Li, Luo and Ganesh2013). Similar variations have been reported for lactating dairy cows in New Zealand (Shepherd et al. Reference Shepherd, Shorten, Costall and MacDonald2017). These variations have been related to animal N and water metabolism (Maltz & Silanikove Reference Maltz and Silanikove1996; Appuhamy et al. Reference Appuhamy, Wagner-Riddle, Casper, France and Kebreab2014), as well as grazing management (Clark et al. Reference Clark, Mcleod, Glassey, Gregorini, Costall, Betteridge and Jago2010b ; Gregorini et al. Reference Gregorini, Villalba, Chilibroste and Provenza2017), and dietary and animal features (Betteridge et al. Reference Betteridge, Andrewes and Sedcole1986). Collectively, they represent feeding and grazing management opportunities to modulate urination patterns and N excretion and discharges onto pastures (Gregorini et al. Reference Gregorini, Villalba, Chilibroste and Provenza2017).
Much empirical data and mathematical representations of water consumption and UN have been accumulated and summarized (Murphy Reference Murphy1992; Silanikove Reference Silanikove1992; Castillo et al. Reference Castillo, Kebreab, Beever, Barbi, Sutton, Kirby and France2001) and attempts to model them have been diverse (Winchester & Morris Reference Winchester and Morris1956; Holter & Urban Jr Reference Holter and Urban1992; Bannink et al. Reference Bannink, Valk and Van Vuuren1999; Cardot et al. Reference Cardot, Le Roux and Jurjanz2008; Khelil-Arfa et al. Reference Khelil-Arfa, Boudon, Maxin and Faverdin2012; Appuhamy et al. Reference Appuhamy, Wagner-Riddle, Casper, France and Kebreab2014). However, many N cycles and farm models use UN as input data or only predict daily averages of UN, ignoring the known variability of N concentration, volume and diurnal frequency of daily individual urination events. The latter can create either under or overestimations of UN, scaling errors and thereby false perceptions (good or bad) of particular feeding and grazing managements. Mechanistic and dynamic approaches that simulate UN and water consumption are scarce, and to our knowledge, there are no current models on the diurnal patterns of urination and drinking by grazing ruminants.
MINDY is a deterministic, mechanistic and dynamic model of a dairy cow representing diurnal patterns of ingestion, digestion and metabolism, and production based on explicit relationships among direct (ingestion, digestion and metabolism) and indirect (feeding environment) controls of motivation to feed (Gregorini et al. Reference Gregorini, Beukes, Romera, Levy and Hanigan2013, Reference Gregorini, Villalba, Provenza, Beukes and Forbes2015b ). MINDY is a cluster of six models: (1) Molly models digestion, metabolism and production of a dairy cow (Baldwin Reference Baldwin1995), as modified by Gregorini et al. (Reference Gregorini, Beukes, Waghorn, Pacheco and Hanigan2015a ); (2) diurnal fluctuations in feeding motivation; (3) sward canopy structure and herbage quality; (4) grazing behaviour; (5) dietary preference and forage selection; and (6) foraging bioenergetics. MINDY also integrates functional relationships between forage ingestion, oral physiology and swallowing, and rumen digestion responsible for variations in liquid outflows from the rumen (Gregorini et al. unpublished). The primary objective of the current work was to represent diurnal urination and drinking patterns, and the resulting pattern of UN in MINDY. The effort integrates existing knowledge of basic urination physiology (Andersson & Arner Reference Andersson and Arner2004) and water dynamics in ruminants (Silanikove Reference Silanikove1994; Maltz & Silanikove Reference Maltz and Silanikove1996; Kadzere et al. Reference Kadzere, Murphy, Silanikove and Maltz2002), which are responsible for frequency and variations in the volume and N concentration of urination events. The mathematical formulation, first principles, model parameters and function, as well as preliminary evaluation (cross-validation) of the new development in MINDY are described and presented, respectively, in the current paper. Also, and for illustrative and conceptual evaluation of the new model development, the hypothesis that herbage crude protein and specific grazing management strategies alters UN and drinking patterns were tested.
Rationale and Description of the Model Development
This development (Fig. 1) is a mechanistic and dynamic representation of water consumption (ingested with food and imbibed) and urination pattern by grazing ruminants within MINDY (Gregorini et al. Reference Gregorini, Beukes, Romera, Levy and Hanigan2013, Reference Gregorini, Villalba, Provenza, Beukes and Forbes2015b ). The code was developed and simulations were conducted using ACSLXtreme (Aegis Technologies Group, Austin, TX, USA). Numerical integration was conducted using a fourth-order, fixed-step, Runge–Kutta method. The maximum integration interval was set to 0·001 d. The results presented in the current paper were collected after 5 d of simulation to ensure the model had reached a steady state.
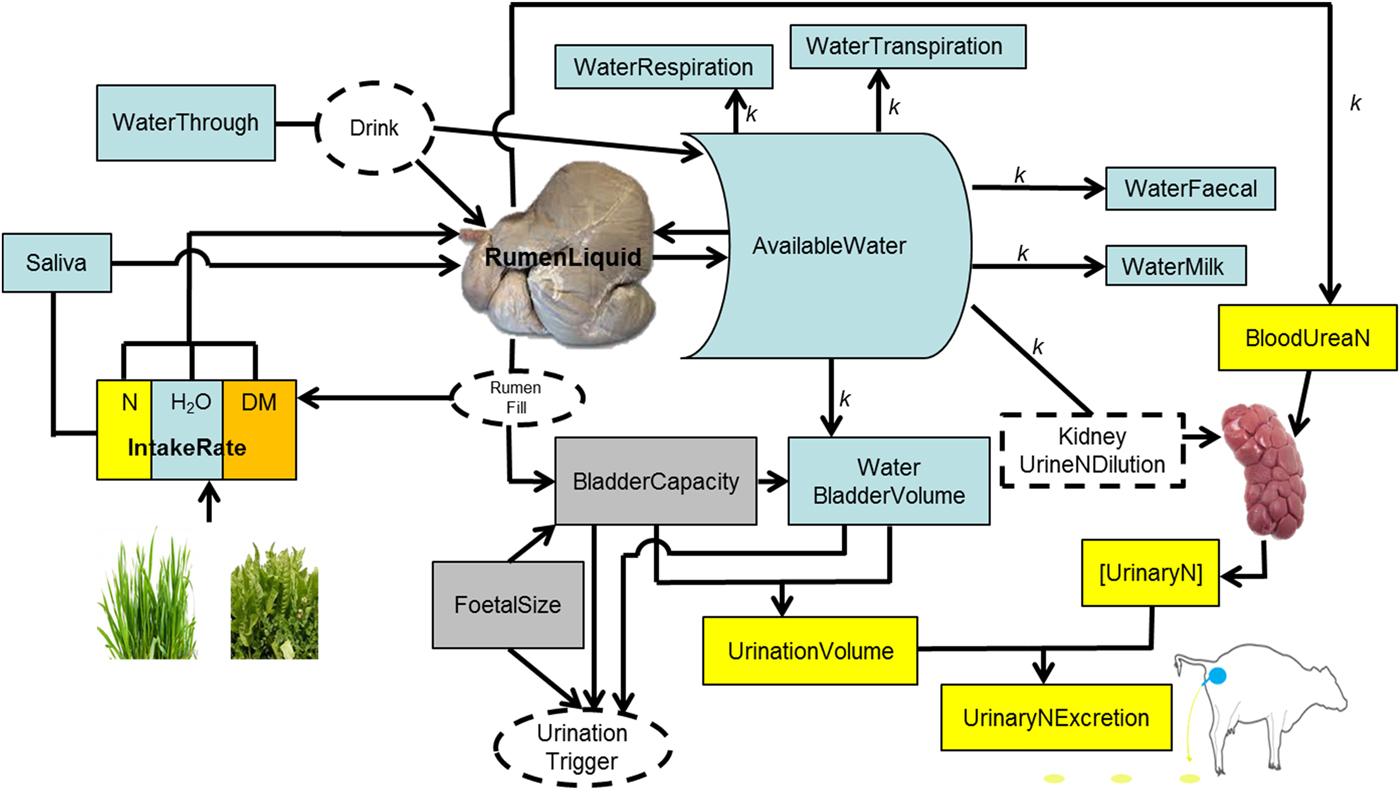
Fig. 1. Schematic representation of the processes of drinking and ingestion of water, urination and nitrogen (N) concentration in urine.
Water consumption
Amount of water imbibed
The rumen is the main water reservoir for ruminants (Church Reference Church1988). This water is used for metabolic, cooling and digestive processes (Van Soest Reference Van Soest1994). Ruminants attempt to maintain an optimal rumen function (Yokoyama & Johnson Reference Yokoyama, Johnson and Church1988; Van Soest Reference Van Soest1996), and a key requisite for that is stable microbial populations (Bergen Reference Bergen1977; Hobson & Stewart Reference Hobson and Stewart1997). To thrive and survive, rumen microbial populations require water in a range between 0·80 and 0·85 of rumen contents (if water is accessible), independent of diet, season and type of ruminant (Van Vuuren Reference Van Vuuren1993; Gregorini et al. Reference Gregorini, Gunter, Masino and Beck2007, Reference Gregorini, Soder and Kensinger2009b ; Seo et al. Reference Seo, Lanzas, Tedeschi and Fox2007). In addition, animals attempt to maintain blood volume, mobilizing water from various pools of the body if necessary but mainly from the rumen (Miaron & Christopherson Reference Miaron and Christopherson1992), to avoid haemo-concentration (Jain Reference Jain, Schalm and Jain1986). Therefore, it was assumed that the amount of water in the rumen is ‘sensed’ by the animal, and in conjunction with continuous ‘sensing’ of variations of water level in the body (WaterBody) stimulates the motivation to drink, i.e. thirst.
The amount of water imbibed is represented in MINDY as a function of rumen dry matter (DM) content (RumDM) and WaterBody as follows:
If water is available, and RumDM ⩾ RumDMUpperLimit or WaterBody ⩽ WaterBodyTrigger, then MINDY stops other activities (grazing, ruminating, idling) and drinks. MINDY drinks at a rate of 18 litres/min corrected for body size (AnimalBodySize, kg) (Pinheiro Machado Filho et al. Reference Pinheiro Machado Filho, Teixeira, Weary, von Keyserlingk and Hötzel2004). MINDY stops drinking when RumDM ⩽18·4% or reaches a maximum volume of the rumen and WaterBody is ⩾WaterBodyTrigger (constant, 69·7%, water content of fat-free body (Springell Reference Springell1968)).
Rumen liquid, and thereby RumenDigesta, are affected by the inflow and outflow of liquids to, from, and by-passing (water that goes directly to the abomasum, passing fleetingly through the top of the rumen and into the reticulum) the rumen. The model assumes 0·0115 of the water imbibed (WaterImbibed, litre/min) bypasses (WaterBypass, litre/min) the rumen (Woodford et al. Reference Woodford, Murphy, Davis and Holmes1984). For details on the mechanistic and dynamic representation of digesta outflow from the rumen (solid and liquid) in MINDY (Gregorini et al. Reference Gregorini, Beukes, Waghorn, Pacheco and Hanigan2015a ; Gregorini et al. unpublished). The inflow of liquid to the rumen is calculated as follows:
 $$ \eqalign{WaterInflow = & WaterImbibed + WaterIngestion + Saliva \cr & + WaterOsmolarity - Waterbypass} $$
where WaterIngestion (litre/min) is the product of herbage (or any feed) intake rate and its moisture content. MINDY accounts for changes in herbage moisture content throughout sward canopy strata, during the day and throughout the year according to the season (Delagarde et al. Reference Delagarde, Peyraud, Delaby and Faverdin2000; Gregorini et al. Reference Gregorini, Soder and Sanderson2008, Reference Gregorini, Soder, Sanderson and Ziegler2009c ; Gregorini Reference Gregorini2012). Saliva is the inflow of saliva (litre/min) to the rumen and depends on the activity. Salivation rate is 2·4 litres/d while ruminating and 0·85 litre/d during idling (Maekawa et al. Reference Maekawa, Beauchemin and Christensen2002); while eating, the rate of salivation (litre/min) depends on the characteristics of the ingestive bolus and number of jaw movements (severing and mastication) per bolus. MINDY simulates differential jaw movement rates according to behavioural actions (rumination, severing bites, oral processing, bolus formations) and internal state (hunger), which are influenced by fibre content of the forage (Gregorini et al. Reference Gregorini, Beukes, Romera, Levy and Hanigan2013; Gregorini et al. unpublished). WaterOsmolarity (litre/min) is water exchange across the rumen wall between rumen fluid and blood through osmolality as previously described (Gregorini et al. Reference Gregorini, Beukes, Waghorn, Pacheco and Hanigan2015a ).
WaterBody is the continuous variable percentage of water in the body. It is the ratio between water pool in the body (WaterPool), excluding the rumen, and the body weight (BW) excluding the gravid uterus. WaterInflowIntoWaterBody is calculated as follows:
 $$ \eqalign{WaterInflowIntoWaterBody = & WaterOutflowRumen \cr & + Waterbypass - Saliva \cr & - WaterExcretion} $$
WaterOutflowRumen is the momentary outflow of liquid from the rumen (See Gregorini et al. (Reference Gregorini, Beukes, Waghorn, Pacheco and Hanigan2015a ) for details of the equations), and WaterExcretion is the water excreted as respiration (kWaterRespired = 0·033 litre/kg BW/d, assuming half the maximal respiratory rate, Murphy (Reference Murphy1992)), transpiration (kWaterTranspired, 0·0185 litre/kg BW/d, assuming 0·25 of the maximal sweating rate), defecation (kWaterDefecated, 0·77, assuming 23% faecal DM Murphy (Reference Murphy1992)), urination, and milk production (assuming 0·01 of ash in milk, while lactose, fat, protein and total milk are simulated mechanistically).
Water excretion as urine
Animal extra cellular water (WaterPool in MINDY) is the main source of water for urine production and dilution of N (Appuhamy et al. Reference Appuhamy, Wagner-Riddle, Casper, France and Kebreab2014). Cattle produce urine with a fixed ceiling for urine osmolality, ~1000 mmol/kg BW (Maltz & Silanikove Reference Maltz and Silanikove1996). If urea concentration in the kidney is high, water is withdrawn from cellular water (WaterPool) because ruminants, as opposite to monogastrics, cannot concentrate urine above this ceiling (Silanikove Reference Silanikove1994; Maltz & Silanikove Reference Maltz and Silanikove1996). Thus, increments in osmotic loads, e.g. by increases in N supply to the animal (i.e. intake and digestion) are associated with excessive urine production (Maltz & Silanikove Reference Maltz and Silanikove1996). Based on these concepts and data, plus basic urinary bladder physiology (Andersson & Arner Reference Andersson and Arner2004), urination behaviour in MINDY is represented as follows:
The bladder stores urine. Urine enters the bladder from the kidneys. The bladder of cattle can hold a variable volume (BladderVolume, litres) of urine. When the level of urine reaches about half this volume, the pressure of the accumulating fluid stimulates nervous impulses that relax the external sphincter and urination occurs. Subsequently, when MINDY's bladder is half full, ‘she’ urinates. Bladder capacity (BladderCapacity, litres) changes throughout pregnancy related to foetal size and within the day in relation to rumen fill. Both pregnancy and rumen fill reduce BladderCapacity and increase urination frequency, as well as reducing the volume of individual urination events. Then, if BladderVolume ⩾ BladderCapacity, MINDY empties the bladder, i.e. urinates.
MINDY's BladderVolume represents the current water content in the bladder. BladderCapacity is the current bladder capacity, which is calculated as the product of the maximum capacity of the bladder (MaxBladderCapacity, litres), pregnancy effect (BladderPregnancyFactor, proportion) and rumen volume effect (BladderRumenVolumeFactor, proportion). MaxBladderCapacity is a constant (8·0 litres) derived from model parameterization (see next section on model parameterization) modulated by body size. BladderPregnancyFactor is calculated as:
 $$BladderPregnancyFactor = PregnancyFactor^{kPregMaxBladder}$$
 $$PregnancyFactor = 1 - \displaystyle{{GravidUterus\;} \over {AnimalBodySize}}$$
PregnancyFactor ranges between 1 (non-pregnant) and ~0·85 before calving. GravidUterus is the fresh weight (kg) of the foetus plus the uterus, and kPregMaxBladder is a constant (1·2) that controls the reduction in urination trigger level as the foetus grows, due to the increased pressure on the bladder. BladderRumenVolumeFactor is calculated as:
 $$\eqalign{& {BladderRumenVolumeFactor} \cr & \quad= 1 - 0 {.} 8 \times e^{ - kRumVolMaxBladder \times RumenVolumefactor}}$$
 $$RumenVolumeFactor = Max\; \left( {0,1 - \displaystyle{{RumenDigesta} \over {MaximunRumenCapacity}}} \right)$$
kRumVolMaxBladder is a constant with a value of 3, which lowers the urination trigger level as the rumen fills up, due to increased pressure on the bladder. MaximunRumenCapacity (kg) is the capacity of the rumen to store fresh digesta. RumenVolumeFactor ranges between 0 (rumen full) to 1 (rumen empty).
The volume of each urination event equals the BladderVolume that triggers MINDY to empty the bladder. BladderVolume equals WaterUrine (litre/d), which drains any surplus water from WaterBody into the bladder. If this is not enough water to dilute UN as expected, it draws water from WaterBody even if there is no surplus; making MINDY thirsty, which stimulates ‘her’ to replenish WaterBody by drinking.
 $$\eqalign{{WaterUrine} &= {\rm MAX}\left( MinimunWaterUrineDilution, \right. \cr &\quad \left.MinimunWaterSurplusResidence \right)}$$
Urinary nitrogen concentration
The UN concentration (g/l) of each urination event at each urination time is calculated as follows:
 $$UN = \displaystyle{{UNAccumulatedSinceLastUrination} \over {BladderVolume}}$$
where UNAccumulatedSinceLastUrination (g) is accumulated urea in the blood since the last urination, and the BladderVolume is given by WaterUrine (Eqn (7)).
 $$\eqalign{{MinimumWaterUrineDilution} \!=\! 1000 \times \displaystyle{{{\rm UN}} \over {TargetConcentrationUN}}}$$
 $$\eqalign{&{TargetConcentrationUN} = MaximumConcentrationUN \cr & \qquad \times \left( {1 - e^{ - (kConcentrationUN \times UN)/(AnimalBodySize)}} \right)}$$
 $$ \eqalign{& MinimumWaterSurplusResidence \cr & \qquad = \left( {WaterPool - WaterPoolTaget} \right) \times kWaterUrine \cr & \qquad \quad \times AnimalBodySize} $$
where MinimumWaterUrineDilution (litre/d) is the minimum rate of water flowing to the bladder to achieve target dilution of the momentary N excretion rate. MinimumWaterSurplusResidence (litre/d) is the minimal amount of water flowing to the bladder required to excrete water surplus. TargetConcentrationUN (g/l) is the maximal concentration of N for the current N excretion rate as UN. MaximumConcentrationUN (10·56 g/l) is a constant representing the maximum concertation of UN at each urination event. MaximumConcentrationUN value was fitted to the UN data (corrected by BW) reported by Nennich et al. (Reference Nennich, Harrison, Vanwieringen, St-Pierre, Kincaid, Wattiaux, Davidson and Block2006), Broderick (Reference Broderick2003), Wattiaux & Karg (Reference Wattiaux and Karg2004), Burgos et al. (Reference Burgos, Robinson, Fadel and DePeters2005), Woodward et al. (Reference Woodward, Waugh, Roach, Fynn and Phillips2013) and Betteridge et al. (Reference Betteridge, Andrewes and Sedcole1986). kConcentrationUN (unitless) is an exponential decay constant fitted as MaximunConcentrationUN. kWaterUrine is an exponential constant (0·18) determining the flow (litre/d) of water to the bladder.
Model Parameterization and Cross-validation
Ten data sets (Betteridge et al. Reference Betteridge, Andrewes and Sedcole1986; Dado & Allen Reference Dado and Allen1993, Reference Dado and Allen1994; Aland et al. Reference Aland, Lidfors and Ekesbo2002; Jago et al. Reference Jago, Roche, Kolver and Woolford2005; Cardot et al. Reference Cardot, Le Roux and Jurjanz2008; Oudshoorn et al. Reference Oudshoorn, Kristensen and Nadimi2008; Clark et al. Reference Clark, Waghorn, Gregorini, Woodward and Clark2010a , Reference Clark, Mcleod, Glassey, Gregorini, Costall, Betteridge and Jago b ) were used to (a) parameterize the model, using the ‘Learn from All’ methodology described by Witten et al. (Reference Witten, Frank and Hall2011); (b) calculate each parameter's standard error using the bootstrap method (Efron Reference Efron1982, Reference Efron1983); and (c) calculate the model's predictive error using the cross-validation method (Witten et al. Reference Witten, Frank and Hall2011). These data sets included cows with different characteristics and diverse diets, reported pattern of water imbibed and urination and provided daily volumes of water in and urine excreted.
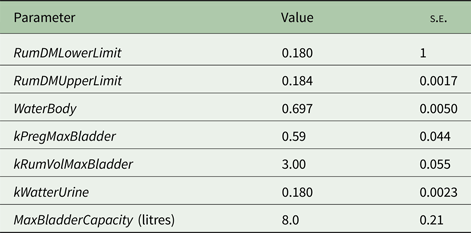
Model parameters standard errors were estimated using the bootstrap method (Efron Reference Efron1982, Reference Efron1983; Witten et al. Reference Witten, Frank and Hall2011) as follows: (1) selecting items (treatments means) from the whole data set randomly, so some items appeared more than once in the selection; (2) for each parameter, fixing all parameters except one to the best values from the cross-validation phase; (3) finding the best value for this parameter (i.e. the one that was fixed); (4) repeating steps 2 and 3 for each parameter; (5) repeating steps 1–4 with 5 different random selections and (6) calculating each parameter's standard error, from the X values collected, to get the standard errors of the model parameters. The model parameter estimates and standard errors are presented in Table 1. In all cases, the model parameters were well defined by the data as evidenced by the low standard errors (<10% of the respective estimates) of the parameter estimates.
Table 1. Model parameters estimates and standard errors ( s.e. )
The Cross-Validation phase was performed using methodology described by Witten et al. (Reference Witten, Frank and Hall2011): First, allocating the data (treatments’ means of data sets in this case) randomly into P groups, then excluding one group at a time – finding best parameters, collecting individual bias measurements for the excluded group, and repeating steps 1, 2 and 3 M times with different random allocation each time. Finally, averaging and reporting all the M × P deviance measurements from step 3 (i.e. all the excluded groups). The assessment of the model's predictive error was conducted using the mean square prediction of error (MSPE), the square root of MSPE and MSPE decomposition in mean and systematic bias and random error, as well as the mean absolute error (MAE) (Bibby & Toutenburg Reference Bibby and Toutenburg1977; Tedeschi Reference Tedeschi2006). MAE measures the average magnitude of the errors in a set of predictions, without considering their direction. It is the average over the test sample of the absolute differences between prediction and actual observation where all individual differences have equal weight. MSPE was calculated as follows:
 $${\rm MSPE} = \displaystyle{{\mathop \sum \nolimits_{i = 1}^n {\left[ {{\rm Observed} - {\rm Predicted}} \right]}^2} \over n}$$
The MSPE measures the distance between observed and predicted values, and its square root, RMSPE, is used to obtain the same units as the observed and predicted values. The RMSPE gives an estimation of the mean error amplitude, a RMSPE <10% and between 10 and 25% of observed mean indicates, respectively, satisfactory and acceptable predictions (Fuentes-Pila et al. Reference Fuentes-Pila, Delorenzo, Beede, Staples and Holter1996).
Results of the cross-validation indicate that MINDY predicts daily water imbibed, urination volume and frequency of urination with a RMSPE and MAE as % of the observed mean of 26·33 and 23·30%; 25·80 and 27·14%; 25·10 and 18·76%, respectively. The model displayed the following mean bias, systematic bias, and random error (MSPE decomposition, Tedeschi (Reference Tedeschi2006)) for daily water imbibed, urination volume and frequency of urination, respectively: 4·93, 33·75 and 61·31%; 90·19, 9·06 and 0·75%; and, 6·83, 8·42 and 84·74%. Decomposition of the MSPE, then, indicates that the structure of this new module in MINDY still needs improvement, especially in terms of daily water imbibed (model over-prediction) and daily urination volume (model over-prediction). This MSPE decomposition also indicates that considerable more, and more accurate (e.g. urination volumes and individual water imbibed under pastoral conditions) and specific data (e.g. bladder volume of dairy cows of various size and age) is needed to further parameterization and validation of MINDY's new module to ensure no lack-of-fit and account for non-random variation better. However, for a new development in an exploratory model like MINDY, these numbers (predictive errors) and the random errors, especially for urination frequency and water imbibed are encouraging, and reflect that the concepts encoded capture ‘relatively acceptable’ many of the underlying biological mechanisms that drive the diurnal pattern and daily UN excretion, as well as thirst.
MINDY's illustrative prediction of urination and UN patterns, as presented in the following section, suggests a realistic model response to herbage chemical composition and grazing managements. Model outputs are in close agreement with data reported by Shepherd et al. (Reference Shepherd, Shorten, Costall and MacDonald2017), when evaluating urine excretion from dairy cows under different farm systems. This indicates the model predicts UN concentration at the level of urination event within one standard deviation (s.d.) of the observed means.
Illustrations and Discussion
The current work has formulated and described a new development in MINDY, with a preliminary conceptual validation conducted under a range of feeding scenarios. Validation means the model is acceptable for its intended purpose because it meets specified performance requirements (Rykiel Reference Rykiel1996). The purpose of the present development was to integrate knowledge of urination physiology (Andersson & Arner Reference Andersson and Arner2004) and water dynamics (Silanikove Reference Silanikove1994; Maltz & Silanikove Reference Maltz and Silanikove1996; Kadzere et al. Reference Kadzere, Murphy, Silanikove and Maltz2002) responsible for frequency and variations in volume and UN into MINDY's framework. The context of the model is a ‘foraging ruminant’. Model performance was also assessed by MINDY's ability to simulate sensible diurnal patterns of urination and drinking in response to various grazing scenarios, commonly used in intensive pastoral dairy farms.
To illustrate these simulations, MINDY was presented to: (1) herbage with contrasting contents of crude protein; (2) different timings of pasture allocation; and (3) a period of restriction in available grazing time to determine whether MINDY's diurnal urination and drinking patterns were sensitive to herbage crude protein content or intake and management of grazing patterns, and if so, whether that would change daily excretion of N and water imbibed. In all simulations, the outputs required from MINDY were: intake rates of water and herbage, N concentration, frequency, volume and diurnal distribution of urination events, as well as frequency, volume and diurnal distribution of drinking events.
The effect of crude protein content of herbage on urinary nitrogen excretion pattern and water consumption
Urinary N excretion is related directly to N intake (Castillo et al. Reference Castillo, Kebreab, Beever, Barbi, Sutton, Kirby and France2001; Gregorini et al. Reference Gregorini, Beukes, Dalley and Romera2016). As N intake increases, UN excretions increase exponentially (Kebreab et al. Reference Kebreab, France, Mills, Allison and Dijkstra2002). Although this phenomenon is well documented and several models simulate it, there is a lack of information on the effect of crude protein in herbage on diurnal patterns of UN excretion and water consumption. Then a scenario where MINDY (initialized as a pregnant Friesian dairy cow (500 kg liveweight) in mid-lactation (150 day in milk)) grazed a Lolium perenne L. sward (9 cm height and 3000 kg DM/ha) under set stock grazing management with herbage containing either 200 or 300 g crude protein (CP)/kg DM was simulated. These levels of CP reflect the effect of low v. high levels of N fertilization (0–50 v. 205–300 kg N/ha) on pastures (Goswami & Willcox Reference Goswami and Willcox1969).
Figure 2 and Table 2 present MINDY's simulated diurnal patterns and daily values of UN excretion and water consumption, respectively, according to herbage crude protein content (g/kgDM). These results also account for different herbage intake patterns (meals’ frequency, duration and intensity). It must be noted that, in MINDY chemical composition, and dry matter content of herbage fluctuates during the day and amongst sward canopy strata (See Gregorini et al. (Reference Gregorini, Beukes, Romera, Levy and Hanigan2013) for details on equations)). Intake pattern, in conjunction with diurnal fluctuations in moisture content of the herbage (loss of moisture from dawn to dusk due to transpiration and evaporation and accumulation of dry matter (photosynthates)) determine water ingestion patterns throughout the day; which in turn determine daily water ingestion (64 v. 61 litres for 200 and 300 g CP/kg DM, respectively; Table 2).

Fig. 2. Predicted values of the effect of herbage crude protein content ((a) 200 v. (b) 300 g/kg DM) on urinary nitrogen (N) excretion and water consumption patterns of a dairy cow (500 kg liveweight, ~150 days in milk) grazing a Lolium perenne L. sward under set stocking grazing management (9 cm height and 3000 kg DM/ha)*. *x-axis is time of day, y-axis (green) is herbage intake rate, and z-axis (blue) water ingestion. Yellow squares are urinary N concentration for each urination event, Orange diamonds are individual volumes of urination events, and White triangles are drinking events with their respective volume of water imbibed.
Table 2. Predicted values of the effect of herbage crude protein content and grazing managements on daily values of urination and drinking behaviour variables
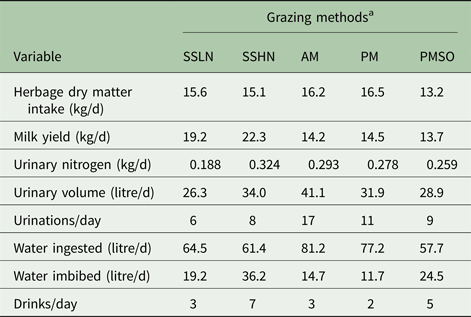
a SSLN, set stocked grazing low N ryegrass herbage; SSHN, set stocked grazing high crude protein herbage; AM, strip-grazed with the daily pasture strip allocated in the morning, 8 a.m.; PM, strip-grazed with the daily pasture strip allocated in the afternoon, 4 p.m.; and PMSO, strip-grazed with the daily pasture strip allocated in the afternoon, 4 p.m. and stood-off from pasture between milking events (6.00 and 15.00 h).
Herbage with high crude protein led MINDY to excrete a considerably greater amount (72% more) of UN compared with that excreted when grazing swards with low levels of crude protein. Similar results (115 v. 348 g UN/d) have been reported by Delagarde et al. (Reference Delagarde, Peyraud and Delaby1997) (cited by Castillo et al. Reference Castillo, Kebreab, Beever and France2000) for dairy cows grazing Lolium perenne L. swards fertilized with 0 and 250 kg N/ha, respectively. Patterns of urination also differed between treatments. Grazing swards with high crude protein led MINDY to have a greater urination frequency and a greater and steady concentration of N in each urination event (the difference between the highest and the lowest UN concentration were 0·3 v. 1·3 g/l for the low and high crude protein herbage, respectively).
Diurnal patterns of urination volumes were similar, with the greatest volumes overnight and early in the morning and the lowest after or within meals. This pattern reflects the eating pattern and the effect of rumen fill on bladder capacity. Such a pattern is supported by Betteridge et al. (Reference Betteridge, Costall, Li, Luo and Ganesh2013) and Shepherd et al. (Reference Shepherd, Shorten, Costall and MacDonald2017). When MINDY grazed herbage with a high level of crude protein, individual volumes of urination events were greater. This difference and the greater urination frequency led MINDY to produce eight litres extra of urine per day on the high crude protein diet.
As discussed above, cattle produce urine with a fixed ceiling for urine osmolality, ~1000 mmol/kg live weight (Maltz & Silanikove Reference Maltz and Silanikove1996). If the urea concentration in the kidneys is high, more water is required to dilute the urine (Silanikove Reference Silanikove1994; Maltz & Silanikove Reference Maltz and Silanikove1996), and water intake by drinking increases. Thus, ‘toxic’ increments in N supply to the animal, by ingestion and or digestion, lead to greater water excretion in urine and or excessive urine production; i.e. diuresis (Maltz & Silanikove Reference Maltz and Silanikove1996; Appuhamy et al. Reference Appuhamy, Wagner-Riddle, Casper, France and Kebreab2014). The upper volume of non-diuresis for dairy cows is around 15 litres/d (Maltz & Silanikove Reference Maltz and Silanikove1996). At relatively similar water ingestion, MINDY imbibed 17 litres more water when grazing high compared with low crude protein herbage, evidencing the greater need (also evidenced by the drinking frequency, seven v. three imbibing events) for water to dilute the increased surplus of N when consuming high compared with low crude protein herbage. These modelling results support the concept of diuresis and suggest feeding regimens with excess N cause diuresis. Associated phenomena, such as an excess of N intake and water consumption, are of particular interest from environmental, nutritional and animal welfare standpoints, as feed induced diuresis results in inefficiencies in water and N use by the animals.
The effect of grazing management on urinary nitrogen pattern and water consumption
Dietary management to dilute excess N in herbage from temperate swards, effectively reducing the N: fermentable carbohydrates ratio, reduces UN (Castillo et al. Reference Castillo, Kebreab, Beever and France2000; Gregorini et al. Reference Gregorini, Beukes, Bryant, Romera, Edwards and Bryant2010, Reference Gregorini, Beukes, Dalley and Romera2016). Thus grazing management that matches intake patterns with diurnal fluctuations in herbage chemical composition can reduce UN, as reported by Bryant et al. (Reference Bryant, Walpot, Dalley, Gibbs, Edwards, Edwards and Bryant2010) and Gregorini et al. (Reference Gregorini, Beukes, Bryant, Romera, Edwards and Bryant2010). However, most of the effort has focused on daily UN and production variables (Gregorini Reference Gregorini2012). To reduce UN load onto pastures, more information is needed on the effect of grazing management on the temporal distribution of urination and related N excretion.
Reducing grazing time on pasture can alter intake patterns of dairy cows without significant losses in milk production, and reduces UN load onto pastures (Oudshoorn et al. Reference Oudshoorn, Kristensen and Nadimi2008; Gregorini et al. Reference Gregorini, Clark, Jago, Glassey, Mcleod and Romera2009a ; Clark et al. Reference Clark, Mcleod, Glassey, Gregorini, Costall, Betteridge and Jago2010b ). Quantifying the effect of pasture restriction on diurnal patterns of UN and UN load (individual urination volume and N) onto pasture is not easy, and has not yet been investigated and reported thoroughly.
Three scenarios were simulated, where MINDY (initialized as a pregnant Friesian dairy cow (500 kg live weight) in late-lactation (200 day in milk)) strip-grazed a Lolium perenne L. sward (30 cm height (extended tiller length) and 3000 kg DM/ha), with strips (100 m2/d) allocated either after morning (8 a.m.) or afternoon milking (4 p.m.), or stand-off (restricted) from pasture between milkings with the new pasture strip allocated at 4 p.m. The mean crude protein and fibre contents of herbage were 240 and 480 g/kg DM, respectively (Note: In MINDY, the chemical composition of herbage fluctuates during the day and amongst sward canopy strata (see Gregorini et al. Reference Gregorini, Beukes, Romera, Levy and Hanigan2013 for details on equations)).
Figure 3 and Table 2 present MINDY's diurnal patterns and daily values of UN and water consumption, respectively, according to the timing of pasture allocation and the effect of a stand-off period from pasture. As in Fig. 2, these results also describe different herbage intake patterns, which influence water ingestion patterns throughout the day, and in turn the daily total ingestion of water (81, 77 and 58 litres/d for 8 a.m. and 4 p.m. pasture allocations and 4 p.m. with a stand-off period between milkings, respectively; Table 2).

Fig. 3. Predicted values of the effect of timing of pasture strip allocation ((a), 8 a.m. v. (b), 4 p.m., after morning and afternoon milkings) and (c), a period of restriction of pasture (8 a.m. to 2 p.m.) between milking on urinary nitrogen (N) excretion and water consumption patterns of a dairy cow (500 kg liveweight, ~200 days in milk) strip-grazing a Lolium perenne L. sward. *x-axis is time of day, y-axis (green) is herbage intake rate, and z-axis (blue) water ingestion. Yellow squares are Urinary N concentration for each urination event, Orange diamonds are individual volumes of urination events, and White triangles are drinking events with their respective volume of water imbibed.
Allocating the pasture after the afternoon milking v. the common practice of allocating it after the morning milking (Chris Glassey pers. comm.) led MINDY to excrete 29% less urine volume and 6% less UN. These results are explained by water ingestion and amount imbibed (14 v. 11 litres/d), as well as a reduction (~10%) in N intake. These results also indicate that opportunities exist to alter urination patterns through the timing of pasture allocation (Gregorini et al. Reference Gregorini, Villalba, Chilibroste and Provenza2017). As mentioned, daily and diurnal patterns of UN simulated by MINDY are in close agreement with empirical data reported by Shepherd et al. (Reference Shepherd, Shorten, Costall and MacDonald2017), when evaluating the UN excretion pattern of strip-grazed dairy cows under similar New Zealand conditions.
Excess N intake, and consequent diuresis is also described in the simulations with MINDY. The results are most dramatic in model outputs when a new pasture strip was allocated in the morning when herbages present the highest N: readily fermentable carbohydrate ratio (Gregorini Reference Gregorini2012). Other evidence of the need to dilute excess N by kidneys is that, even though MINDY ingested a considerable amount of water (herbage has the highest moisture content in the morning), ‘she’ drinks soon after such a big intake of water (Fig. 3). In conjunction with the high intake rate in the morning, such a water flow (ingested and imbibed) into and out of the rumen increases urination frequency and reduces the volume of individual urinations. Reductions in UN concentration per urination are seen even later in the day (~4 h) as a product of this phenomenon and the reduction of N intake in the hours subsequent to the late-afternoon early-evening meal.
The number of urination events (11 v. 17), mean volume (2·9 v. 2·4 litres) and their diurnal distribution (Fig. 3) when MINDY is allocated a new pasture strip at 4 p.m. is also different from morning allocations. With the afternoon allocation, the volume and UN deposited onto non-pasture surfaces (milking shed and races) was 0·130 and 0·032 of the respective totals, compared with 0·097 and 0·037 for the morning allocation. Overall, these results are close to the 0·85 of daily urine volume deposited onto pastures reported by Clark et al. (Reference Clark, Mcleod, Glassey, Gregorini, Costall, Betteridge and Jago2010b ) for late-lactation dairy cows strip-grazing Lolium perenne L. in New Zealand. These values are also similar to that (24 g N/d) for UN deposited on the non-pasture surfaces (Shepherd et al. Reference Shepherd, Shorten, Costall and MacDonald2017).
Clark et al. (Reference Clark, Mcleod, Glassey, Gregorini, Costall, Betteridge and Jago2010b ) also reported that reducing pasture accessibility by 8 h reduced urine volume deposited onto pasture by 50% when pasture was offered in two sets of 4 h after milking, and 56% when pasture was offered for eight continuous hours between milking events. Shepherd et al. (Reference Shepherd, Shorten, Costall and MacDonald2017) reported that restricting pasture between milking events can reduce UN load by 36·5% (i.e. captures in the stand-off pad and races). The present simulation with MINDY indicates a 27% reduction. Thus, MINDY's predictions of urination and UN patterns fall within expected ranges.
Summary and Concluding Remarks
The model development presented in the current paper makes explicit the functional relationships among direct and indirect controls of urination and UN, as well as the motivation of grazing ruminants to drink. Results of the evaluation indicate that the RMSPE and MAE, respectively, were 26 and 23% for daily water imbibed, 26 and 27% for urination volume, and 25 and 19% for the frequency of urination. Decomposition of the MSPE, i.e. mean biases and random errors, indicated that the structure of this new module in MINDY still needs some improvement and that more data is needed. Consequently, further parameterization and validation are needed. However, for a new development in an exploratory model like MINDY, these numbers are encouraging and reflect that the concepts encoded capture acceptably many of the underlying biological mechanisms that drive the diurnal pattern and daily UN excretion, as well as thirst.
MINDY reproduces patterns of urination acceptably, achieving the correct temporal occurrence and the relative volumes and N concentration of individual urination events of a grazing dairy cow as compared with the few reported in the literature. The model's response to those functional relationships also allows simulating daily UN and water ingestion in forage and imbibe for contrasting grazing managements and ingestion of herbages with different protein content. This is an advance in understanding and modelling of excretory and drinking behaviour patterns of free-range ruminants. Previous modelling efforts on N excretion or water intake have been either purely empirical or not comprehensive enough to include these more complex concepts. Therefore, MINDY represents a step forward.
Acknowledgements
Dr Dawn Dalley, Professor Eric Hillerton (DairyNZ, New Zealand) and Dr Tony Petch are gratefully acknowledged for reviewing the typescript, providing valuable comments, suggestions and constructive criticism.
This model development was completed as part of the Forages for Reduced Nitrate Leaching programme with principal funding from the New Zealand Ministry of Business, Innovation and Employment. The programme is a partnership between DairyNZ, AgResearch, Plant & Food Research, Lincoln University, Foundation for Arable Research and Landcare Research.


 Open access