


Health technology assessments and appraisals require reliable estimates of relative treatment effects to inform reimbursement decisions. When head-to-head evidence is not available but the two treatments of interest have each been studied against a common comparator (e.g., placebo or standard care), a standard indirect comparison may be performed using published aggregate data from each study (Reference Bucher, Guyatt, Griffith and Walter1). With larger numbers of treatments and studies a network meta-analysis is the standard approach, of which indirect comparison is a simple special case (Reference Dias, Sutton, Ades and Welton2;Reference Dias, Ades, Welton, Jansen and Sutton3). Standard indirect comparisons and network meta-analyses assume that the distributions of any effect modifying variables are similar in each study population and the decision target population, so that relative effects are constant across populations (the constancy of relative effects assumption).
These methods are widely used in health technology appraisals, such as those undertaken by the National Institute for Health and Care Excellence (NICE) in the United Kingdom. As part of the NICE technology appraisal process, a company submits evidence on the clinical effectiveness of their treatment compared with other relevant treatments, frequently informed by indirect comparisons or network meta-analysis. The submitting company will have individual patient data (IPD) available from their own trial or trials, but very often only published aggregate data (AgD) from those of their competitors. More recently, methods have been proposed which use the available IPD to adjust for differences between IPD and AgD study populations. These include matching-adjusted indirect comparison (MAIC) (Reference Signorovitch, Wu and Yu4) and simulated treatment comparison (STC) (Reference Caro and Ishak5), both first introduced in 2010, which use re-weighting or regression, respectively, to adjust the IPD estimates to the AgD study population.
MAIC is a re-weighting method, where weights are derived for the individuals in the IPD study such that the moments of the weighted covariate distribution match the covariate summaries reported in the AgD study (typically using mean and variance for continuous covariates, and proportions for categorical covariates). The weights are then used to obtain predicted outcomes in the AgD study population, for example by taking weighted mean outcomes on each treatment. STC is a regression adjustment method, where a regression model is fitted in the IPD study. This model is then used to predict average outcomes in the AgD study population. Whichever method is used, once the predicted outcomes are obtained for the AgD study population these are compared with the outcomes reported by the AgD study. The development and use of these methods is motivated by one of two reasons: either (i) there is evidence for effect modification, and these variables are distributed differently in each study population; or (ii) there is no common comparator or the relevant studies are single arm, and so adjustment is required for all prognostic and effect modifying variables.
Phillippo et al. (Reference Phillippo, Ades, Dias, Palmer, Abrams and Welton6;Reference Phillippo, Ades, Dias, Palmer, Abrams and Welton7) reviewed the properties and assumptions of population adjustment methods and provided recommendations for their use in submissions to NICE. As summarised in Table 1, population adjustment in anchored scenarios (where a common comparator is available) relaxes the constancy of relative effects assumption (to conditional constancy of relative effects) by adjusting for effect modifiers. In unanchored scenarios, a much stronger assumption is required (conditional constancy of absolute effects), because it is necessary to reliably predict absolute outcomes. This requires all effect modifiers and prognostic variables to be adjusted for, and is very difficult to achieve or justify, either empirically or otherwise. As such, unanchored comparisons are subject to unknown amounts of residual bias due to unobserved prognostic variables and effect modifiers (Reference Phillippo, Ades, Dias, Palmer, Abrams and Welton6;Reference Phillippo, Ades, Dias, Palmer, Abrams and Welton7).
Table 1. All indirect comparisons and meta-analyses require some form of constancy assumption.
Note. Unanchored comparisons require a much stronger assumption, which is widely considered impossible to meet.
IPD, individual patient data.
Although statistical theory is clear on which variables must be adjusted for to obtain an unbiased indirect comparison, in practice variable selection requires judgement and justification (Reference Phillippo, Ades, Dias, Palmer, Abrams and Welton6). For anchored comparisons, evidence of effect modifier status on the chosen scale should be provided before analysis. Unanchored comparisons are very difficult to justify, but a principled approach to selecting variables before analysis should be taken to avoid “gaming.”
The level of overlap in the covariate distributions between the IPD and AgD study populations is another key property of population adjusted indirect comparisons. For regression-based methods such as STC, the lesser the overlap the greater the amount of extrapolation required, which requires additional assumptions to be valid. For re-weighting methods such as MAIC, extrapolation is simply not possible; sufficient overlap is, therefore, crucial for re-weighting methods. As well as checking the distributions of the covariates in each study, a simple indicator of the amount of overlap is the effective sample size (ESS), which may be calculated from the weights (Reference Phillippo, Ades, Dias, Palmer, Abrams and Welton6). Large reductions in ESS may indicate poor overlap between the IPD and AgD studies; small absolute ESS shows that the comparison is dependent on a small number of individuals in the IPD study and may be unstable.
MAIC and STC were both designed with simple indirect comparisons in mind and do not generalize naturally to larger networks of studies or treatments, where there may be multiple comparators of interest and/or multiple aggregate study populations. We are, therefore, interested in the prevalence of such scenarios in NICE TAs, to determine how larger network structures have been handled using current methods and to motivate the development of more appropriate methods. In this study, we undertake a comprehensive review of technology appraisals (TAs) published by NICE (8), aiming to characterize the use of population adjustment methods. As well as investigating the uptake of population adjustment in different clinical areas, we are interested in the ways in which these methods are used and whether the key assumptions are likely to hold, to assess the adequacy of current practice for decision making. We discuss how these methods have been received by appraisal committees and how they have impacted decision making. We conclude with a discussion, and suggest several key improvements to current practice, toward providing better evidence for decision makers and greater impact for submitting companies.
Methods
We reviewed all NICE TAs published between January 1, 2010, and April 20, 2018, for the use of population adjustment methods. We excluded appraisals that had access to IPD from all included studies, and focussed on those with only partial availability of IPD. From those appraisals using one or more forms of population adjustment, we extracted the following information from company submissions: Population adjustment method used; Whether the comparison was anchored or unanchored; Outcome type; Clinical area; Number of covariates adjusted for; How the covariates were chosen; For appraisals using MAIC, effective sample sizes after weighting; Whether a larger network structure was present (e.g., multiple comparators and/or aggregate studies), and how this was dealt with.
Screening and data extraction were carried out by a single primary reviewer (D.M.P.).
Results
A total of 268 technology appraisals have been published by NICE since 2010, when MAIC and STC were first suggested in the literature (Reference Signorovitch, Wu and Yu4;Reference Caro and Ishak5), up until April 20, 2018. Of these, twenty-one appraisals used a form of population adjustment; three of these had IPD available from all included studies, so we focus on the remaining eighteen appraisals with only partial IPD. Figure 1 shows the selection process. The included appraisals are tabulated in Supplementary Table 1.

Fig. 1. Flow chart showing the process of selecting technology appraisals, and the numbers excluded and remaining at each stage. IPD, individual patient data; NICE, United Kingdom National Institute for Health and Care Excellence; TA, technology appraisal.
The first use of population adjustment in a TA was TA311 in 2014. Since then, the use of population adjustment in TAs has increased rapidly, in terms of both the absolute number and the relative proportion of appraisals using population adjustment methods (Figure 2). In 2017, a total of nine appraisals used population adjustment, accounting for 14.5 percent of all appraisals that year.
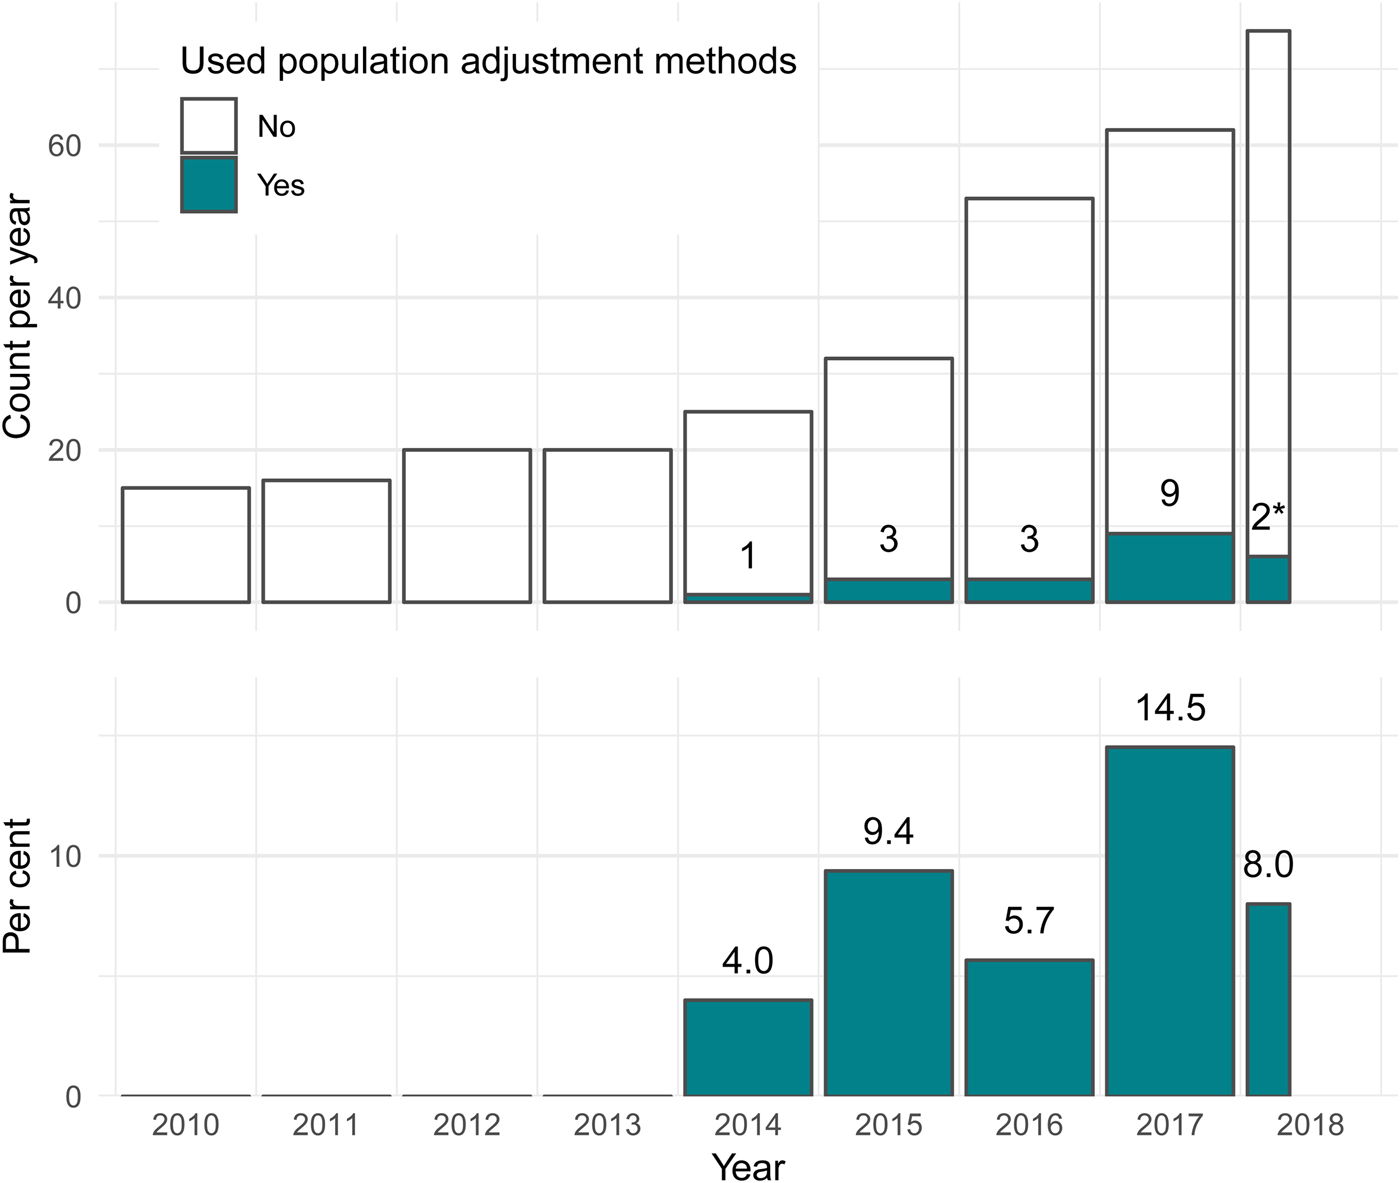
Fig. 2. The number and percentage of NICE technology appraisals using population adjustment methodology has increased greatly since the introduction of these methods in the literature in 2010. *Two TAs used population adjustment out of twenty-five up to April 20, 2018. NICE, United Kingdom National Institute for Health and Care Excellence; TA, technology appraisal.
Usage by Clinical Area
Since 2010, almost half of all published TAs have been in oncology (127 of 268; 47.4 percent). Of these, fifteen (11.8 percent) used population adjustment, accounting for over 80 percent of all applications of population adjustment in appraisals to date. Only two other clinical areas saw any applications of population adjustment: two out of twelve (16.7 percent) appraisals in hepatology (both for hepatitis C), and one out of 28 (3.6 percent) appraisals in rheumatology. The usage of population adjustment methods in oncology TAs has increased since 2010, both in terms of the number and proportion of TAs using these methods. In 2017, a total of nine appraisals in oncology (25.7 percent) used population adjustment methods, up from one appraisal (9.1 percent) in 2014 (Figure 3). The increasing use of population adjustment in oncology appraisals, which themselves make up the largest proportion of all appraisals, is the main driver behind the overall results in Figure 2.
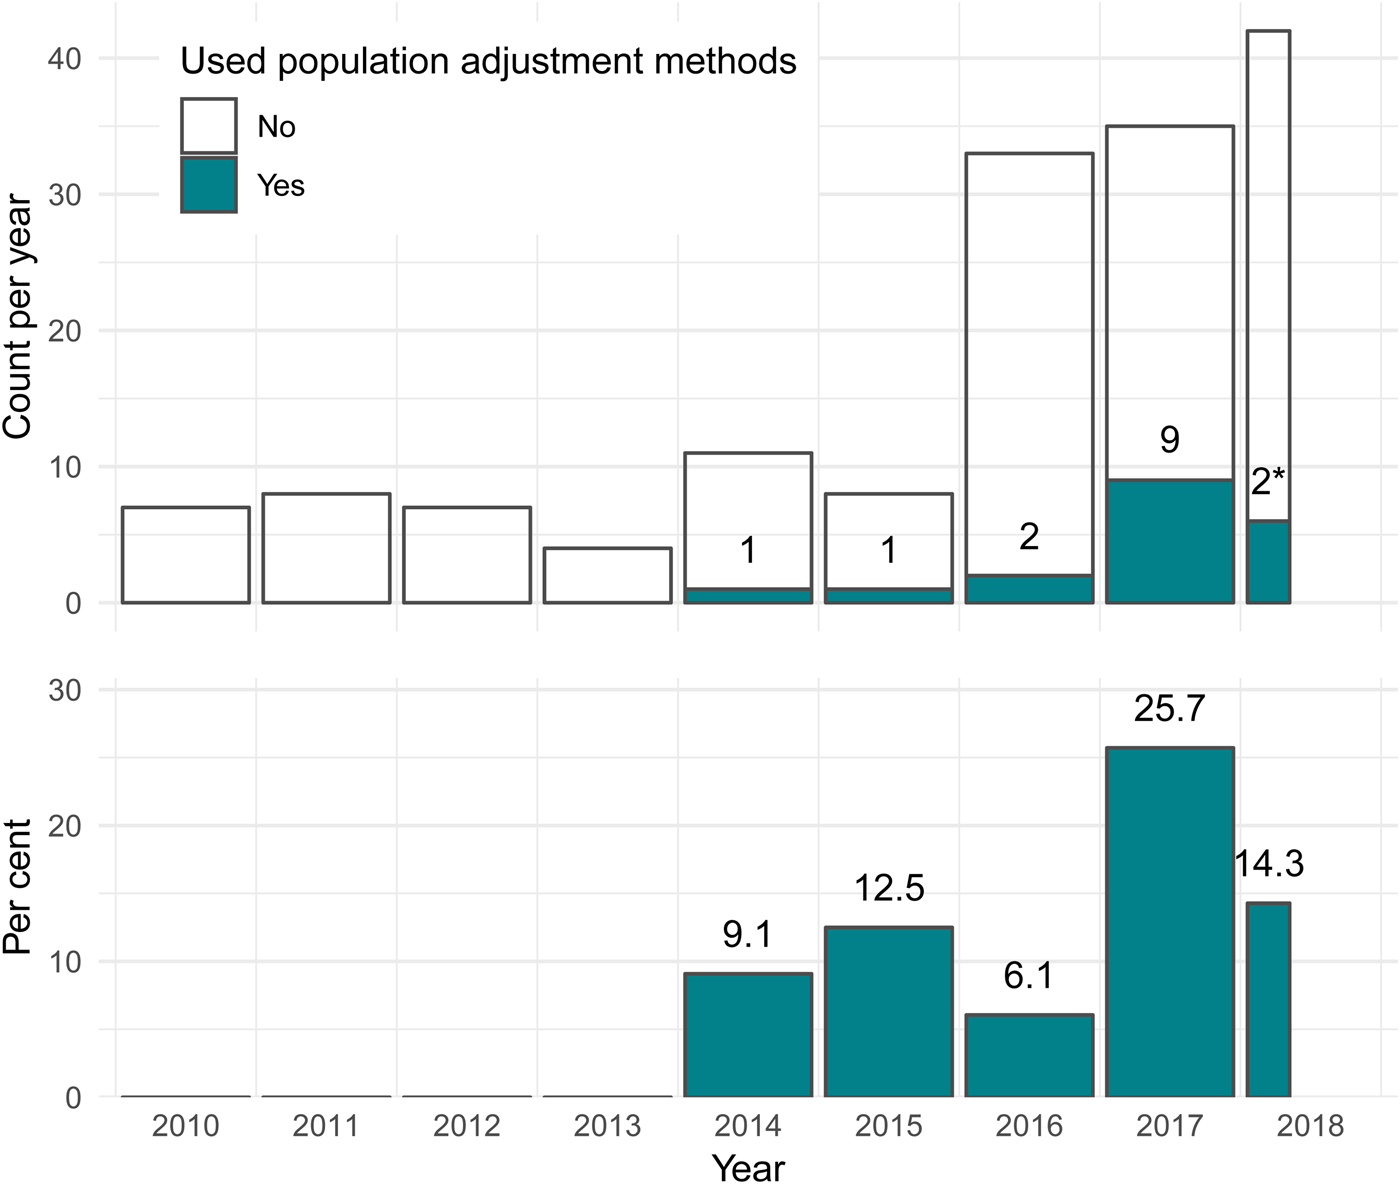
Fig. 3. For technology appraisals in oncology, the number and percentage using population adjustment methodology has increased greatly since the introduction of these methods in the literature in 2010. *Two TAs used population adjustment out of twelve up to April 20, 2018. TA, technology appraisal.
Outcome Types
Unsurprisingly, due to the majority of applications of population adjustment being in oncology appraisals, survival outcomes (e.g., progression-free survival, overall survival) were the most common outcome type used in population-adjusted analyses, thirteen of eighteen appraisals (72.2 percent) included a population-adjusted survival outcome. Rate outcomes such as response rates were used in five appraisals, and duration and change from baseline outcomes in one appraisal each. Two appraisals (TA462, TA451) used population adjustment for more than one type of outcome (survival and response rate, and response rate and duration, respectively).
Population Adjustment Method
The large majority of appraisals using some form of population adjustment used MAIC (16 of 18; 88.9 percent). STC was less popular, used in only three appraisals (16.7 percent). Two appraisals used both MAIC and STC and compared the results, which were reported to be similar in each case (TA383, TA492).
One appraisal (TA410) used neither MAIC nor STC. In this appraisal, a published prediction model (developed for a previous appraisal) (9) was used to adjust the survival curves from the AgD trials to the population of the IPD trial.
Of the sixteen appraisals performing MAIC, only nine (56.3 percent) reported an effective sample size. Of these, the median effective sample size was 80.0 (range: 4.0 to 335.5, interquartile range [IQR]: 15.4 to 52.0), with a median reduction in effective sample size from the original sample size of 74.2 percent (range: 7.9 percent to 94.1 percent, IQR: 48.0 percent to 84.6 percent). Such large reductions in ESS indicate that in many cases there may be poor overlap between the IPD and AgD studies. A substantial proportion of TAs reported small absolute ESS, and the resulting comparisons are, therefore, dependent on a small number of individuals in the IPD study and may be unstable.
Anchored and Unanchored Comparisons
Only two of eighteen appraisals (11.1 percent) formed anchored comparisons (TA383, TA449). The remaining sixteen appraisals (88.9 percent) instead formed unanchored comparisons without a common comparator, relying on strong assumptions that are very difficult to justify and are thus subject to unknown amounts of residual bias. No appraisals attempted to quantify residual bias, although this is challenging to achieve (Reference Phillippo, Ades, Dias, Palmer, Abrams and Welton6). Appraisal committees and review groups treated estimates from unanchored comparisons with strong caution.
Covariates Adjusted for
For appraisals reporting unanchored comparisons, the median number of covariates adjusted for was six, and ranged from one to thirteen covariates. Only one of the two appraisals reporting anchored comparisons presented any information on the choice of covariates; in this appraisal (TA383) ten covariates were adjusted for.
Common covariates adjusted for in oncology appraisals were age, Eastern Cooperative Oncology Group (ECOG) performance status, gender, and the number and/or type of previous therapies. Many appraisals also adjusted for other clinical factors such as biomarker levels or disease subtypes.
Both hepatitis C appraisals (TA364, TA331) adjusted for age, body mass index, gender, fibrosis staging, and viral load. One appraisal (TA364) further adjusted for race, genotype, and several biomarker levels in two MAIC analyses for different genotypes and comparator treatments, but in a third MAIC analysis only had sufficient sample size to adjust for viral load.
The single rheumatology appraisal (TA383) adjusted for ten covariates including age, gender, race, concomitant treatments, two biomarkers, and three functional/activity scores.
The most common justification for covariate selection amongst appraisals reporting unanchored comparisons was simply to adjust for all baseline characteristics reported in both studies. This was also true for appraisal TA383 which used an anchored comparison, despite the fact that adjustment is only required for covariates which were effect modifiers in anchored comparisons. (The other appraisal with an anchored comparison, TA449, did not report any information on variable selection.) Unnecessary adjustment will not introduce bias but may increase uncertainty, particularly with MAIC (Reference Phillippo, Ades, Dias, Palmer, Abrams and Welton6) (although we note that TA383 took place before the advice in Phillippo et al. (Reference Phillippo, Ades, Dias, Palmer, Abrams and Welton6) was published). Two appraisals (TA429, TA457) justified the selection of covariates using expert clinical opinion. One appraisal using MAIC (TA510) asked experts to rank covariates by importance, then added covariates into the model one-by-one in decreasing order of importance; the final model choice was determined by consideration of effective sample size.
Unanchored MAICs in particular have to make trade-offs between effective sample size and the number of adjustment variables, because the number of potential prognostic factors is likely to be large. However, unless all prognostic factors and effect modifiers are included in the adjustment, the estimates will remain biased (Reference Phillippo, Ades, Dias, Palmer, Abrams and Welton6). Moreover, the covariates for which the effective sample size reduction is greatest are those which are most imbalanced between populations, and are, therefore, more important to adjust for amongst the covariates with similar prognostic or effect modifying strength. Two appraisals using STC used statistical techniques to choose covariates. One (TA333) selected covariates that were “significant” in the regression model, which is again likely to incur residual bias, particularly in small samples (Reference Steyerberg, Eijkemans and Habbema10). Another (TA492) selected covariates to maximise cross-validated predictive performance, which is more appropriate given that STC relies on accurate predictions into the aggregate population, but is still subject to the limitations of in-sample validation (Reference Phillippo, Ades, Dias, Palmer, Abrams and Welton6).
Larger Networks
As originally proposed, MAIC and STC cannot be extended to larger network structures with multiple comparators of interest and/or multiple aggregate studies. However, these scenarios frequently arise in practice: a total of ten of eighteen TAs (55.6 percent) involved larger networks of treatments and studies.
In five of these (71.4 percent; TA331, TA383, TA429, TA500, TA510), multiple population adjusted indirect comparisons were performed and then simply left as stand-alone estimates. Each of these estimates will be valid for different target populations, and so cannot be interpreted together coherently unless additional assumptions are met, namely that all the target populations are in fact identical (in terms of effect modifiers for anchored comparisons, and also in terms of prognostic variables for unanchored comparisons).
One appraisal (TA492) used STC (and MAIC as a sensitivity analysis) to predict active treatment arms for each single-arm study in an unconnected network, and then analysed this newly connected network using network meta-analysis (NMA). This results in a coherent set of relative effect estimates (Reference Caldwell, Ades and Higgins11). However, aside from the very strong assumptions required for the unanchored comparisons, this analysis must also assume that there are no imbalances in effect modifiers between the single-arm studies included in the NMA. Another serious concern is the repeated use of the predicted active treatment arms, which are all based on the same data set and so are not independent.
Two appraisals (TA311, TA380) had wider networks of treatments and studies including the two treatments of primary interest, but that were not fully connected. These networks were analysed using NMA (without any population adjustment) using an equivalency assumption for two treatments (TA311) and a matched pairs analysis (TA380) to connect the networks. Separate unanchored MAICs were then used to create population-adjusted comparisons as sensitivity analyses.
One appraisal (TA427) had additional single-arm IPD sources which were used to provide additional stand-alone comparisons (in this case using Cox regression for survival outcomes).
Lastly, the method of analysis was unclear for one appraisal (TA364) which had multiple comparators of interest, some with several aggregate studies available. However, given that unanchored MAIC was used, this analysis is susceptible to the same sets of pitfalls described above depending on whether the estimates were left as stand-alone estimates or synthesised as a network.
Discussion
In this review, we have focussed on the use of population adjustment methods in NICE Technology Appraisals. Different practices may be found in submissions to other reimbursement agencies, who may also receive and interpret such analyses differently, and outside of the technology appraisal context. A general review of applications in the literature has previously been published by Phillippo et al. (Reference Phillippo, Ades, Dias, Palmer, Abrams and Welton6) and found similar issues to those discussed here, although with even greater variation in analysis practices. This review of TAs also spans a limited time period (8 years) since these methods were first published. Practice is likely to continue to evolve, for example as methodological guidance is published (Reference Phillippo, Ades, Dias, Palmer, Abrams and Welton6). A further limitation of this review is that the data extraction was carried out by a single reviewer only.
Population adjustment methods (and in particular unanchored MAIC) have been used in NICE TAs either as the main source of comparative clinical effectiveness, or as supportive evidence alongside the company's base-case analysis. Although these methods may account for some differences between study populations that conventional indirect comparison methods cannot, appraisal committees were often concerned by the quality of the estimates they produced. This was not necessarily due to inherent methodological limitations; rather, the methods were used in situations where the data underpinning the analyses were often weak (for example, immature follow-up data or small single arm studies).
Furthermore, population-adjusted comparisons were often associated with uncertainty regarding the covariates that were adjusted for, specifically, which ones were selected for adjustment, how they were selected, and whether and to what extent any unobserved characteristics biased the analysis. A key challenge to appraisal committees, especially with unanchored comparisons, was where to draw the line between the number of variables to adjust for and the precision of the resulting estimates. This was particularly apparent for MAIC, where the effective sample size decreases with each additional covariate adjusted for.
In NICE TAs, decisions are not based solely on clinical effectiveness; cost considerations are also taken into account in a cost-effectiveness analysis, summarised by an incremental cost-effectiveness ratio (ICER). The impact of evidence from population-adjusted indirect comparisons is, therefore, understood within this context. In some instances, appraisal committees could not make a positive recommendation for the technology because the uncertainty in the population-adjusted estimates were not offset by a sufficiently low ICER to manage the decision risk. Where the appraisal committee made a positive recommendation, the committee typically compared the most plausible ICER against the lower end of the acceptable range (requiring the technology to be more cost effective) to minimise the risks associated with uncertainty. Where appraisal committees judged a technology to have plausible potential to be cost-effective, they often recommended the use of the technology with interim funding as part of a data collection arrangement.
In general, appraisal committees tended to use population adjustment methods for decision-making when they were presented alongside an alternative, confirmatory analysis, and when the uncertainty in the method was acknowledged, described, and explored as far as possible (for example using sensitivity analyses). Appraisal committees have previously suggested that companies should also consider validating the results of their analyses (e.g., TA510), for example by estimating the effect of the technology using population adjustment methods in an external cohort (such as registry data) and comparing that estimate with the observed effect of the technology in that cohort.
Population adjustment methods are becoming ever more prevalent in NICE TAs. The majority were unanchored with no common comparator, and hence rely on very strong assumptions as outlined in Table 1. The proliferation of unanchored analyses is likely to escalate, in large part due to the rise of single-arm studies for accelerated or conditional approval with regulators such as the US Food and Drug Administration or the European Medicines Agency (Reference Hatswell, Baio, Berlin, Irs and Freemantle12). However, the evidential requirements for demonstrating clinical efficacy (to obtain licensing) can be less stringent than those for demonstrating cost effectiveness (to obtain reimbursement). NICE appraisal committees and evidence review groups have been justifiably wary of the use of unanchored population adjustment methods to bridge this evidence gap, with many commenting that the results should be interpreted with caution and may contain an unknown amount of bias. As such, committees typically looked for greater cost effectiveness (lower ICER) to minimise the decision risk resulting from clinical effectiveness evidence perceived to be uncertain and poor quality. Increased dialogue between regulators and reimbursement agencies may help bridge this gap in evidence requirements.
All current population adjustment methods assume that there are no unmeasured effect modifiers when making anchored comparisons. For unanchored comparisons, it is further assumed that there are no unmeasured prognostic factors. This latter assumption is particularly strong and difficult to justify. Some suggestions for quantifying residual bias due to unmeasured confounding are made by Phillippo et al. (Reference Phillippo, Ades, Dias, Palmer, Abrams and Welton6), and this is an area for further work.
Several technology appraisals had multiple comparators and/or AgD study populations for which comparisons were required. Current MAIC and STC methodology cannot handle larger network structures: multiple analyses were performed in each case, and then either left as stand-alone comparisons or themselves synthesised using network meta-analysis, requiring further assumptions in the process. Furthermore, current MAIC and STC methods produce estimates which are valid only for the aggregate study population (typically that of a competitor) without additional assumptions, which may not match the target population for the decision (Reference Phillippo, Ades, Dias, Palmer, Abrams and Welton6). This fact has been largely overlooked in appraisals to date, although one appraisal (TA451) did note that the MAIC analysis that was performed took the results of an IPD trial deemed to be relevant to the decision population and adjusted them into a nonrepresentative aggregate trial population.
Clearly, if effect modification is present then it is not enough to simply produce “unbiased” estimates: the estimates produced must be specific to the decision population, otherwise they are of little use to decision-makers. This motivates the need to develop new methods which can extend naturally to larger networks of treatments, and can produce estimates for a given target decision population. Furthermore, if all trials are a subset of the decision target population with respect to one or more effect modifiers, then any adjustment must rely on extrapolation; if these effect modifiers are discrete, adjustment may be impossible.
The large majority of technology appraisals used MAIC to obtain population-adjusted indirect comparisons. Effective sample sizes were typically small and often substantially reduced compared with the original sample sizes, indicating potential lack of overlap between the IPD and AgD populations. Lack of overlap is of particular concern with re-weighting methods such as MAIC, because they cannot extrapolate to account for covariate values beyond those observed in the IPD and, thus, may produce estimates that remain biased even when all necessary covariates are included in the model (Reference Phillippo, Ades, Dias, Palmer, Abrams and Welton6). This motivates the need for simulation studies to explore the robustness of MAIC (and other population adjustment methods) in scenarios where there is a lack of overlap between populations.
Three appraisals were excluded from our review, as IPD were available from all included studies (13–15). These appraisals were all unanchored comparisons of survival outcomes in oncology, and used a selection of propensity score, covariate matching, and regression methods. Having IPD available from all studies is the gold-standard and is preferable if at all possible. This is because IPD allows for analyses that have more statistical power and may rely on less stringent assumptions, and allows assumptions to be tested. Separate methodological guidance is available for analyses with full IPD (Reference Faria, Hernandez Alava, Manca and Wailoo16).
For population-adjusted analyses to have the desired impact on decision making in technology appraisals, several key improvements are needed to current practice in line with recent guidance (Reference Phillippo, Ades, Dias, Palmer, Abrams and Welton6). First, a target population relevant to decision makers should be defined, and estimates must be produced for this population to be relevant. Current population adjustment methods can only produce estimates valid for the population represented by the aggregate study unless further assumptions are made, which may not represent the decision at hand; this has been largely overlooked in appraisals to date (although note that several of the TAs we identified pre-date published guidance).
For anchored comparisons there should be clear prior justification for effect modification, based on empirical evidence from previous studies and/or clinical expertise. Appraisals reporting anchored comparisons to date did not provide any such justification. Unanchored comparisons require reliable predictions of absolute effects by means of adjustment for both prognostic and effect-modifying covariates, and are highly susceptible to unobserved confounding due to a lack of randomisation. Simply adjusting for all available covariates, as is currently common practice, is not sufficient.
For unanchored comparisons to be impactful, covariates should be selected with predictive performance in mind and estimates of the potential range of residual bias are required; otherwise, the amount of bias in the estimates is unknown and may even be larger than for an unadjusted comparison. This is not easy to achieve (some suggestions are made in (Reference Phillippo, Ades, Dias, Palmer, Abrams and Welton6)), but without such reassurance appraisal committees are likely to remain justifiably wary of unanchored analyses. Many of the above issues can be mitigated, at least in part, by the availability of IPD from all studies in an analysis, and thus the increased sharing of IPD is greatly encouraged.
Author ORCIDs
David M. Phillippo, 0000-0003-2672-7841
Supplementary material
The supplementary material for this article can be found at https://doi.org/10.1017/S0266462319000333
Conflicts of interest
N.J.W. is PI on a methodology grant jointly funded by the MRC and Pfizer Ltd. Pfizer part fund a junior researcher. The project is purely methodological and unrelated to this work. D.M.P., S.D., A.E., and A.E.A. declare that they have no conflicts of interest.


 Open access