


1 Introduction
One of the primary tasks in consumer product design is to translate consumer information to engineering requirements. Specifically, the designer identifies and maps how consumer factors relate to technical product attributes that ultimately influence consumer purchase behavior. Traditionally, the consumer information is mapped onto a single latent construct – utility. In addition to utility, there are other latent constructs, also referred to as psychological constructs, which influence consumer preferences. An alternative approach in understanding these preferences comes from behavioral research in consumer psychology where psychological constructs measuring specific thoughts, perceptions and attitudes are mapped onto a network of interconnected judgements that predict downstream consumer preference. This network of interconnected judgements can be viewed as a causal path structure, which can be traced to understand the reason behind a perception or downstream use intention.
Another factor that affects consumer perception is user–product interaction. User–product interaction and associated data refers to the physical interaction of the user with the product. Traditional methods like Discrete Choice Analysis and Conjoint Analysis do not incorporate user–product interaction data in a quantitative manner. Survey data is not able to capture this type of granular, low-level data pertaining to product usage. For example, survey data is unable to capture the orientation of a shoe while walking, individual characteristics and patterns while running, changes in usage patterns, etc. However, such user–product interaction data may be instrumental in mapping of consumer perceptions to the product attributes affecting consumer choice.
Cyber-Empathic Design (CED) is a data-driven product design framework that captures user–product interaction to better understand consumers’ perception about a product (Ghosh et al. Reference Ghosh, Olewnik, Kim, Lewis and Lakshmanan2017a ). Current application, as envisioned in this work, is restricted to product re-design cases. In CED, the user–product interaction data is captured using product embedded sensors, which are mapped onto a network of psychological constructs using Covariance-Based Structural Equation Modeling (CB-SEM). The effectiveness of the model hinges on the quality of features extracted from the raw sensor data. In this work features are the high-level representations of raw time series sensor data (e.g., statistical measures such as the mean and max values of raw pressure from sensors).
Further, CB-SEM has a requirement for the input data to be normally distributed (Anderson & Gerbing Reference Anderson and Gerbing1988), which can be restrictive in practice. Designing and extracting features from raw sensor data, along with the restriction of normally distributed data results in CED being a manual and highly iterative process. Considering these challenges, there is motivation to automate the process.
The objectives of this technical brief are to investigate automating the process of feature extraction by using an unsupervised deep learning technique in the form of Autoencoders (Hinton & Zemel Reference Hinton, Zemel, Cowan, Tesauro and Alspector1994; Vincent et al. Reference Vincent, Larochelle, Bengio and Manzagol2008) and also to alleviate the requirement of multi-variate normal distribution on input data by using Partial Least Squares Structural Equation Modeling (PLS-SEM) (Hair, Ringle & Sarstedt Reference Hair, Ringle and Sarstedt2011; Becker, Klein & Wetzels Reference Becker, Klein and Wetzels2012; Ringle, Sarstedt & Straub Reference Ringle, Sarstedt and Straub2012; Wong Reference Wong2013) as the modeling technique.
A brief overview of Autoencoders and PLS-SEM is presented in Section 2. Then the proposed approach and architecture are presented in Section 3, followed by a case study with results and discussion in Section 4. Finally, in Section 5, conclusions are presented.
2 Related work
This section presents a brief review of the unsupervised deep learning method integrating Autoencoders and PLS-SEM. An in-depth review of the existing work in design analytics, motivations and the mechanics of CED are presented in (Ghosh et al. Reference Ghosh, Olewnik, Kim, Lewis and Lakshmanan2017a ). A limitation of the CED framework is that information representing user–product interaction is extracted manually from raw sensor data (i.e., features from raw sensor data as in Figure 1). This reliance on pre-designed sensor features is limited by the extent of the domain knowledge of the designers and typically requires significant knowledge to identify relevant features for different contexts (Ghosh, Olewnik & Lewis Reference Ghosh, Olewnik and Lewis2017b ). The investigation undertaken in this work is focused on an approach to automate extraction of measurement features from raw sensor data to be mapped on the model of latent constructs representative of user perceptions (Figure 1). In addition, the original CED framework relies on CB-SEM and therefore assumes multi-variate normal distributions of input data, which is limiting since sensor-based data is likely to have a variety of distribution types. Unsupervised deep learning techniques can be effective in automating feature extraction, while PLS-SEM can be effective by relaxing the input data distribution assumptions.
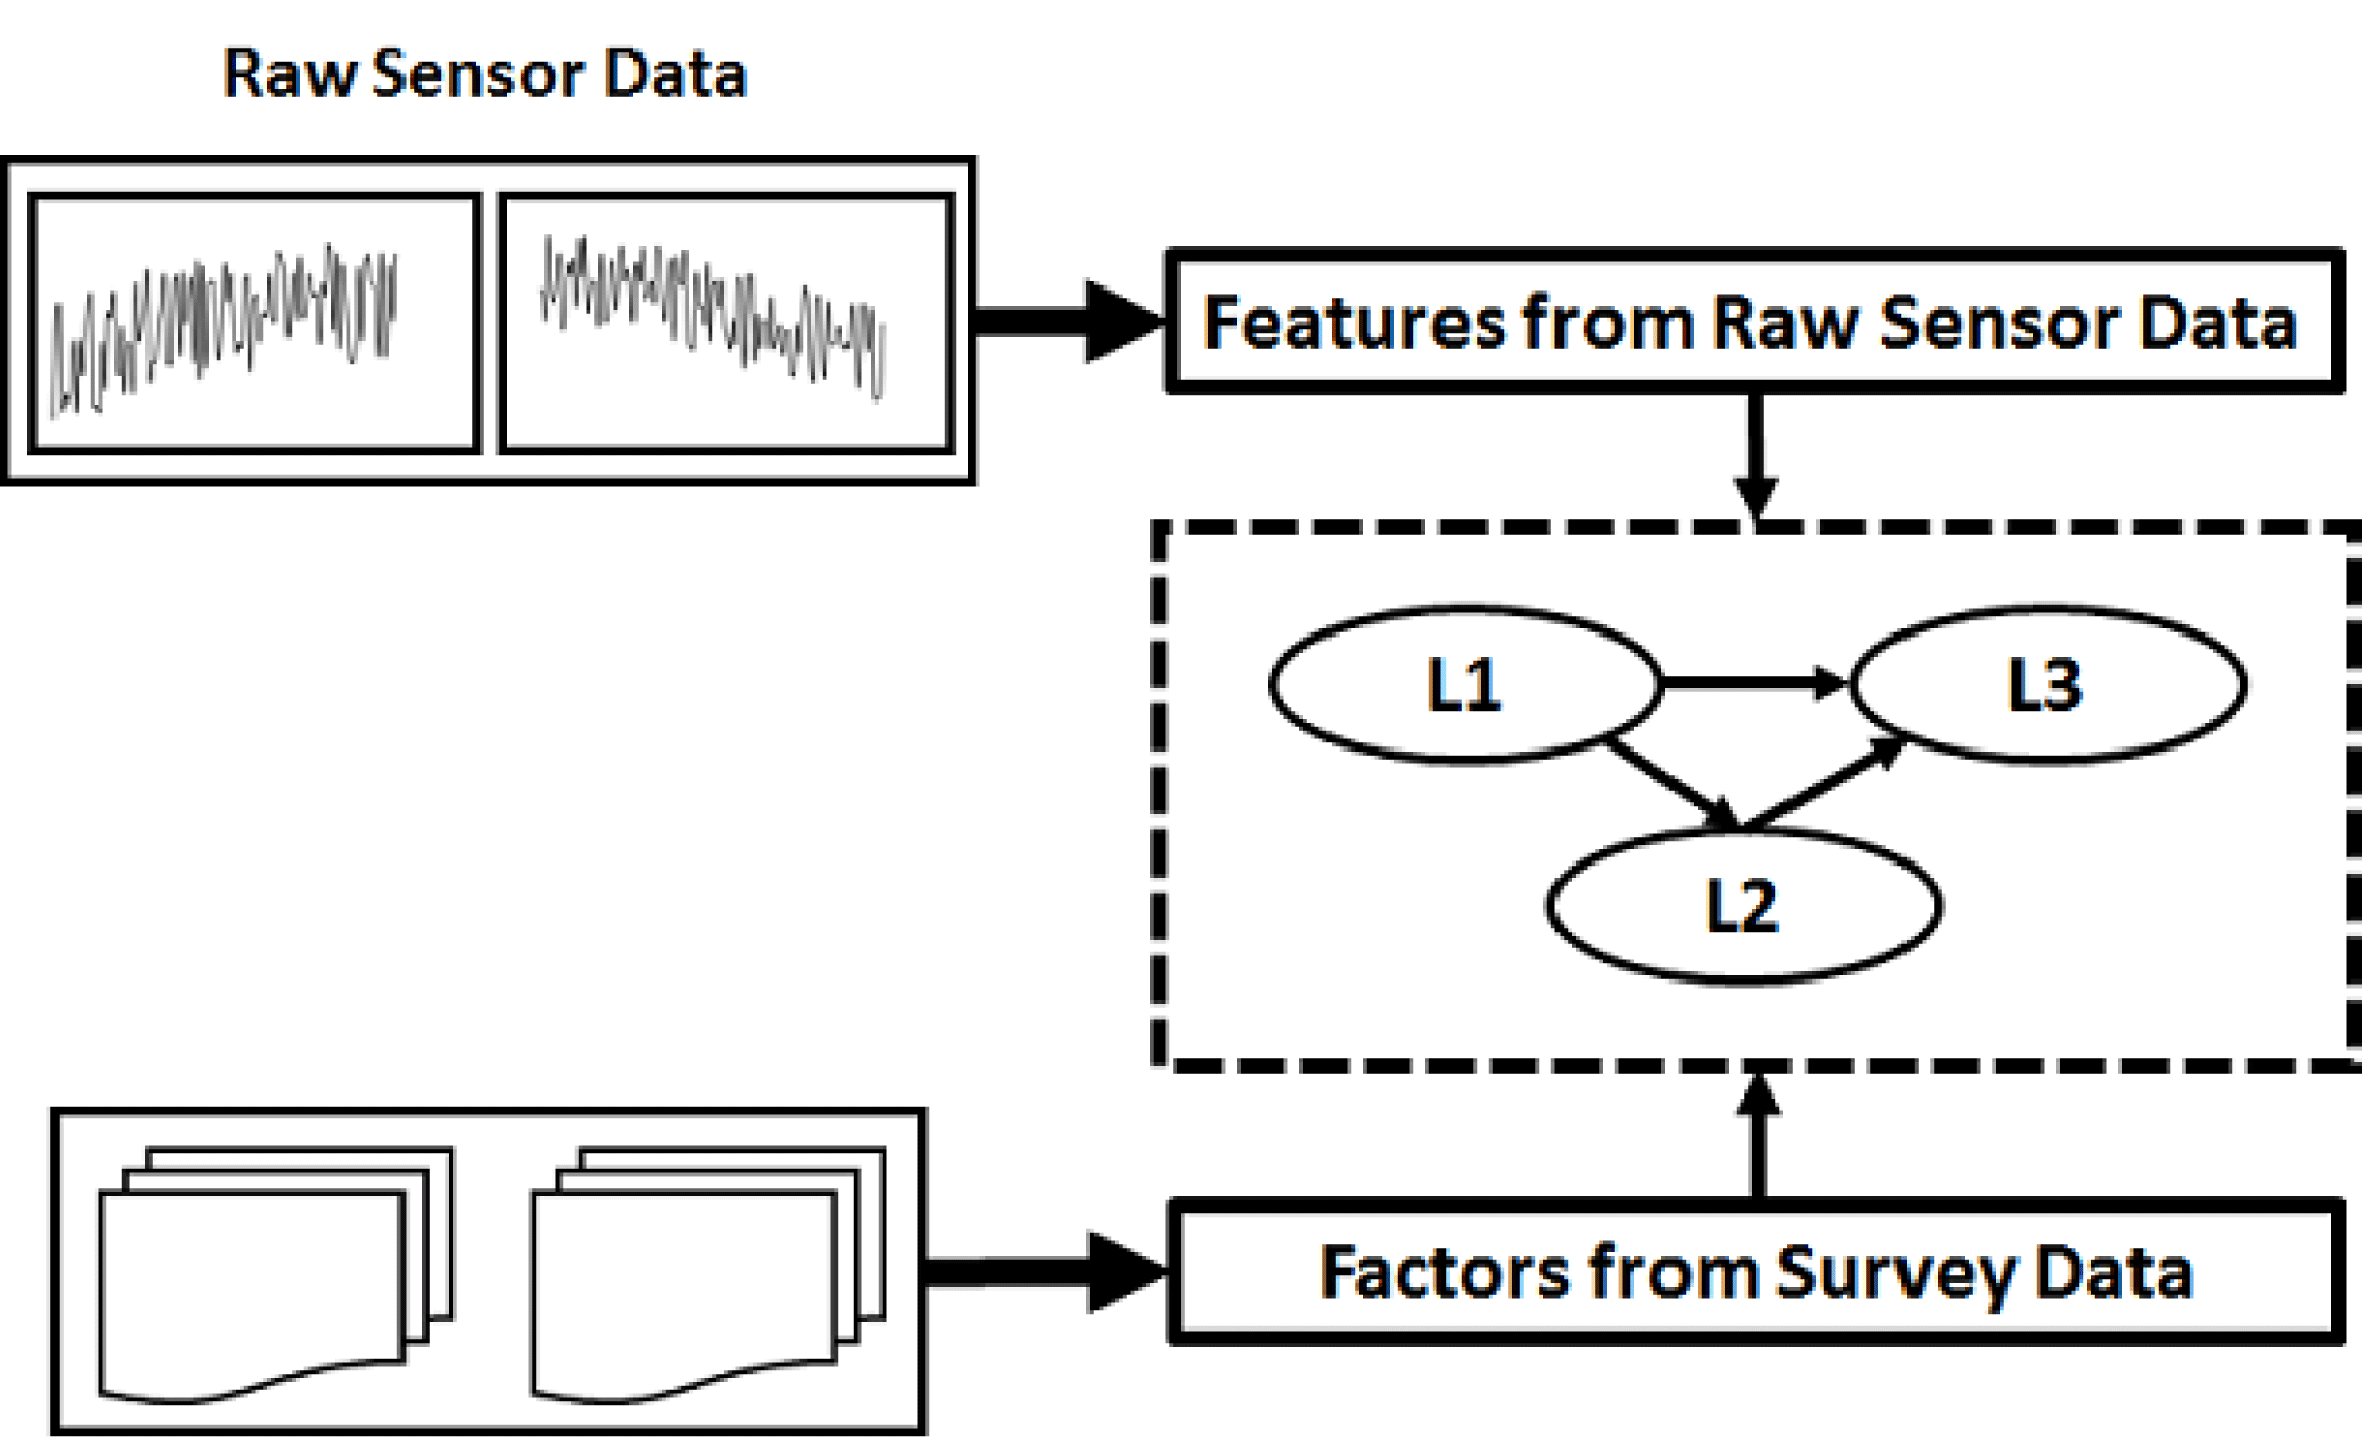
Figure 1. Cyber-Empathic Design Concept – features and factors from users are mapped to a model of latent constructs representing user perceptions illustrated by the L1-L3 network.
2.1 Unsupervised deep learning – Autoencoders
In general, an Autoencoder network consists of two parts – an encoder and decoder (Krizhevsky & Hinton Reference Krizhevsky and Hinton2011). The encoder network maps the input raw data to a low dimensional hidden space that forms the extracted features. During the model-training phase, the decoder network uses the features extracted to recreate the original input data. An optimization algorithm is used to minimize the error between original input data and the output of the decoder layer, i.e., the recreated input data. Once converged, only the encoder layer is used. The output of the encoder network (code layer) forms the features of the input data. Autoencoder networks have been effective in extracting features in the visual domain, natural language processing, and sentiment analysis. Based on prior successes, its intuitiveness, capability, and stability, this work explores the use of an Autoencoder in CED. Note that the automatic extraction of features is not restricted to deep learning methods, as other dimensional reduction techniques like Principal Component Analysis (PCA) are also applicable and should be explored and compared.
In this work, a type of Autoencoders called Denoising Autoencoders with a convolutional setting is used. In the Denoising Autoencoders, the input sensor signal is corrupted with random noise. The objective of the decoder network, in addition to sensor signal reconstruction, is also to de-noise the data. In this way, the Autoencoder learns robust sensor features. The rationale behind using Denoising Autoencoders is that due to their stochastic nature, they have the potential to generate more robust features as presented in (Vincent et al. Reference Vincent, Larochelle, Bengio and Manzagol2008).
2.2 Partial least square structural equation modeling
Traditionally SEM (i.e., CB-SEM) relies on the principles of maximum likelihood for parameter estimation. Thus, CB-SEM has the requirement of multi-variate normal data distributions and large sample sizes (Anderson & Gerbing Reference Anderson and Gerbing1988; Peng & Lai Reference Peng and Lai2012). On the other hand PLS-SEM is a soft-modeling approach for structural equations with relaxed assumptions regarding the nature of the input data (Hair et al. Reference Hair, Ringle and Sarstedt2011; Becker et al. Reference Becker, Klein and Wetzels2012; Ringle et al. Reference Ringle, Sarstedt and Straub2012; Wong Reference Wong2013). The steps involved in applying PLS-SEM for the parameter estimation shown in Figure 1 are (Tenenhaus et al. Reference Tenenhaus, Vinzi, Chatelin and Lauro2005):
Step 1: Initialize arbitrary weights of the outer (i.e., measurement) model to map distinct latent factors to their formative and/or reflective measures.
Step 2: Compute the outer approximation of the latent variables.
Step 3: Obtain weights of the inner (i.e., structural) model (relationship of latent variables with each other).
Step 4: Compute the inner approximations of the latent variables.
Step 5: Compute the new weights of the outer model.
Repeat Steps 2–5 until convergence.
Step 6: Estimate path coefficients (weights) of the inner structural model.
Step 7: Estimate loadings (weights) for the outer measurement model.
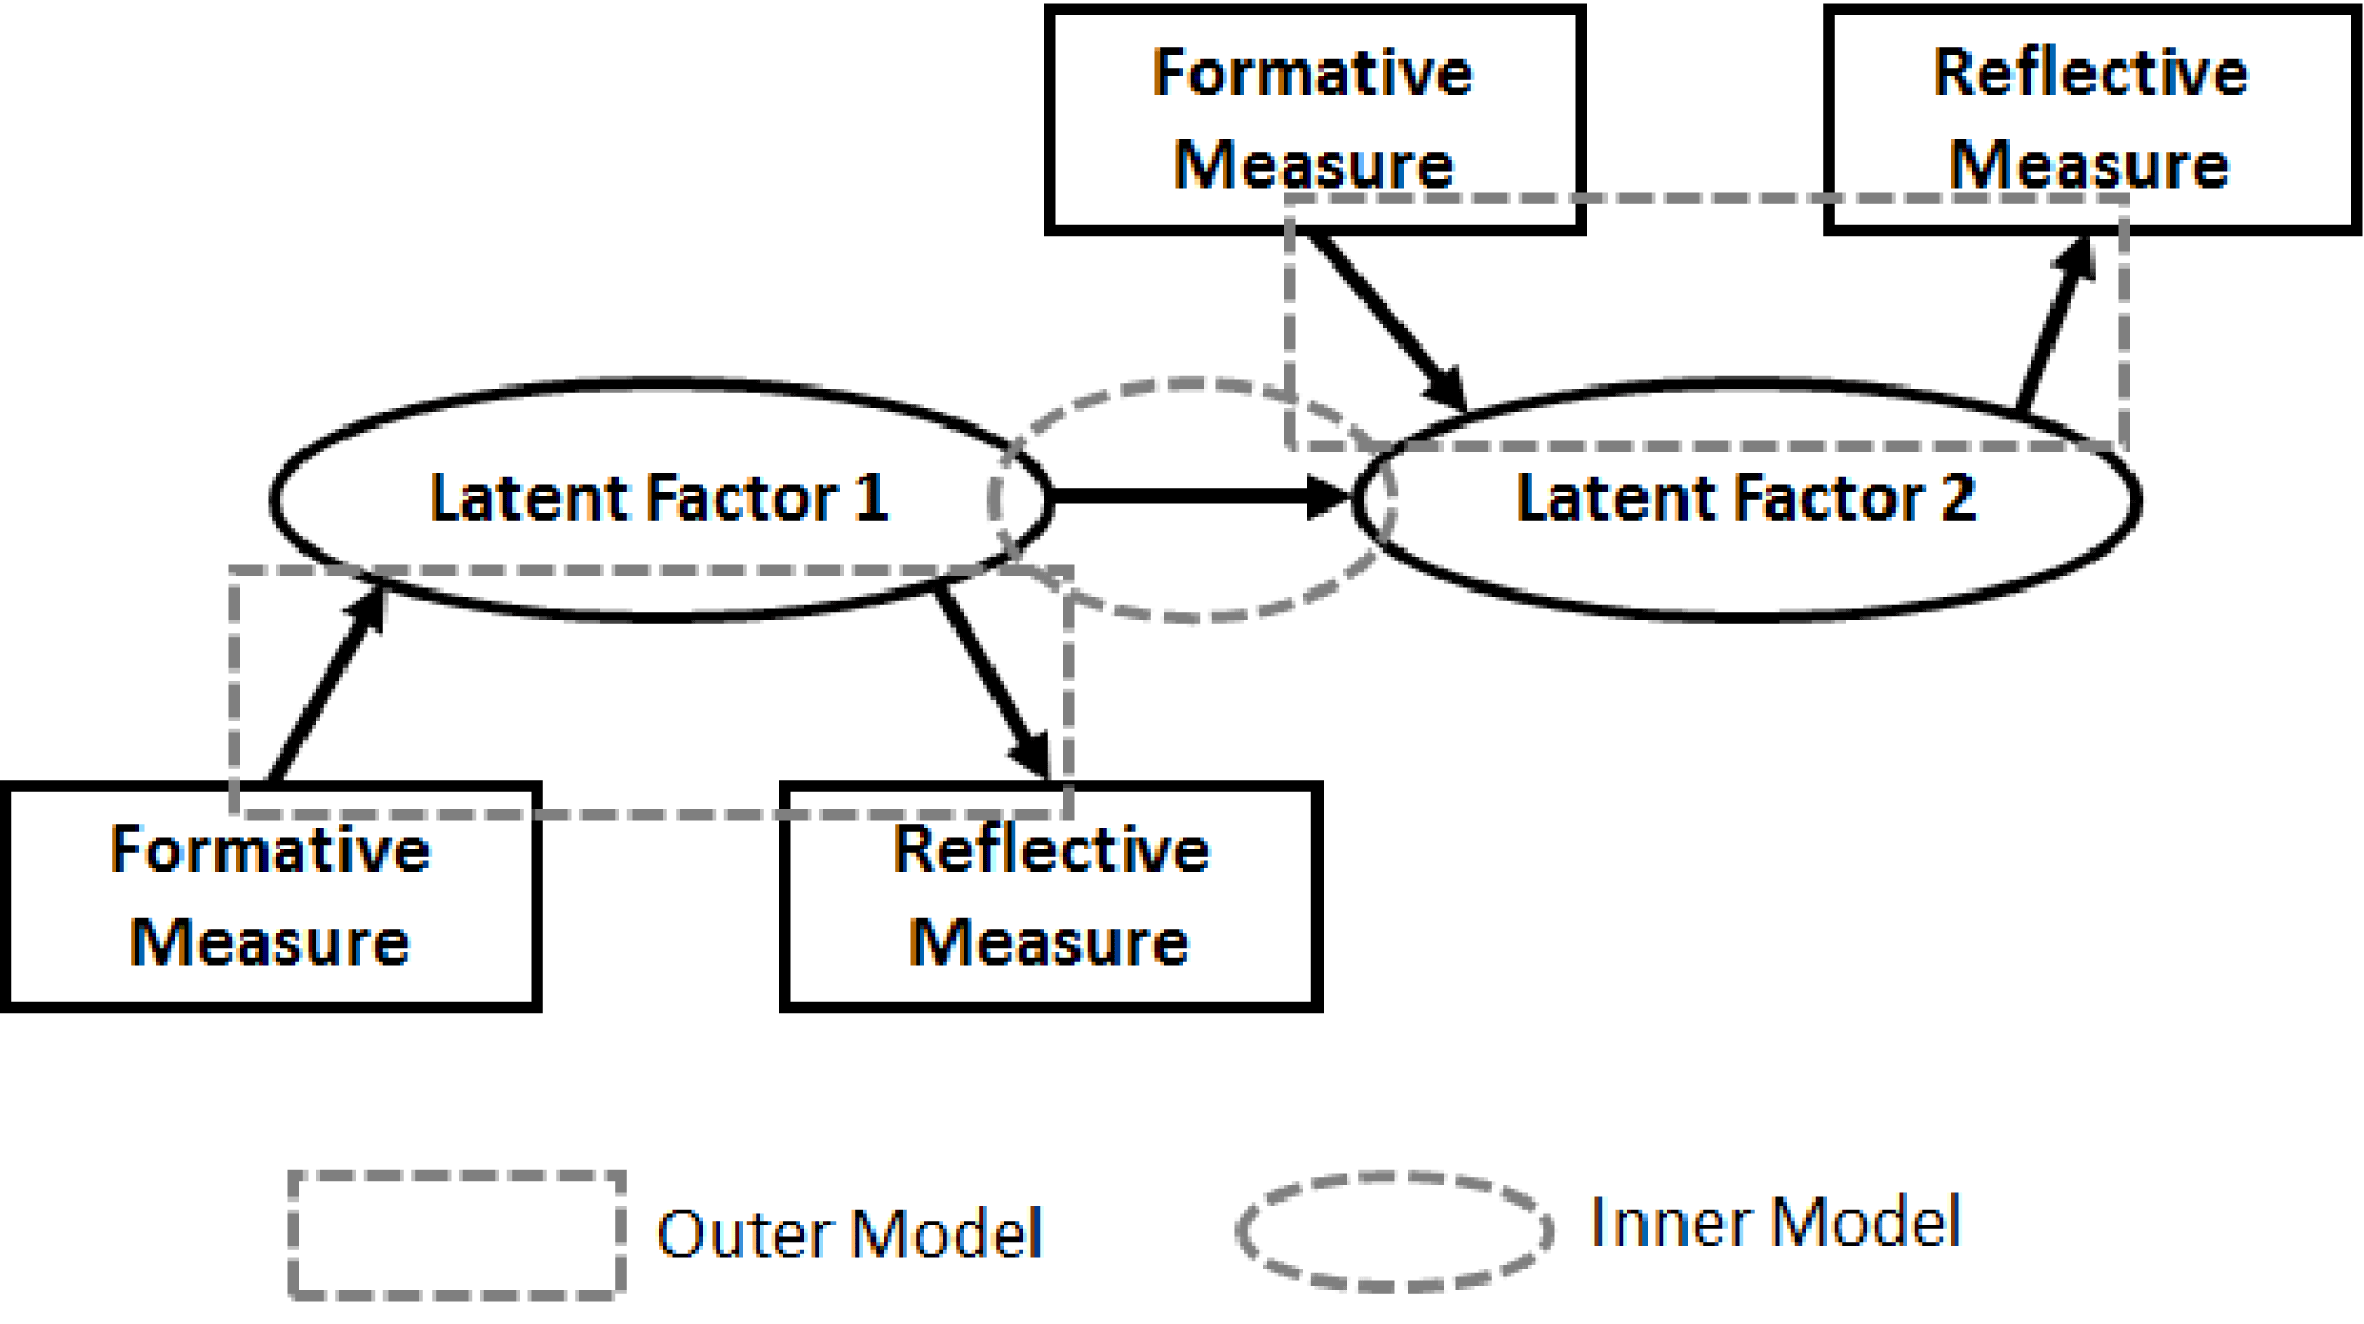
Figure 2. PLS-SEM Structure.
Based on these concepts, the next section presents the modified CED framework where Denoising Autoencoders and PLS-SEM are integrated.
3 Unsupervised deep learning based CED – architecture and approach
This section presents the modified, flexible and scalable CED framework to provide automated feature extraction from heterogeneous product use information through an unsupervised learning approach.
The existing CED framework procedure is shown in Figure 3, where raw sensor data and survey measures are collected as the first step. Subsequently, sensor data is analyzed and features are manually designed and extracted. The extracted sensor features act as formative measures for certain psychological constructs and the survey measures act as reflective measures for the psychological constructs. In a formative model, the causal action flows from the measurements (e.g., survey measures) to a psychological construct or a latent variable in general. The measurements are referred to as formative measures. On the other hand, in a reflective model the causal action flows from the psychological construct or a latent variable to a measurement variable, thereby the measures are called reflective measures (Tenenhaus et al. Reference Tenenhaus, Vinzi, Chatelin and Lauro2005).
The novel contribution of this work is presented in Figure 4, which includes integration of an unsupervised machine learning method. Raw sensors are processed using Denoising Autoencoders to extract salient sensor features automatically. The automatically extracted sensor features and survey measures act as an input to the PLS-SEM for parameter estimation. This automation is the key difference between the existing CED framework in Figure 3 and the approach presented here in Figure 4. It should be noted that unsupervised machine learning for CED is not restricted to Denoising Autoencoders and other methods are also applicable. Testing the applicability of other unsupervised machine learning methods is not in the scope of this work.
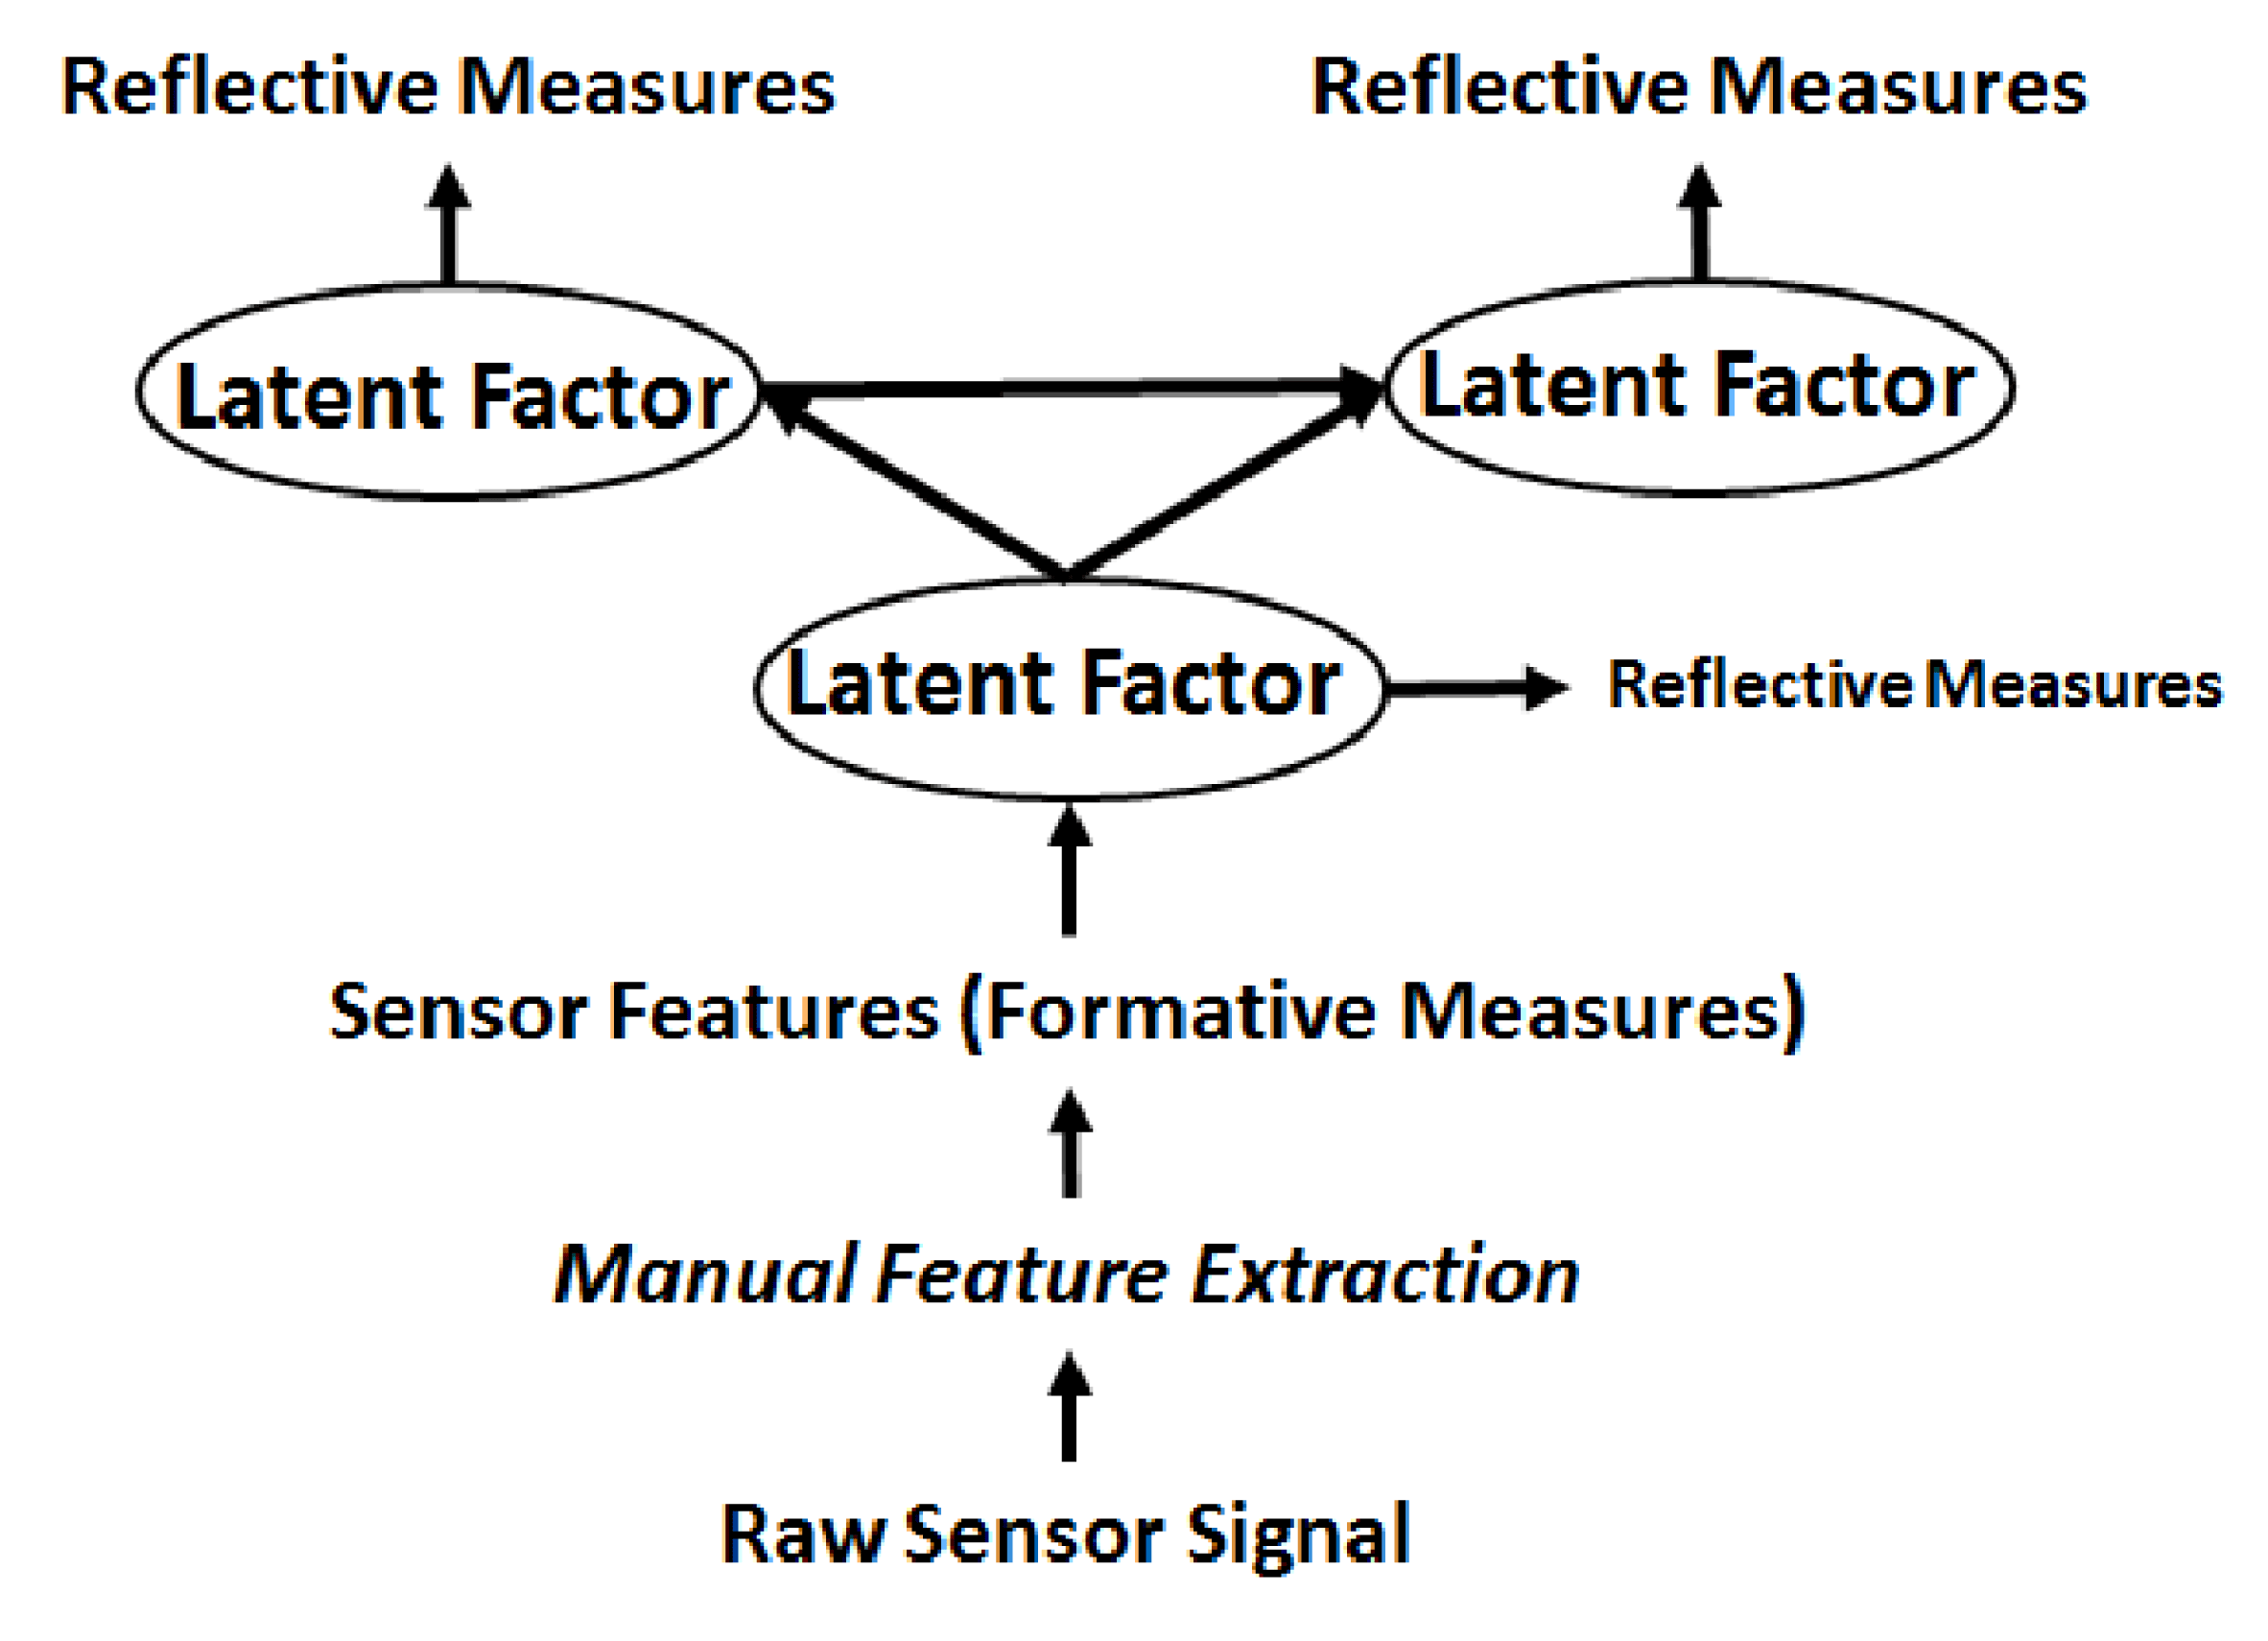
Figure 3. Existing CED Framework Modeling Procedure.
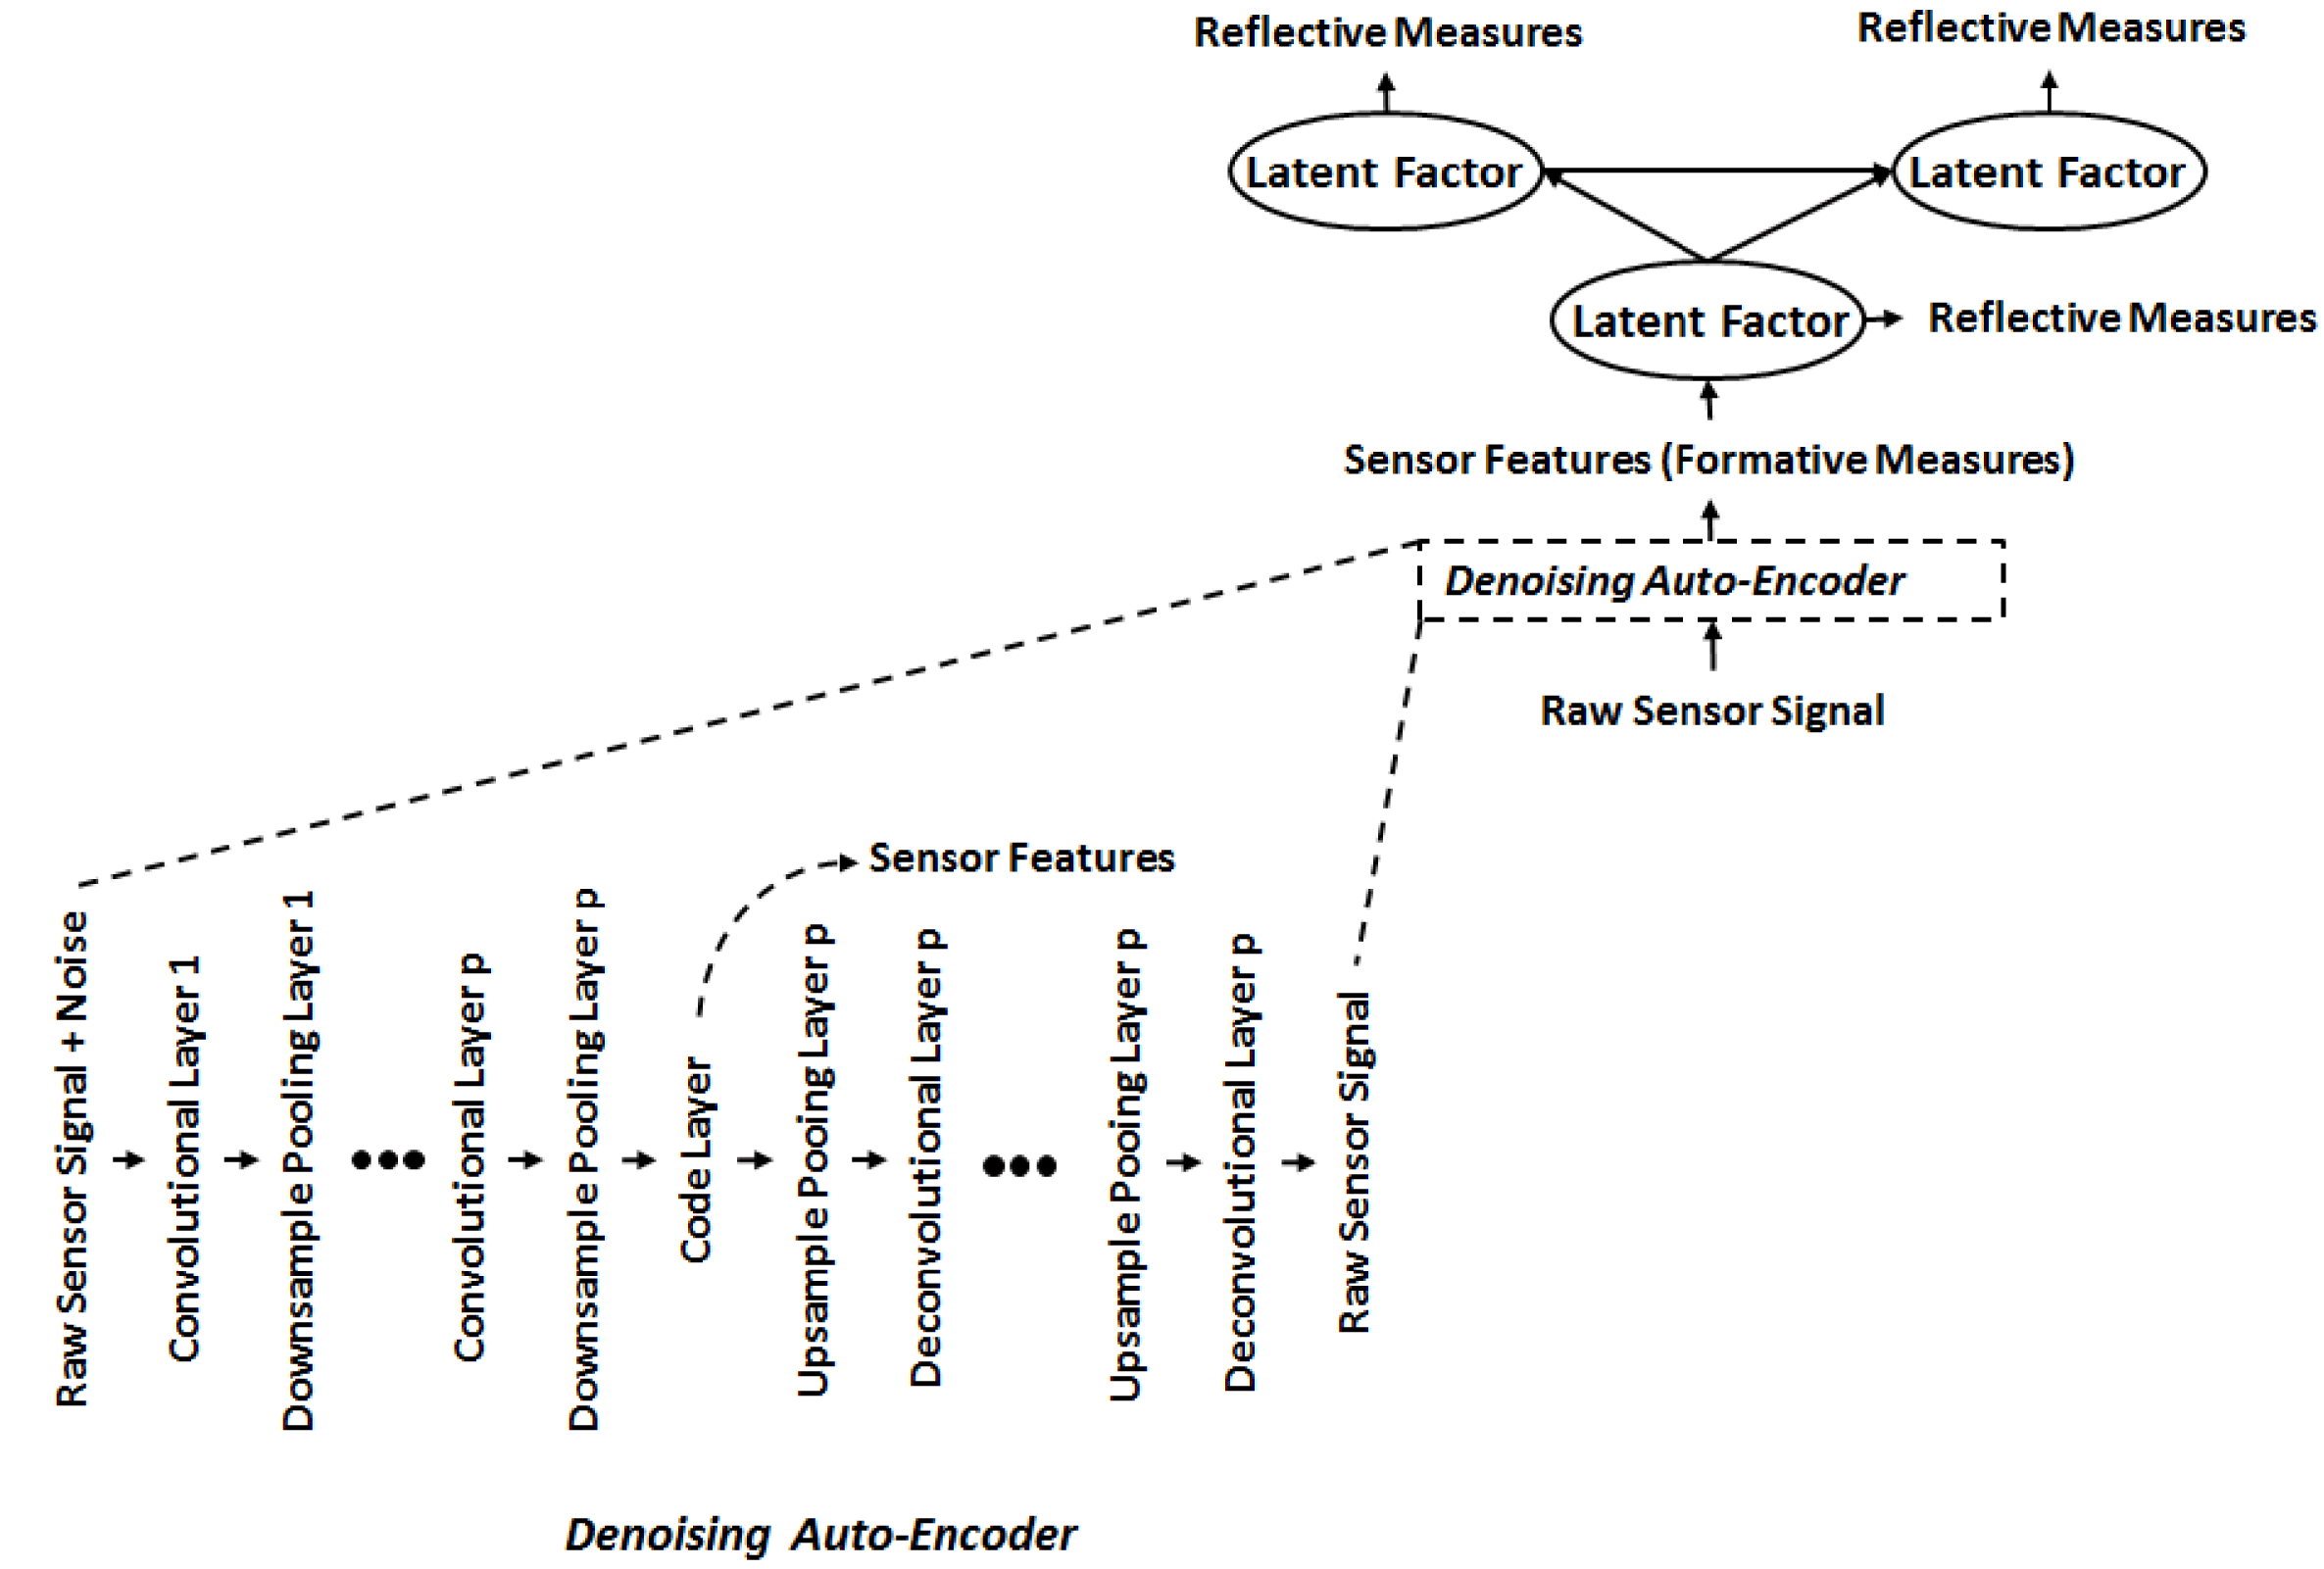
Figure 4. Proposed CED Framework Modeling Procedure.
The model obtained is evaluated based on various metrics and fit indices. The criteria used to evaluate the model follow from Peng & Lai (Reference Peng and Lai2012) and Sanchez & Trinchera (Reference Sanchez and Trinchera2012). For the measurement model (reflective indicators), unidimensionality is assessed using Cronbach’s alpha ( ${>}0.7$
), Dillon–Goldstein ratio (
${>}0.7$
), Dillon–Goldstein ratio ( ${>}0.7$
), 1st eigenvalue (
${>}0.7$
), 1st eigenvalue ( ${>}1$
), and 2nd eigenvalue (
${>}1$
), and 2nd eigenvalue ( ${<}1$
). In addition, the cross-loadings are also evaluated. For the structural model, acceptance is assessed using
${<}1$
). In addition, the cross-loadings are also evaluated. For the structural model, acceptance is assessed using $R^{2}$
(Low
$R^{2}$
(Low ${<}0.3$
, Moderate
${<}0.3$
, Moderate $0.3{-}0.7$
, High
$0.3{-}0.7$
, High ${>}0.7$
), Communality (
${>}0.7$
), Communality ( ${>}0.5$
) and pseudo Goodness of Fit (GoF) where
${>}0.5$
) and pseudo Goodness of Fit (GoF) where ${>}0.7$
is considered a very good model.
${>}0.7$
is considered a very good model.
For the formative measures, the above metrics do not apply since in essence, those measures are the independent variables (Tenenhaus et al. Reference Tenenhaus, Vinzi, Chatelin and Lauro2005). However, a multi-collinearity check is conducted prior to the consideration of the formative measures as model inputs and the measures with high multi-collinearity are eliminated. The model obtained by the PLS-SEM is optimized and validated based on the above metrics.
To demonstrate that the Autoencoder-based CED model is better than the survey-based model and CED model with manually designed and extracted sensor features, the assessment is conducted based on GoF (which is an overall model fit indicator). As the initial step for assessment, first an optimized and converged model is obtained for all three cases (with GoF close to 0.7). The premise of this work is that the GoF of the Autoencoder-based CED model will be better than the GoF of the previous CED model. To confirm the results of (Ghosh et al. Reference Ghosh, Olewnik, Kim, Lewis and Lakshmanan2017a ), model comparison is conducted for the previous CE- and survey-based models as well. Therefore, the hypothesis of this work is that the relationship among the GoF values for the three models is:
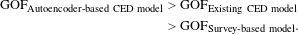 $$\begin{eqnarray}\displaystyle \text{GOF}_{\text{Autoencoder\text{-}based CED model}} & {>} & \displaystyle \text{GOF}_{\text{Existing CED model}}\nonumber\\ \displaystyle & {>} & \displaystyle \text{GOF}_{\text{Survey\text{-}based model}}.\end{eqnarray}$$
To test this hypothesis and demonstrate the Autoencoder-based CED model a case study of a sensor-integrated shoe is used and presented in the next section.
4 Case study
To test the proposed framework, this work leverages the case study presented in Ghosh et al. (Reference Ghosh, Olewnik, Kim, Lewis and Lakshmanan2017a ). The experimental protocol, psychological constructs, their assumed structural relationship and sensor data pre-processing remain the same as reported previously. Data is collected from 151 participants who were asked to perform activities like walking, walking upstairs, etc. on a designated path wearing a sensor-integrated shoe. The shoe inserts were retrofitted with eight force sensitive resistors (FSRs), one accelerometer, one flex sensor and one temperature sensor. Survey data and the sensor data collected during the experiment represent the measurements for the psychological constructs. Data from 142 of the 151 participants was suitable for analysis. For nine participants, incomplete information was recovered from the surveys or the hardware malfunctioned.
For PLS-SEM, the sample size should be at least 10 times the number of reflective variables corresponding to the latent construct with the maximum number of reflective variables (Hair Jr et al. Reference Hair, Hult, Ringle and Sarstedt2016). For this case, the latent construct Perceived Comfort (Reflective) has the maximum number of reflective variables – five. Hence, the minimum sample size required for this work is 50. Of the sensor measurements, only FSR data is used for analysis because of malfunctioning or poor data quality from other sensors. For example, during the experimentation for many participants, the sensor leads of the flex sensor were damaged. While the analysis here is still instructive, CED is generally envisioned as an approach that would use multiple types of sensors.
4.1 Denoising Autoencoder architecture development
The input signal for the Denoising Autoencoder is corrupted with random noise sampled from a normal distribution – $N(0,1)$
. The Autoencoder is trained to reconstruct the original clean input signal, thereby extracting salient features. The training procedure used to develop the Denoising Autoencoder is shown in Figure 5. The Autoencoder network model is finalized after performing a
$N(0,1)$
. The Autoencoder is trained to reconstruct the original clean input signal, thereby extracting salient features. The training procedure used to develop the Denoising Autoencoder is shown in Figure 5. The Autoencoder network model is finalized after performing a $k$
-fold cross-validation procedure with
$k$
-fold cross-validation procedure with $k=3$
, where different network topologies are studied and the best performing model is selected. The model with the least reconstruction error is selected to obtain sensor features. In order to minimize the reconstruction error, ADAGRAD is used as the optimization algorithm (Dean et al.
Reference Dean, Corrado, Monga, Chen, Devin, Mao, Senior, Tucker, Yang and Le2012; Hadgu, Nigam & Diaz-Aviles Reference Hadgu, Nigam and Diaz-Aviles2015). The architecture finalized using the cross-validation procedure is presented in Table 1.
$k=3$
, where different network topologies are studied and the best performing model is selected. The model with the least reconstruction error is selected to obtain sensor features. In order to minimize the reconstruction error, ADAGRAD is used as the optimization algorithm (Dean et al.
Reference Dean, Corrado, Monga, Chen, Devin, Mao, Senior, Tucker, Yang and Le2012; Hadgu, Nigam & Diaz-Aviles Reference Hadgu, Nigam and Diaz-Aviles2015). The architecture finalized using the cross-validation procedure is presented in Table 1.
Table 1. Autoencoder Network Architecture
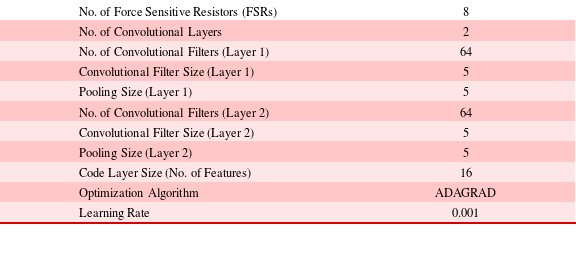
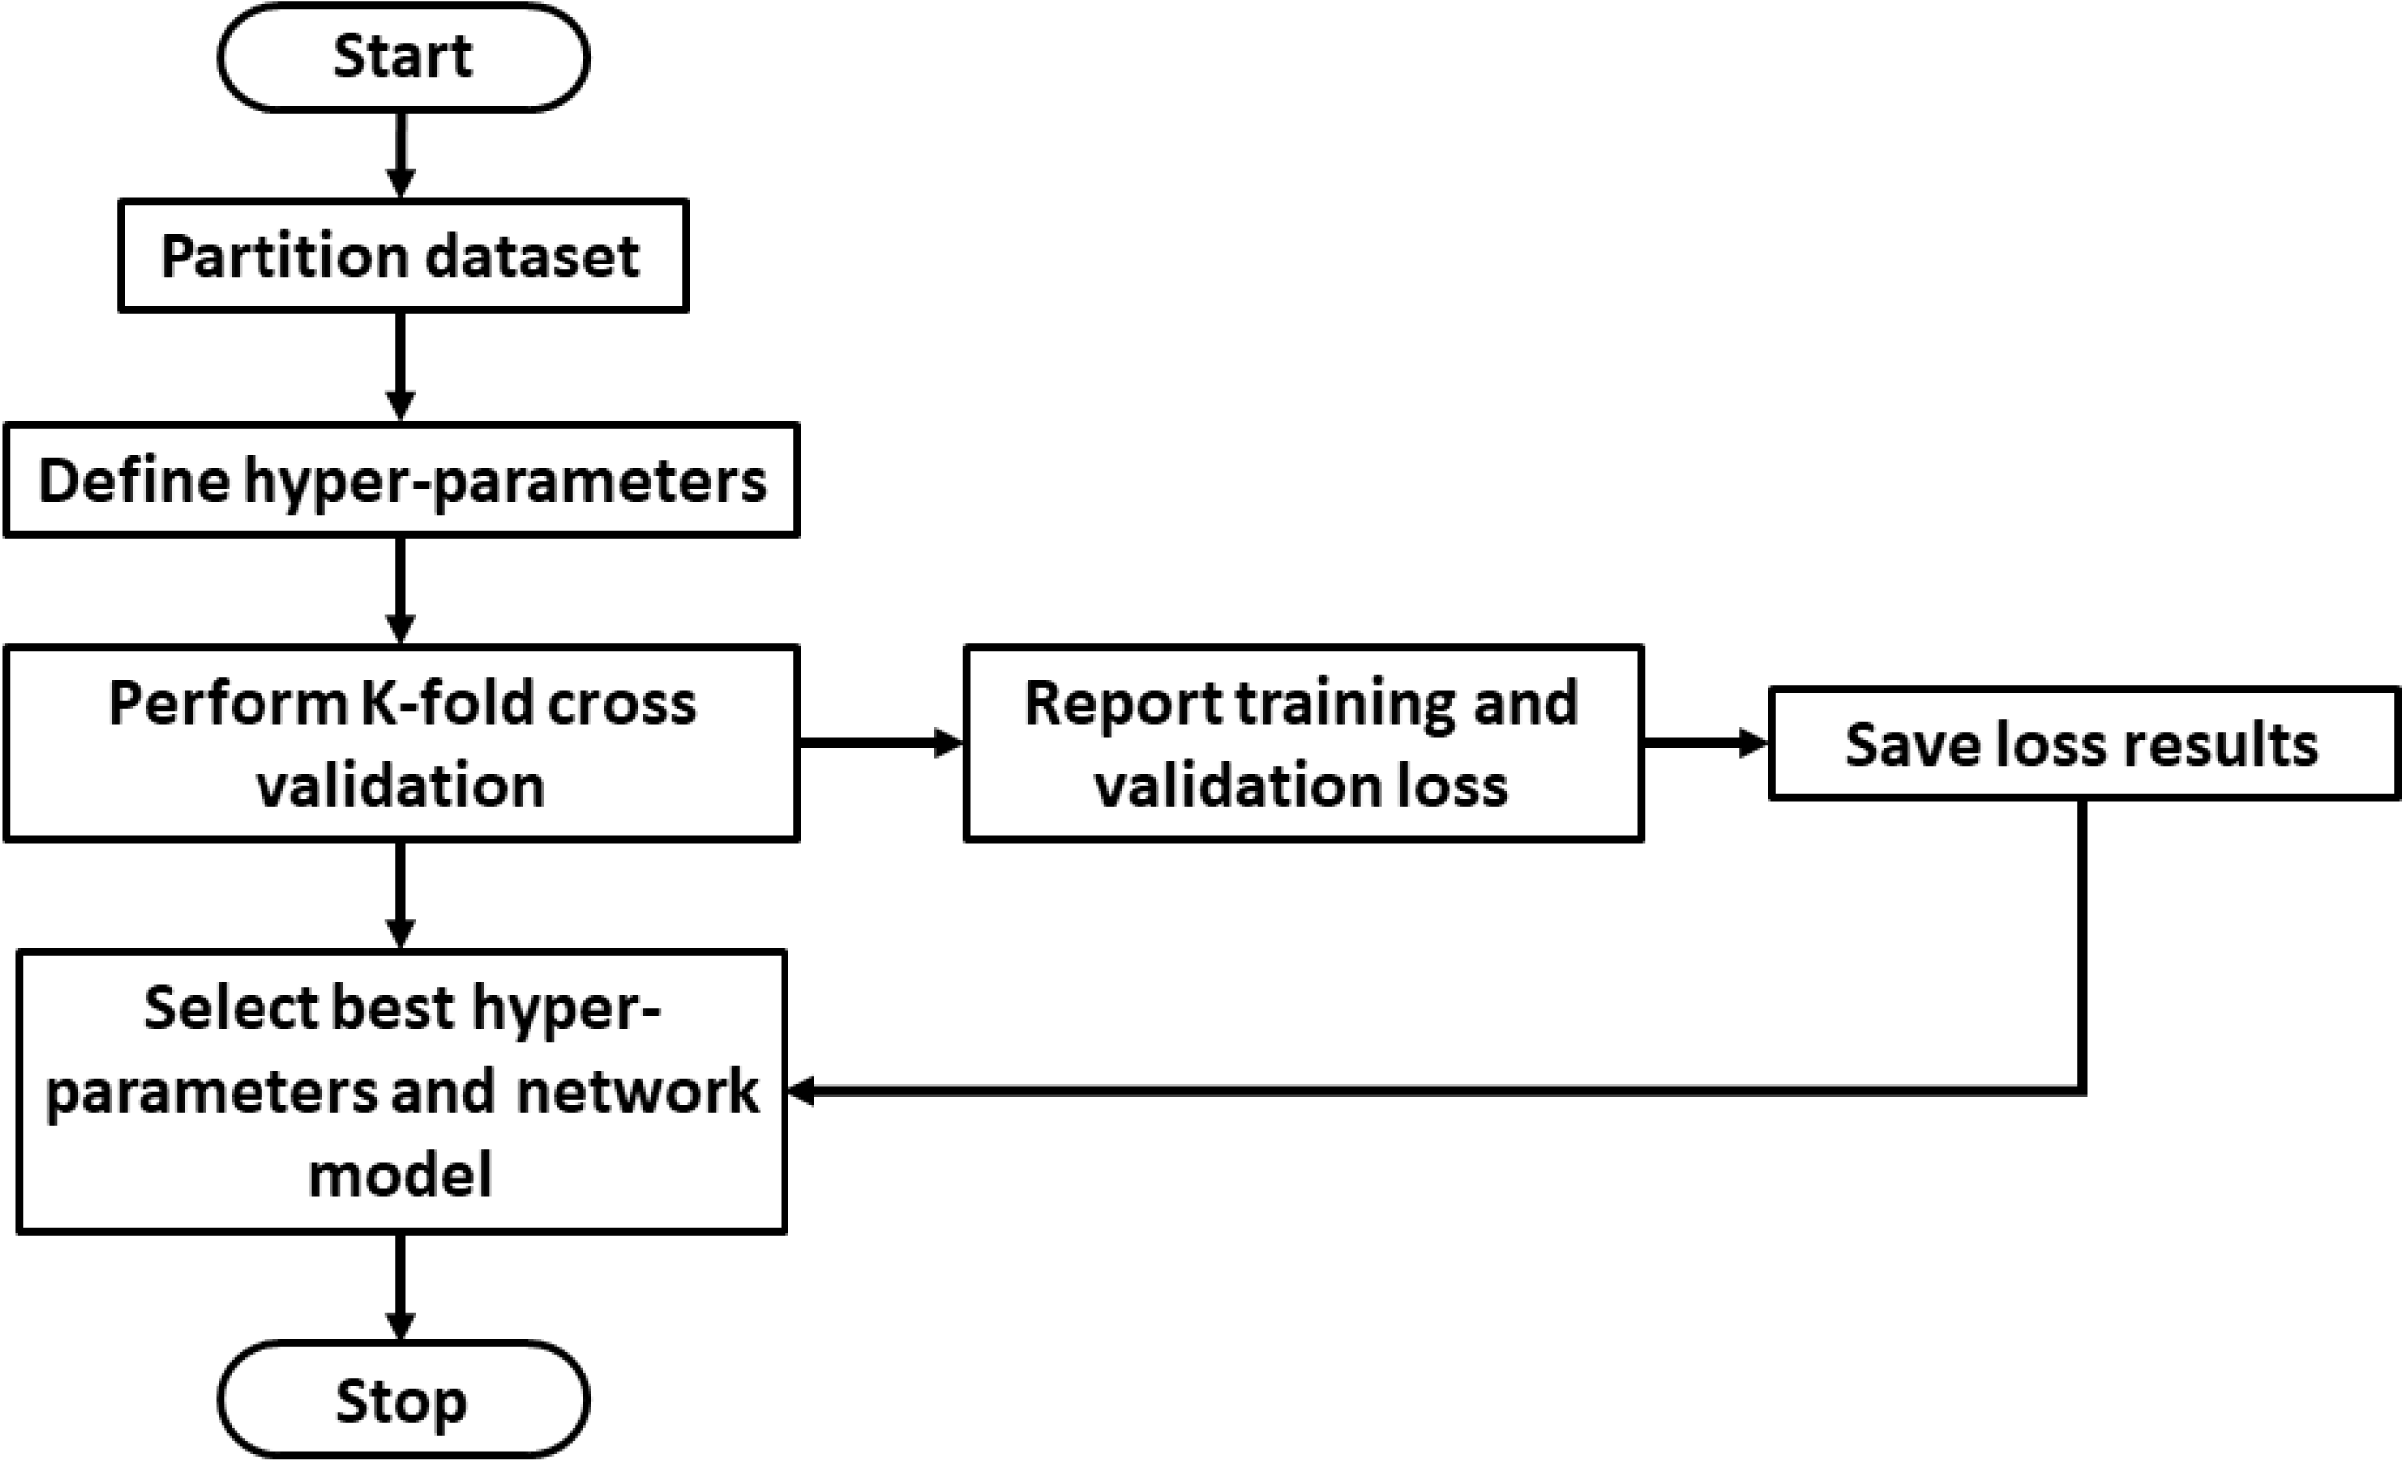
Figure 5. Deep Learning Model Training Procedure.
4.2 CED analysis procedure
The analysis procedure to estimate the parameters of the CED framework is shown in Figure 6. The manually designed and extracted features from (Ghosh et al. Reference Ghosh, Olewnik, Kim, Lewis and Lakshmanan2017a ) are reused in this work. As a novel contribution, this work replaces the manual feature extraction by Autoencoder extracted features as shown in Figure 6.
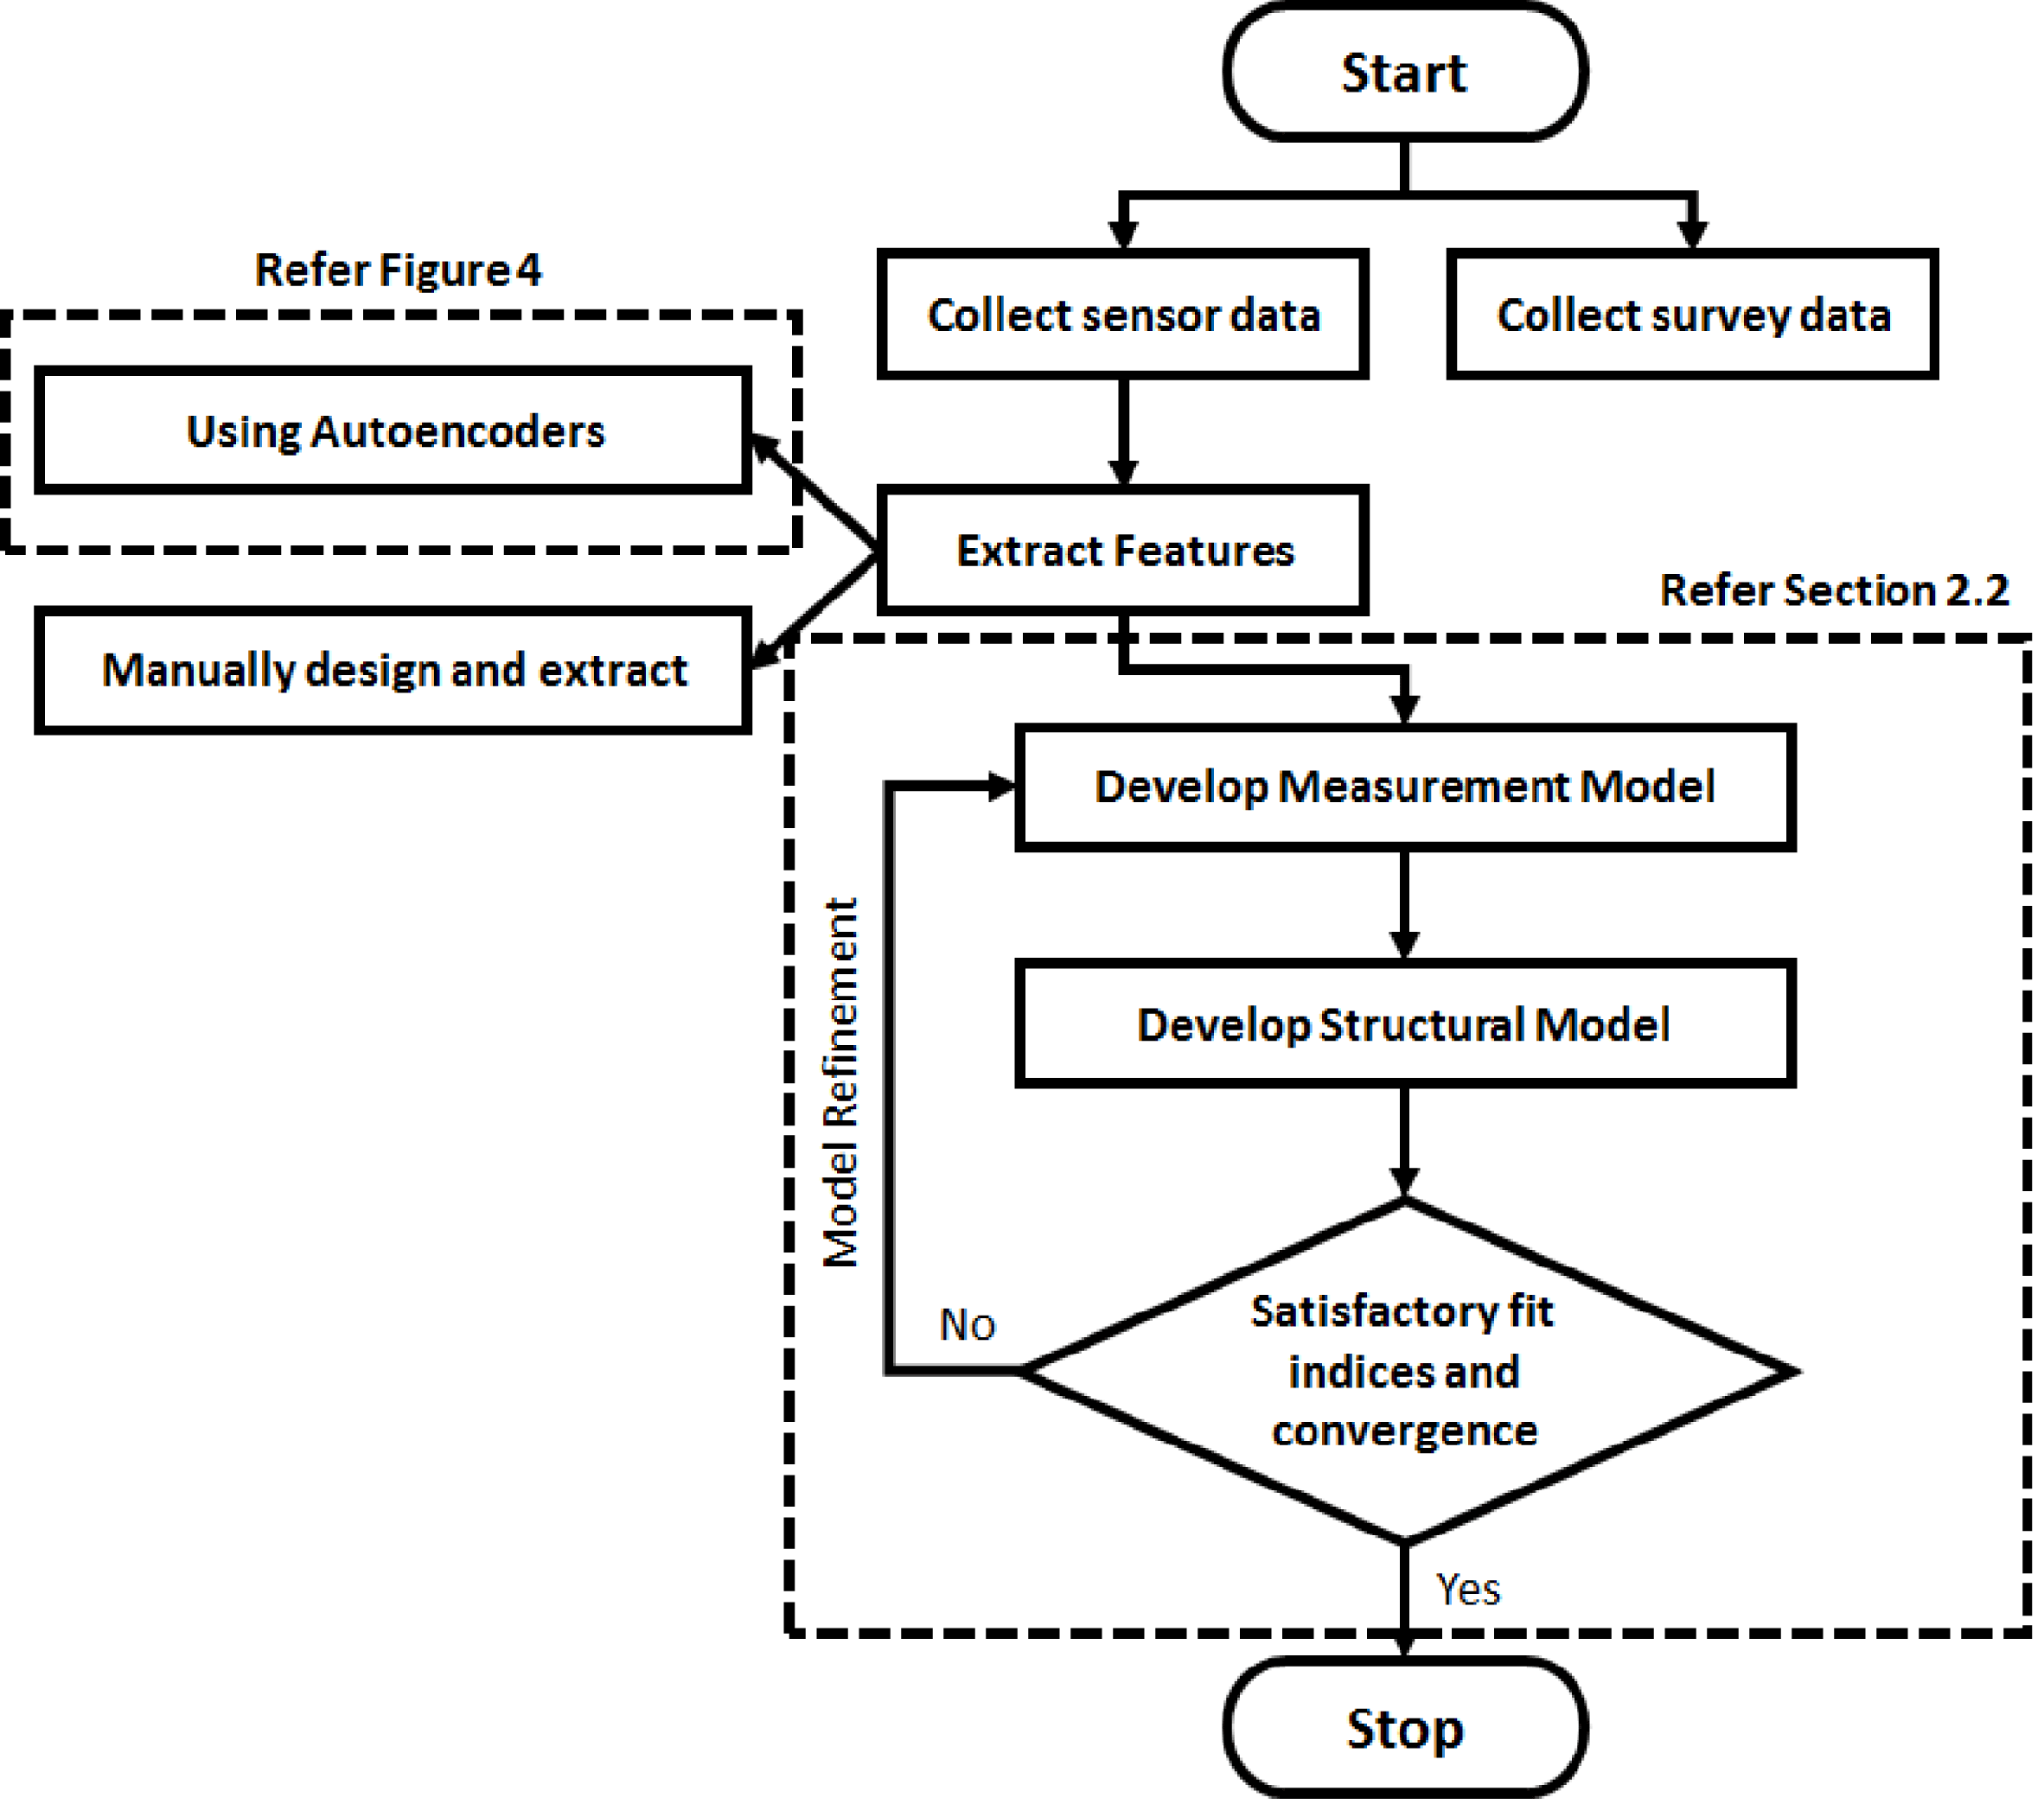
Figure 6. CED Analysis Procedure.
For some sensors, certain features obtained using Autoencoders were equal to zero for all samples. Such feature sets were eliminated. The distribution plots (histograms) for manually extracted features and Autoencoder extracted features are shown in Figures 7 and 8, respectively. The $x$
-axis represents the normalized measure (mean FSR and Autoencoder extracted value) while the
$x$
-axis represents the normalized measure (mean FSR and Autoencoder extracted value) while the $y$
-axis represents the frequency of appearance. The number of occurrences of a feature value is larger in the case of Autoencoders (Figure 8) because of the 1-minute sampling that was used for all participants. In the case of manually designed features (Figure 7), there is only one data point representing a feature for each participant. We can observe that the features extracted are not normally distributed, thus justifying the use of PLS-SEM. This approach is preferred to using transformations to convert the extracted features into a normal distribution in order to use CB-SEM because such transformations have the potential to lose key information during the transformations. Using the sensor features and survey measures, the case study results and related discussion are presented in the next section.
$y$
-axis represents the frequency of appearance. The number of occurrences of a feature value is larger in the case of Autoencoders (Figure 8) because of the 1-minute sampling that was used for all participants. In the case of manually designed features (Figure 7), there is only one data point representing a feature for each participant. We can observe that the features extracted are not normally distributed, thus justifying the use of PLS-SEM. This approach is preferred to using transformations to convert the extracted features into a normal distribution in order to use CB-SEM because such transformations have the potential to lose key information during the transformations. Using the sensor features and survey measures, the case study results and related discussion are presented in the next section.
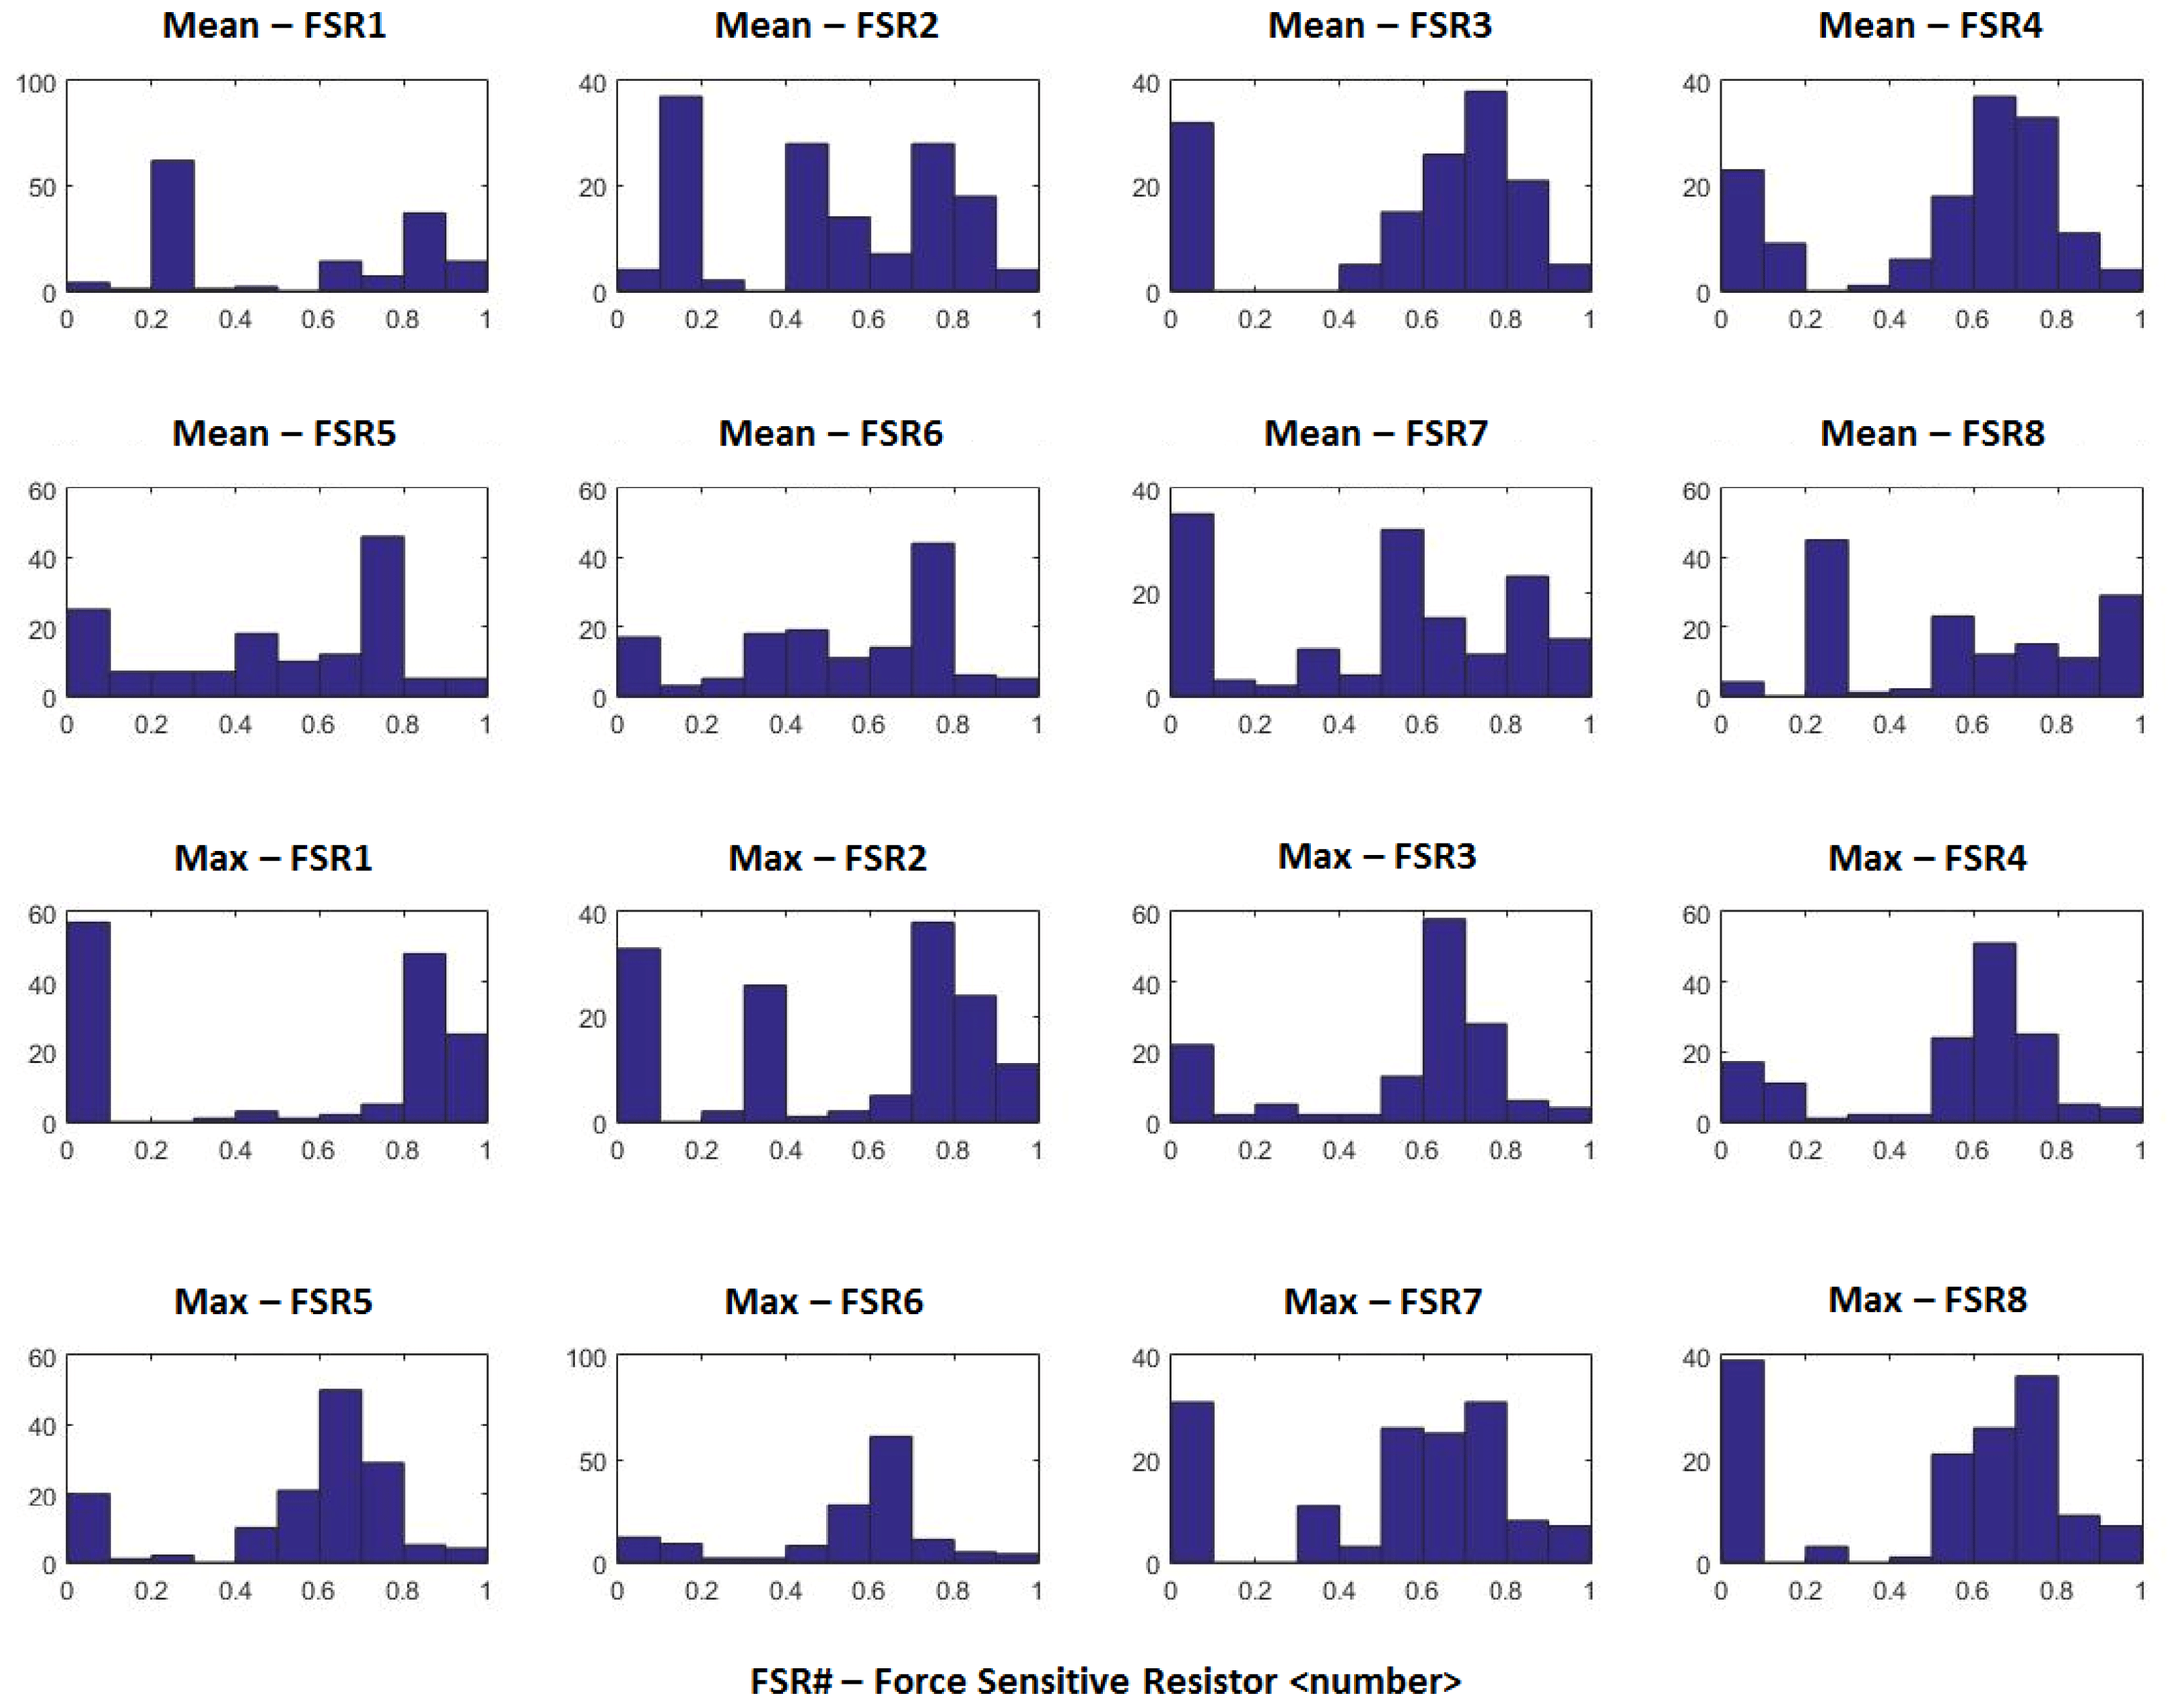
Figure 7. Distribution Plot (Manually Extracted Features).
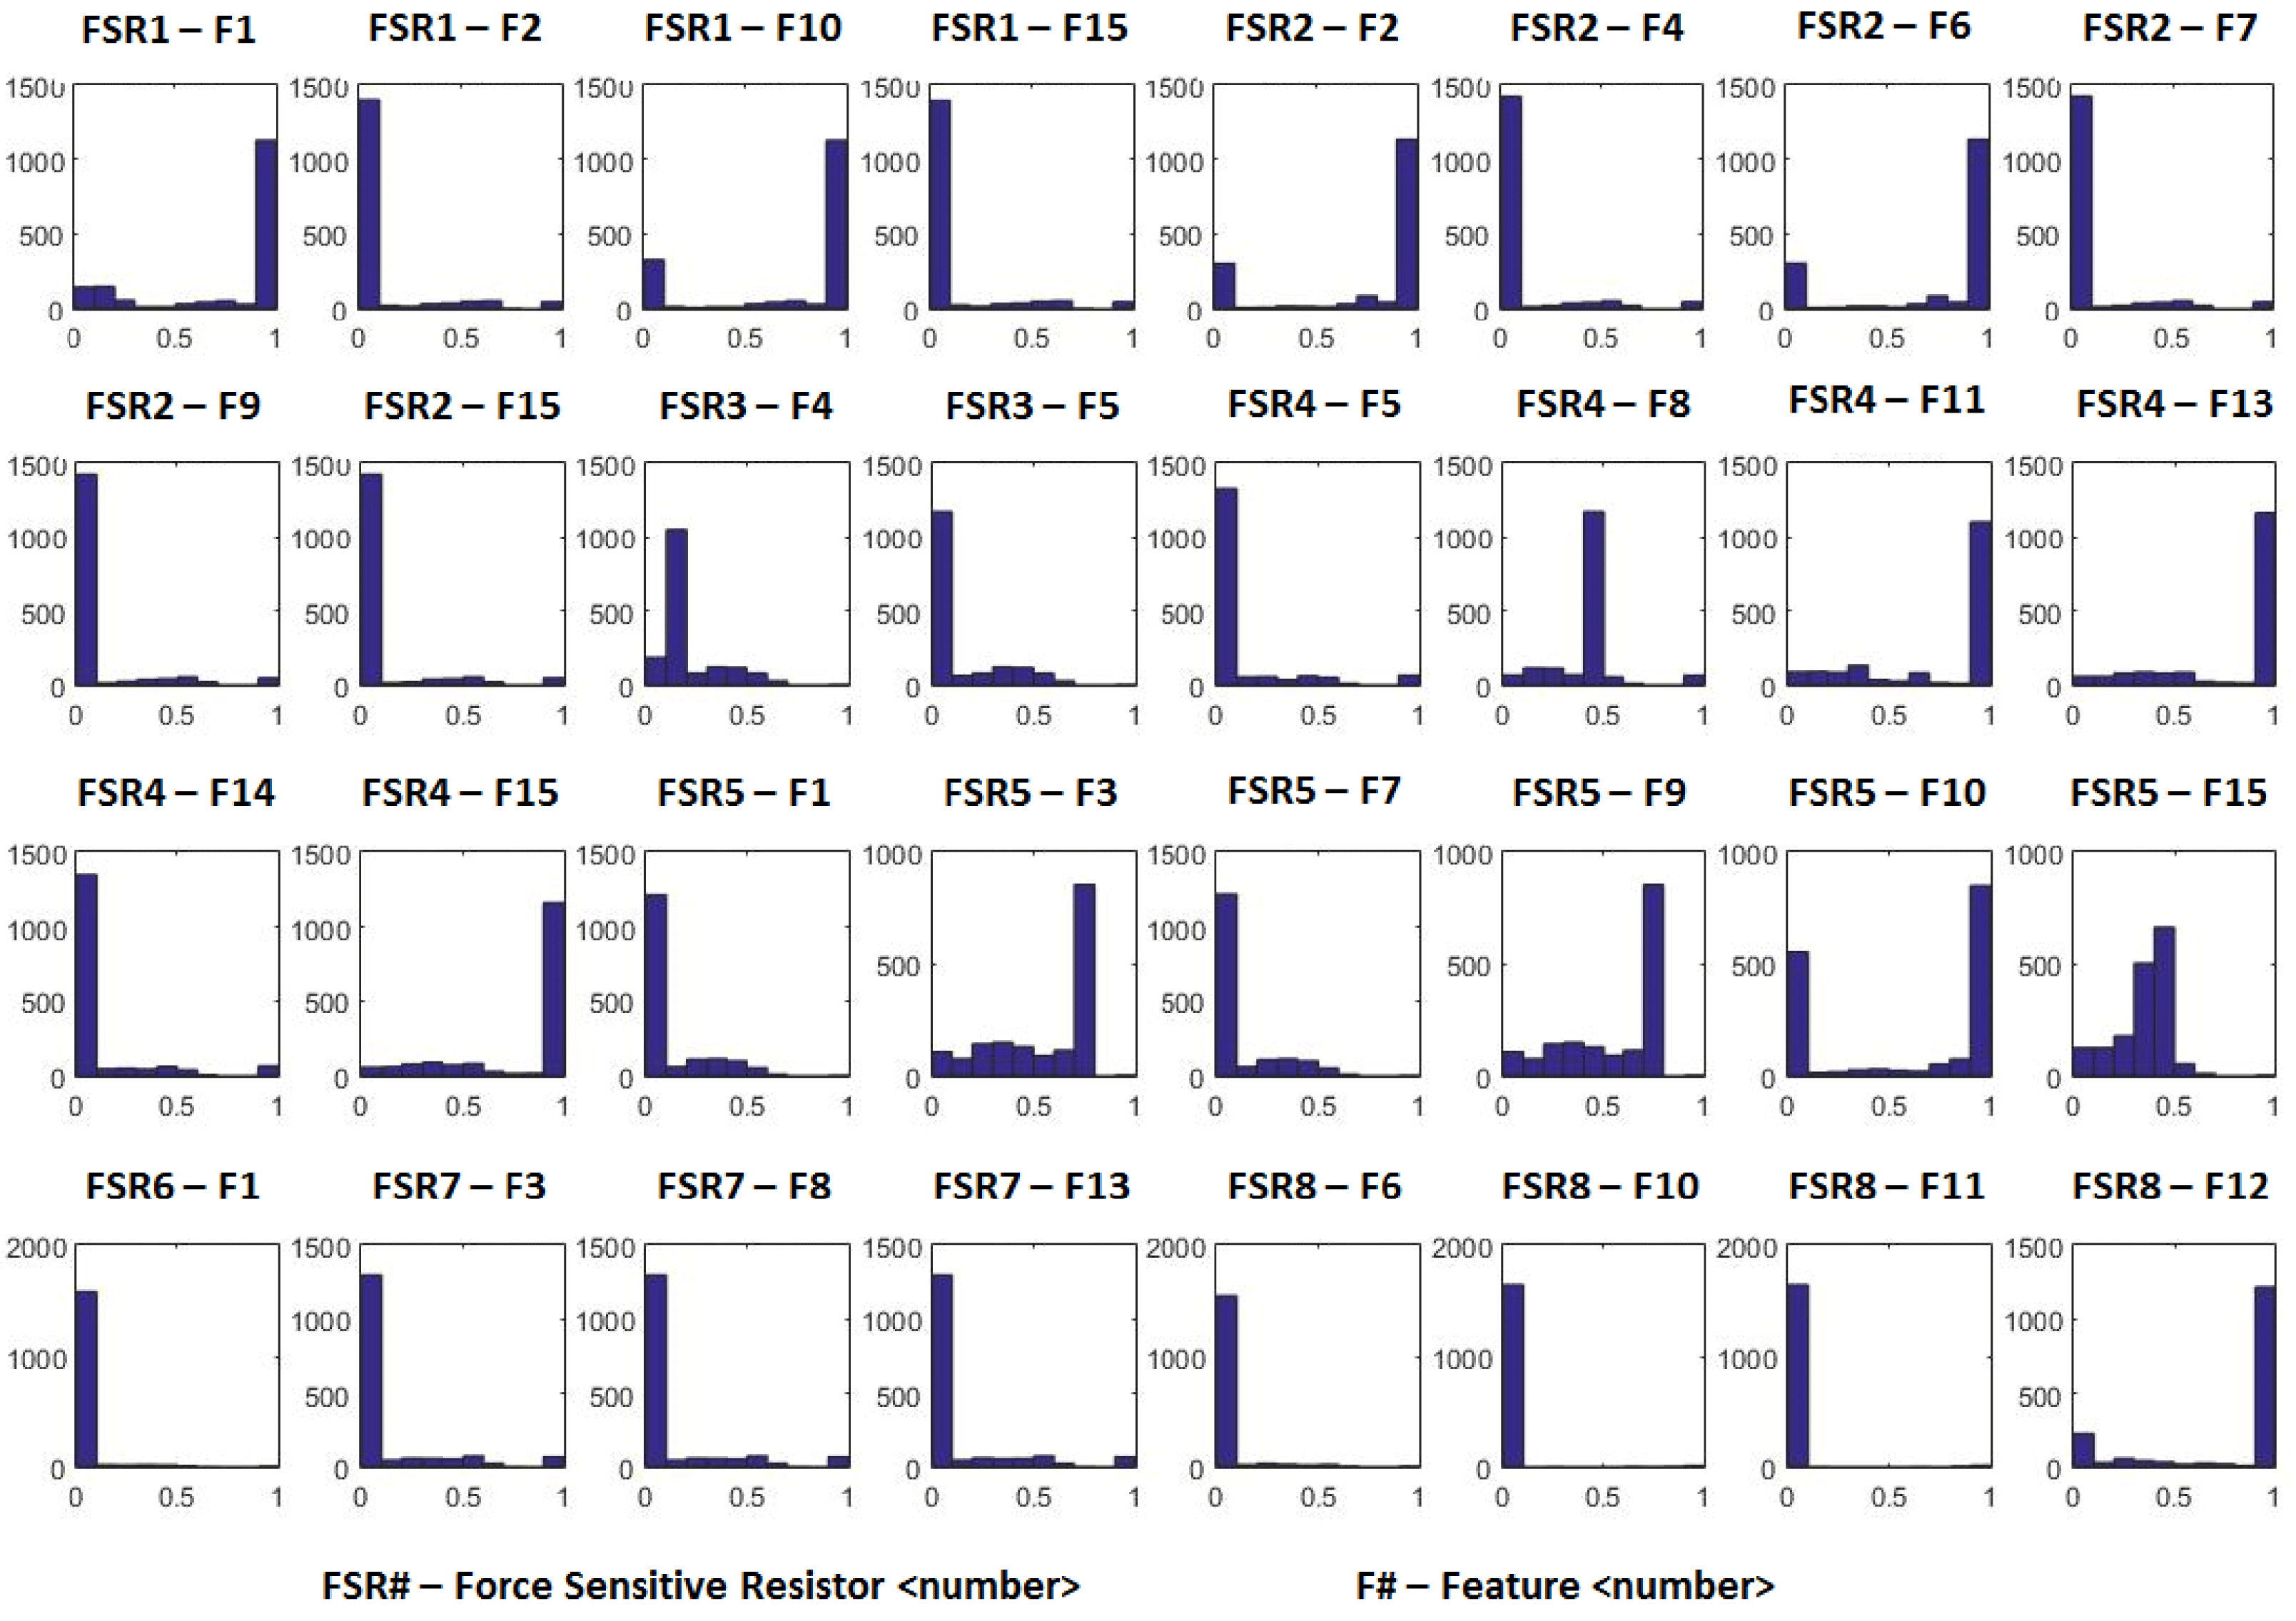
Figure 8. Distribution Plot (Autoencoder Extracted Features).
4.3 Results
For all three models, there are both formative and reflective measures. A multi-collinearity test is conducted for the formative measures as an initial step and measures with high multi-collinearity are eliminated. Then the formative and reflective measures are used as input to the PLS-SEM framework, where the psychological construct model shown in Figure 9 is exercised. For PLS-SEM, the PLSPM package in R is used (Sanchez & Trinchera Reference Sanchez and Trinchera2012). The model refinement is conducted based on the metrics presented in Section 3 and finally the GoF metric is used to test whether the Autoencoder-based CED model performs better than the manually designed and extracted feature based CED model and the survey-based model.
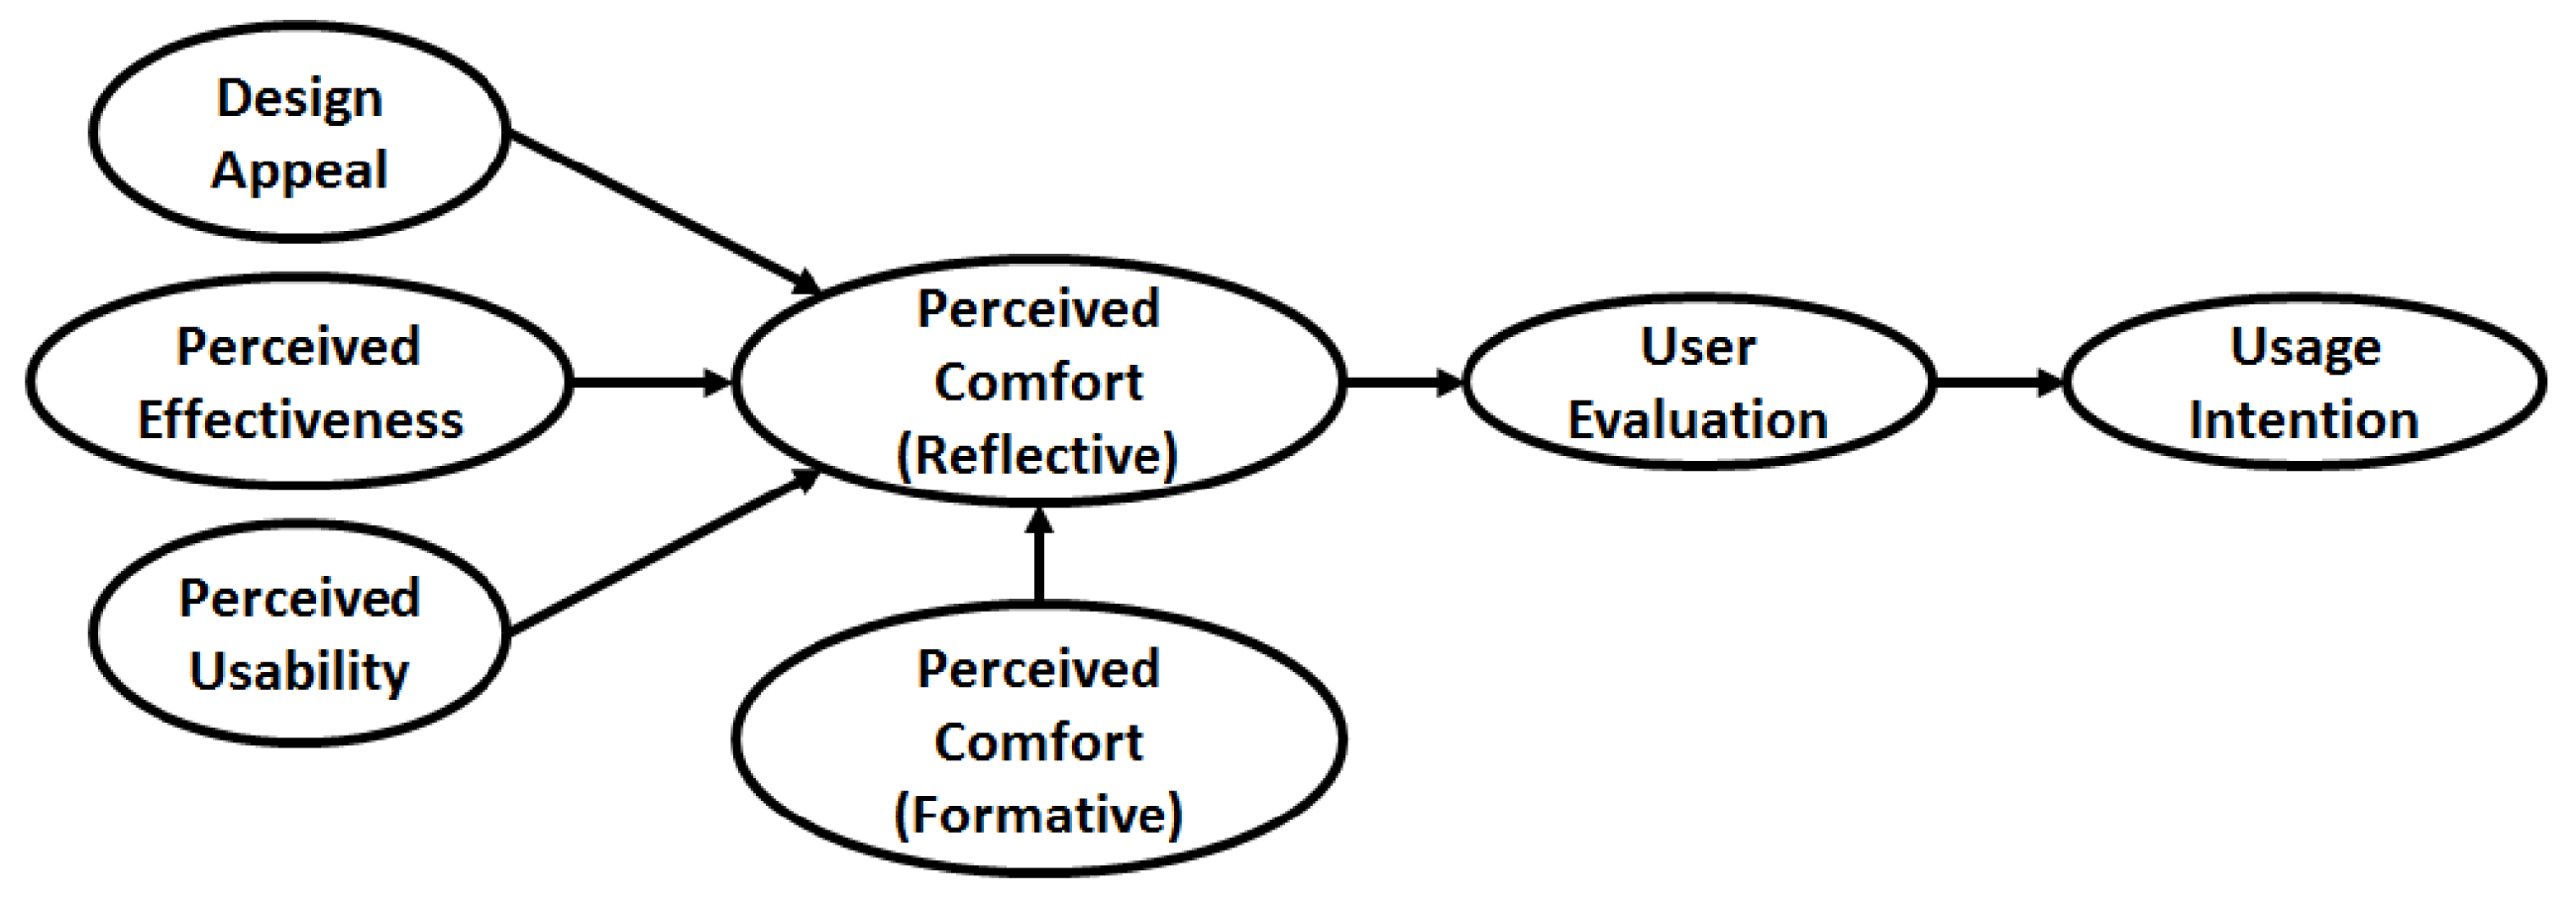
Figure 9. Case Study (Perceived Comfort – Formative and Reflective Relationship).
4.3.1 Measurement model assessment
The first step in Covariance-Based SEM or PLS-SEM is to conduct the measurement model assessment (Anderson & Gerbing Reference Anderson and Gerbing1988; Hair Jr et al. Reference Hair, Hult, Ringle and Sarstedt2016). The measurement model is a relationship between the measurements (surveys and sensors) with the psychological construct. Each construct has its own measurement model. For all three models tested in this work, the Perceived Comfort psychological factor has both formative and reflective measurements resulting in a Multiple Indicator Multiple Causes (MIMIC) model. Formative measurements (e.g., features from sensor readings) attempt to directly measure attributes that influence a psychological construct, while reflective measurements (e.g., factors from surveys) are used to make inferences about the construct. Development of a full SEM path model can aid in developing system level inferences about the role of individual attributes, their influence on user sentiment, and downstream constructs (e.g., intention to use, intention to purchase). In PLS-SEM, the standard procedure to deal with such a model is to split the MIMIC latent factor into two factors – one purely formative where the factor causes the construct and one purely reflective where the construct causes the factor.
In a reflective model, a latent variable is posited as the common cause of the measurements/indicator variables (Tenenhaus et al. Reference Tenenhaus, Vinzi, Chatelin and Lauro2005). That is, the reflective measurements are used to make inferences regarding the latent variable since the causal action flows from the latent variable to the measurement variables. A formative model posits a composite variable that summarizes the common variation in a collection of measurement/indicators (Tenenhaus et al. Reference Tenenhaus, Vinzi, Chatelin and Lauro2005). That is, the formative measurements influence the latent variable since the causal action flows from the measurement/indicator variables to the composite latent variables.
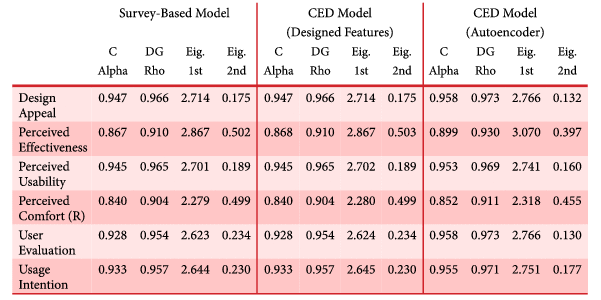
In the case of Perceived Comfort, the formative part is indicated as Perceived Comfort (Formative) and the reflective part as Perceived Comfort (Reflective). The Perceived Comfort (Formative) psychological construct affects the Perceived Comfort (Reflective) psychological construct as shown in Figure 9. The other psychological constructs are all reflective in nature. The measurement model assessment results are shown in Table 2.
From the table, it can be observed that for all three models Cronbach’s alpha (C Alpha), and the Dillon–Goldstein ratio (DG Rho) are satisfactory (i.e., ${>}0.7$
). Similarly, the first eigenvalue (Eig. 1st) is greater than 1 and the second eigenvalue (Eig. 2nd) is less than 1 for all three models. Thus, the measurement models of all three cases in this work satisfy the unidimensionality criteria. In the next section, the structural model assessment is presented.
${>}0.7$
). Similarly, the first eigenvalue (Eig. 1st) is greater than 1 and the second eigenvalue (Eig. 2nd) is less than 1 for all three models. Thus, the measurement models of all three cases in this work satisfy the unidimensionality criteria. In the next section, the structural model assessment is presented.
Table 2. Measurement Model Assessment (Unidimensionality)
4.3.2 Structural model assessment
To validate the structural model, the $R^{2}$
and communality values are used as assessment criteria. In structural models there are two types of latent variables – endogenous latent variables and exogenous variables (Anderson & Gerbing Reference Anderson and Gerbing1988). The exogenous latent variables affect other latent variables while the endogenous latent variables are effected by other latent variables (exogenous or other endogenous variables). For this case study Design Appeal, Perceived Effectiveness, Perceived Usability, and Perceived Comfort (Formative) are exogenous variables and Perceived Comfort (Reflective), User Evaluation, and Usage Intention are endogenous variables. Following the recommendations in Peng & Lai (Reference Peng and Lai2012) and Sanchez & Trinchera (Reference Sanchez and Trinchera2012), the
$R^{2}$
and communality values are used as assessment criteria. In structural models there are two types of latent variables – endogenous latent variables and exogenous variables (Anderson & Gerbing Reference Anderson and Gerbing1988). The exogenous latent variables affect other latent variables while the endogenous latent variables are effected by other latent variables (exogenous or other endogenous variables). For this case study Design Appeal, Perceived Effectiveness, Perceived Usability, and Perceived Comfort (Formative) are exogenous variables and Perceived Comfort (Reflective), User Evaluation, and Usage Intention are endogenous variables. Following the recommendations in Peng & Lai (Reference Peng and Lai2012) and Sanchez & Trinchera (Reference Sanchez and Trinchera2012), the $R^{2}$
metric is obtained only for endogenous variables. Also, in the case of PLS-SEM the assessment of communality for latent variables with only formative measures is not defined (Peng & Lai Reference Peng and Lai2012; Sanchez & Trinchera Reference Sanchez and Trinchera2012). Hence, for this work communality assessment is excluded for the only formative latent factor (psychological construct) – Perceived Comfort (Formative).
$R^{2}$
metric is obtained only for endogenous variables. Also, in the case of PLS-SEM the assessment of communality for latent variables with only formative measures is not defined (Peng & Lai Reference Peng and Lai2012; Sanchez & Trinchera Reference Sanchez and Trinchera2012). Hence, for this work communality assessment is excluded for the only formative latent factor (psychological construct) – Perceived Comfort (Formative).
Table 3. Structural Model Assessment
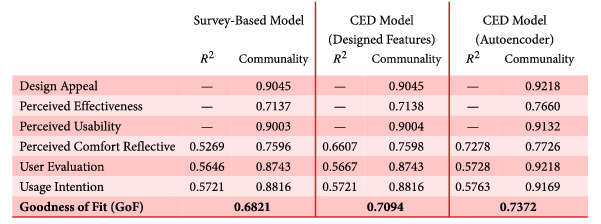
The structural model assessment values are shown in Table 3. From Table 3 it can be observed that in all cases, the $R^{2}$
values for the endogenous psychological constructs range from moderate to very good condition (
$R^{2}$
values for the endogenous psychological constructs range from moderate to very good condition ( $R^{2}$
for exogenous latent variables is not calculated in PLS-SEM), while the communality values criteria are clearly satisfied by all cases. An important observation can be made for the
$R^{2}$
for exogenous latent variables is not calculated in PLS-SEM), while the communality values criteria are clearly satisfied by all cases. An important observation can be made for the $R^{2}$
value for the Perceived Comfort (Formative) psychological construct, which is 0.5269 for the survey-based model, 0.6607 for the manually extracted features based Cyber-Empathic model, and 0.7278 for the Autoencoder-based Cyber-Empathic model.
$R^{2}$
value for the Perceived Comfort (Formative) psychological construct, which is 0.5269 for the survey-based model, 0.6607 for the manually extracted features based Cyber-Empathic model, and 0.7278 for the Autoencoder-based Cyber-Empathic model.
First, this validates the results from (Ghosh et al.
Reference Ghosh, Olewnik, Kim, Lewis and Lakshmanan2017a
) that the Cyber-Empathic model performs better than the pure survey-based model in understanding consumer perceptions. Second, since the $R^{2}$
value for the Perceived Comfort Formative construct for the Autoencoder-driven model is larger than the value for manually extracted features, it demonstrates the superiority of using Autoencoders for this case study. In fact, for the Autoencoder-driven model, the
$R^{2}$
value for the Perceived Comfort Formative construct for the Autoencoder-driven model is larger than the value for manually extracted features, it demonstrates the superiority of using Autoencoders for this case study. In fact, for the Autoencoder-driven model, the $R^{2}$
value is greater than 0.7, which is characterized as ‘very good’ in the PLS-SEM literature while for the manually extracted features the value is only considered ‘moderate’ (Peng & Lai Reference Peng and Lai2012; Sanchez & Trinchera Reference Sanchez and Trinchera2012; Hair Jr et al.
Reference Hair, Hult, Ringle and Sarstedt2016). Based on the structural model assessment it can be concluded that for all three cases satisfactory models are obtained, which establishes the foundation for the inter-model comparison based on the pseudo GoF indicator.
$R^{2}$
value is greater than 0.7, which is characterized as ‘very good’ in the PLS-SEM literature while for the manually extracted features the value is only considered ‘moderate’ (Peng & Lai Reference Peng and Lai2012; Sanchez & Trinchera Reference Sanchez and Trinchera2012; Hair Jr et al.
Reference Hair, Hult, Ringle and Sarstedt2016). Based on the structural model assessment it can be concluded that for all three cases satisfactory models are obtained, which establishes the foundation for the inter-model comparison based on the pseudo GoF indicator.
For the case study a GoF value of 0.6821 for the survey-based model, 0.7094 for the manually extracted feature based Cyber-Empathic model and 0.7372 for the Autoencoder-based Cyber-Empathic model are obtained. Clearly, the Autoencoder-based model outperforms the other two models. GoF is calculated as the geometric mean of the average $R^{2}$
and average communality and hence, GoF of the Autoencoder-based model being the largest is statistically valid as well. The path coefficients of the structural model for all three cases are presented in Figures 10–12 in Appendix A.
$R^{2}$
and average communality and hence, GoF of the Autoencoder-based model being the largest is statistically valid as well. The path coefficients of the structural model for all three cases are presented in Figures 10–12 in Appendix A.
Although the difference between the GoF values is small, in the case of PLS-SEM it is important to consider the relative range of the GoF values (as stated in Section 3). The results demonstrate that the integration of the unsupervised deep learning method with the CED framework does not degrade the performance of the model and can be satisfactorily used to model user perceptions. This is a significant result considering a design process in general.
Extracting useful information from user–product interaction data can be a resource intensive task and demands extensive domain knowledge. Using unsupervised deep learning helps alleviate this challenge and can provide a foundation to model user perception about the product under consideration. However, CED should not be considered a preference model nor a predictive model that would provide designers an analytical basis for determining how much to change a product feature to optimize the design. This work instead is to demonstrate the usefulness of incorporating user–product interaction data in the form of sensor readings to model user perceptions. Specifically, the comparison is to see if/how much model fit improves through introduction of sensor data and then to see if the model improves further when identification of relevant features from the sensor data is automated.
5 Conclusions
This work advances the existing CED framework in two important ways by incorporating an unsupervised deep learning method and PLS-SEM. User–product interaction data is captured using product embedded sensors, while users’ psychological constructs are measured using surveys. The unsupervised deep learning method extracts salient features from raw sensor data, while PLS-SEM establishes the relationship between user–product interaction and users’ psychological constructs. The unsupervised deep learning algorithm uniquely addresses the challenge of extracting hand-engineered features from sensor data, while PLS-SEM adds further capability by addressing the challenge of handling non-normal input data. This results in a scalable, improved and more generalizable CED framework that has been demonstrated by model comparison experiments in this work.
While the insights and results are encouraging, this work opens new avenues to advance the framework even further. For example, work thus far has not addressed how design inferences can be made using the CED framework in general. The features extracted by Autoencoders are mathematical abstracts and hence it is difficult to associate a physical meaning with them. Further, interpretation of the features would require further controlled experiments but could eventually reveal valuable insights regarding product attributes for designers.
Autoencoders and PLS-SEM are highly scalable methods and hence can be used to incorporate a variety of information. However, to validate this claim, a study using a more complex product needs to be conducted. Also, one of the key elements missing from the CED framework is the ability to identify and incorporate usage context while the users are interacting with the product. Further, this and previous work dealt only with user perceptions for a single product; however for design activities it would be very beneficial to capture user preferences based on interactions with variants of the same product or multiple products simultaneously (e.g., shoes and cell phones). Taking advantage of the type of automation explored in this work in conjunction with additional data sources for products in the field provides a foundation for understanding product perceptions on an individual consumer basis across the lifetime of the product.
For demonstration, this work integrated Denoising Autoencoders as the unsupervised feature learning methods. However, there are other unsupervised learning methods or dimensionality reduction methods such as Generative Adversarial Networks (Goodfellow et al. Reference Goodfellow, Pouget-Abadie, Mirza, Xu, Warde-Farley, Ozair, Courville, Bengio, Ghahramani, Welling, Cortes, Lawrence and Weinberger2014), Restricted Boltzmann Machines (Lee et al. Reference Lee, Grosse, Ranganath and Ng2009a ,Reference Lee, Largman, Pham, Ng, Bengio, Schuurmans, Lafferty, Williams and Culotta b , Reference Lee, Grosse, Ranganath and Ng2011; Norouzi, Ranjbar & Mori Reference Norouzi, Ranjbar and Mori2009) and PCA that should be investigated to validate the generalizability of unsupervised learning based CED.
The dataset used in this work has been made available for other research groups to use to explore alternative methods. The dataset can be found in the Institutional Repository maintained by the University at Buffalo Libraries at:https://ubir.buffalo.edu/xmlui/handle/10477/76789. Unsupervised deep learning methods can be complicated to implement, thus a comparison between unsupervised deep learning methods and traditional methods like PCA is an area for future work.
As CED incorporates different psychological constructs along with user–product interaction data, there is a potential to extend the framework and design products that target specific psychological cues of every individual customer. That is, there is a potential to extend CED to address mass customization design challenges.
Finally, user–product interaction data presents an avenue to provide real-time feedback to users and guide them to use products more effectively. Considering the CED framework is composed of a network of psychological constructs, using real-time feedback presents an avenue to influence users’ product perception in a more focused and targeted manner, representing an area for further exploration.
Acknowledgments
This work has been supported by National Science Foundation (NSF) under Grant No. CMMI-1435479. This support is gratefully acknowledged. Any findings and opinions reported in this work represent the authors’ views and do not represent NSF.
Appendix A
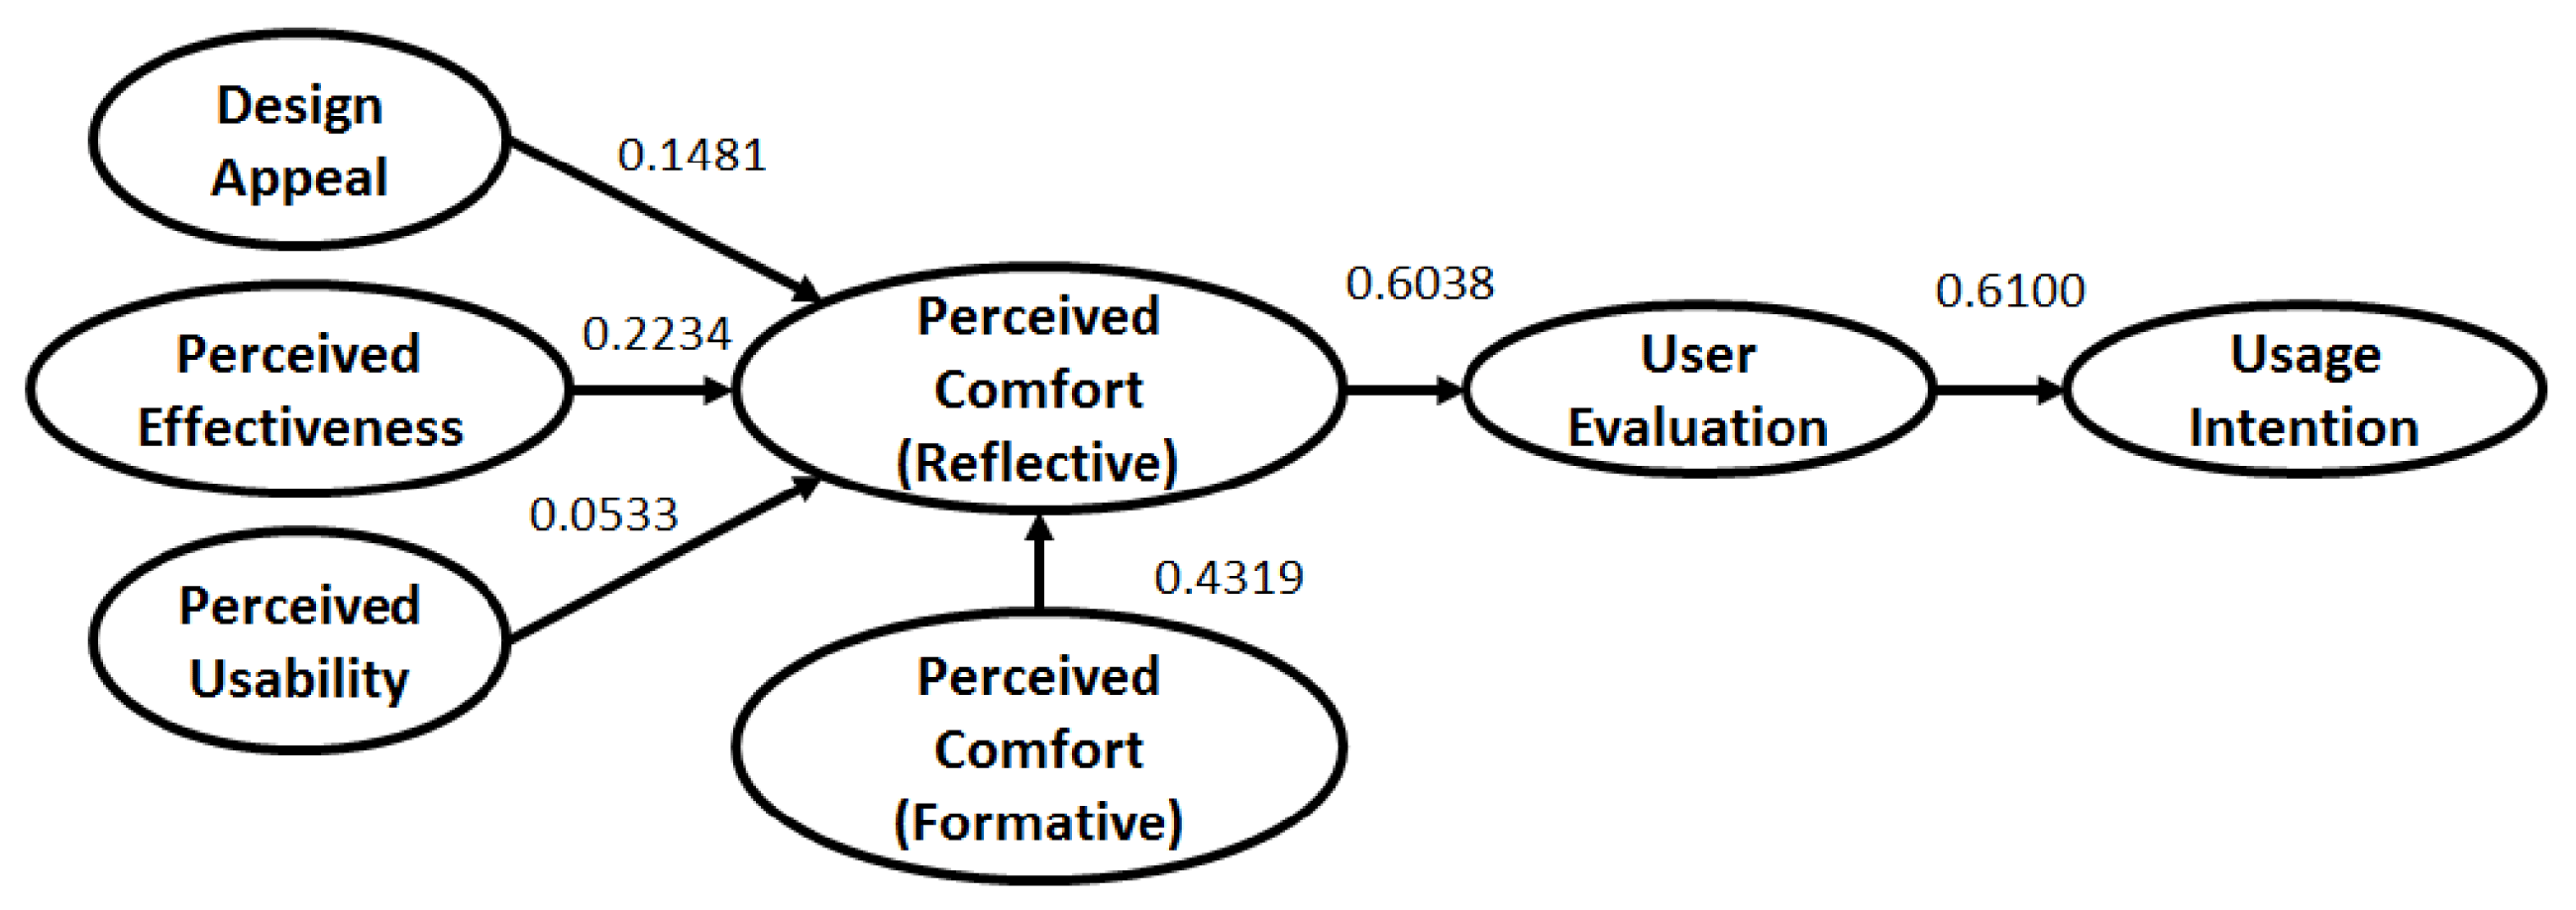
Figure 10. Structural Model Path Coefficients – Survey-Based Model.
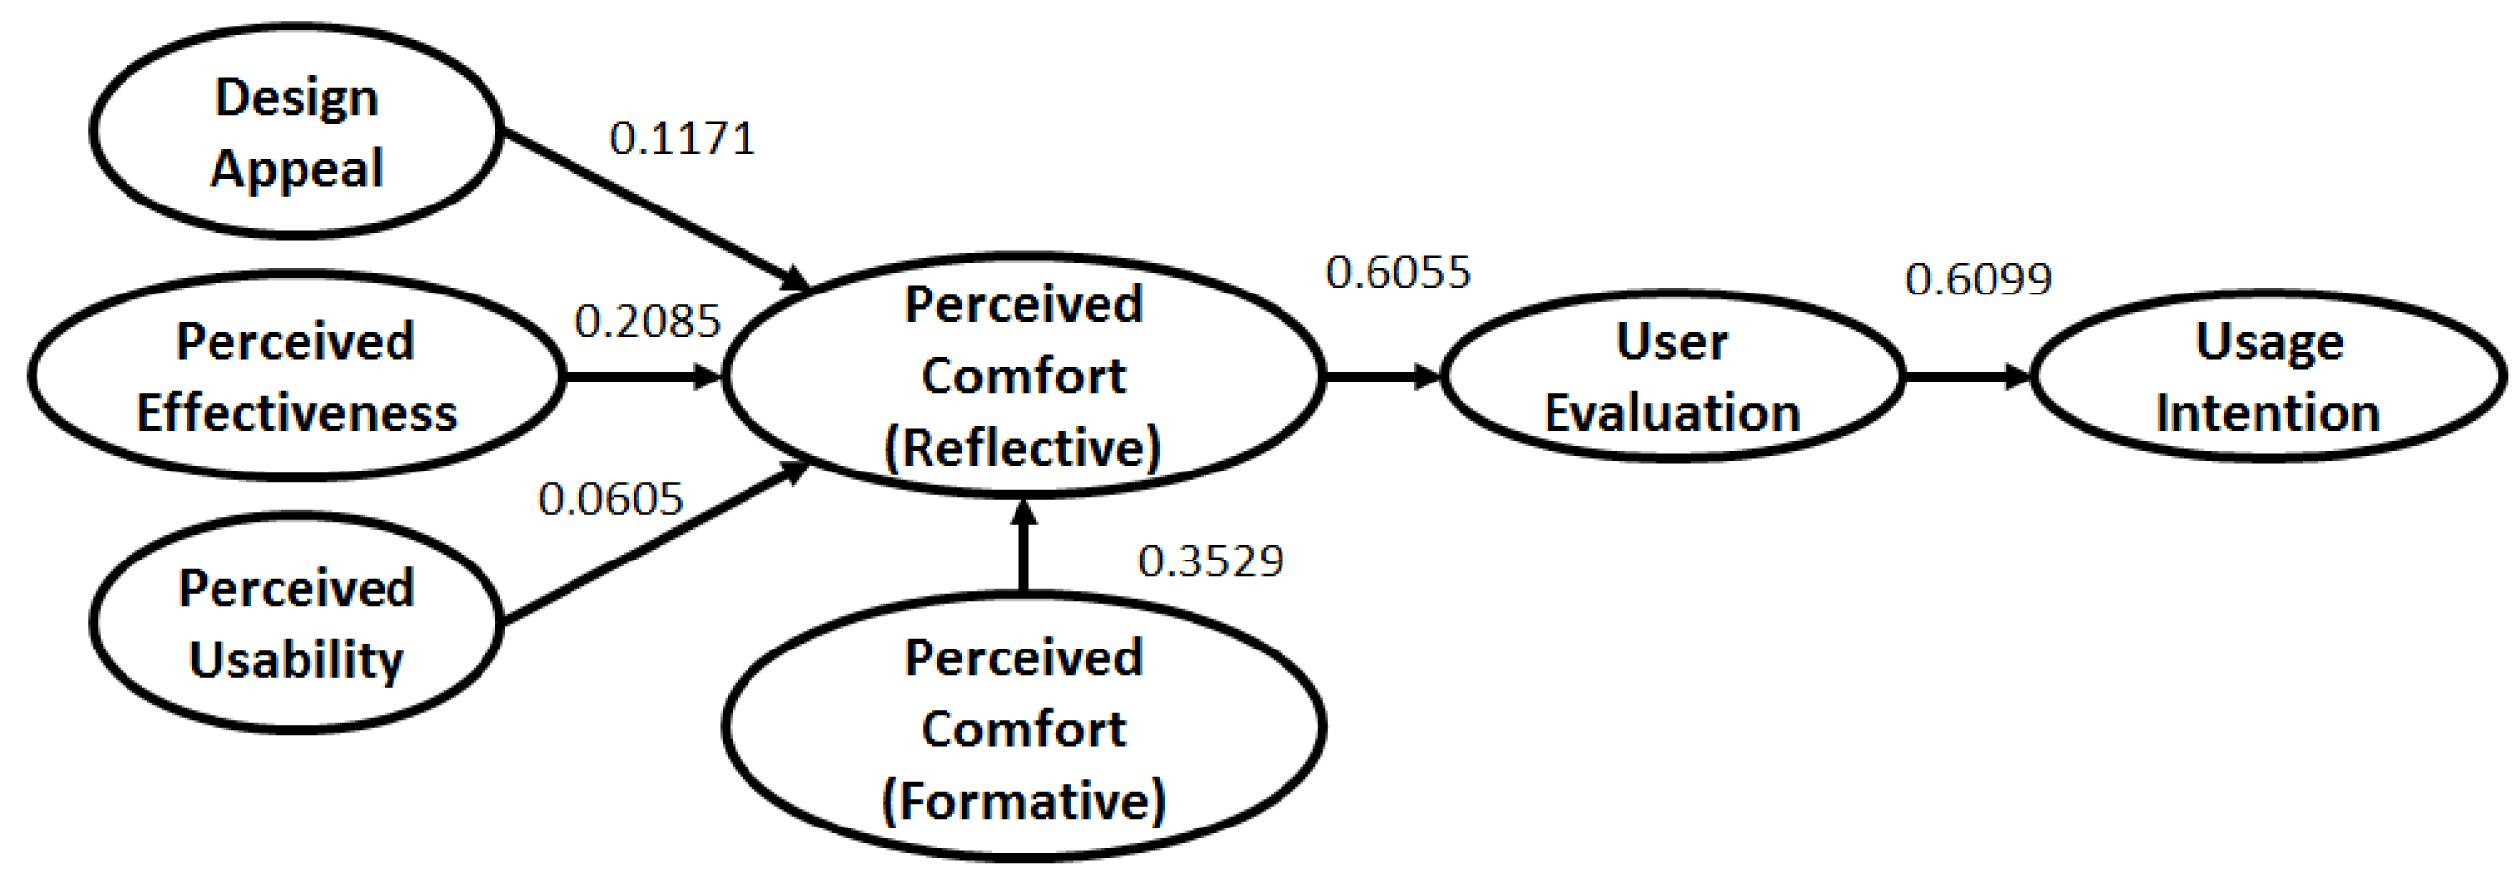
Figure 11. Structural Model Path Coefficients – Cyber-Empathic Model (Designed Features).
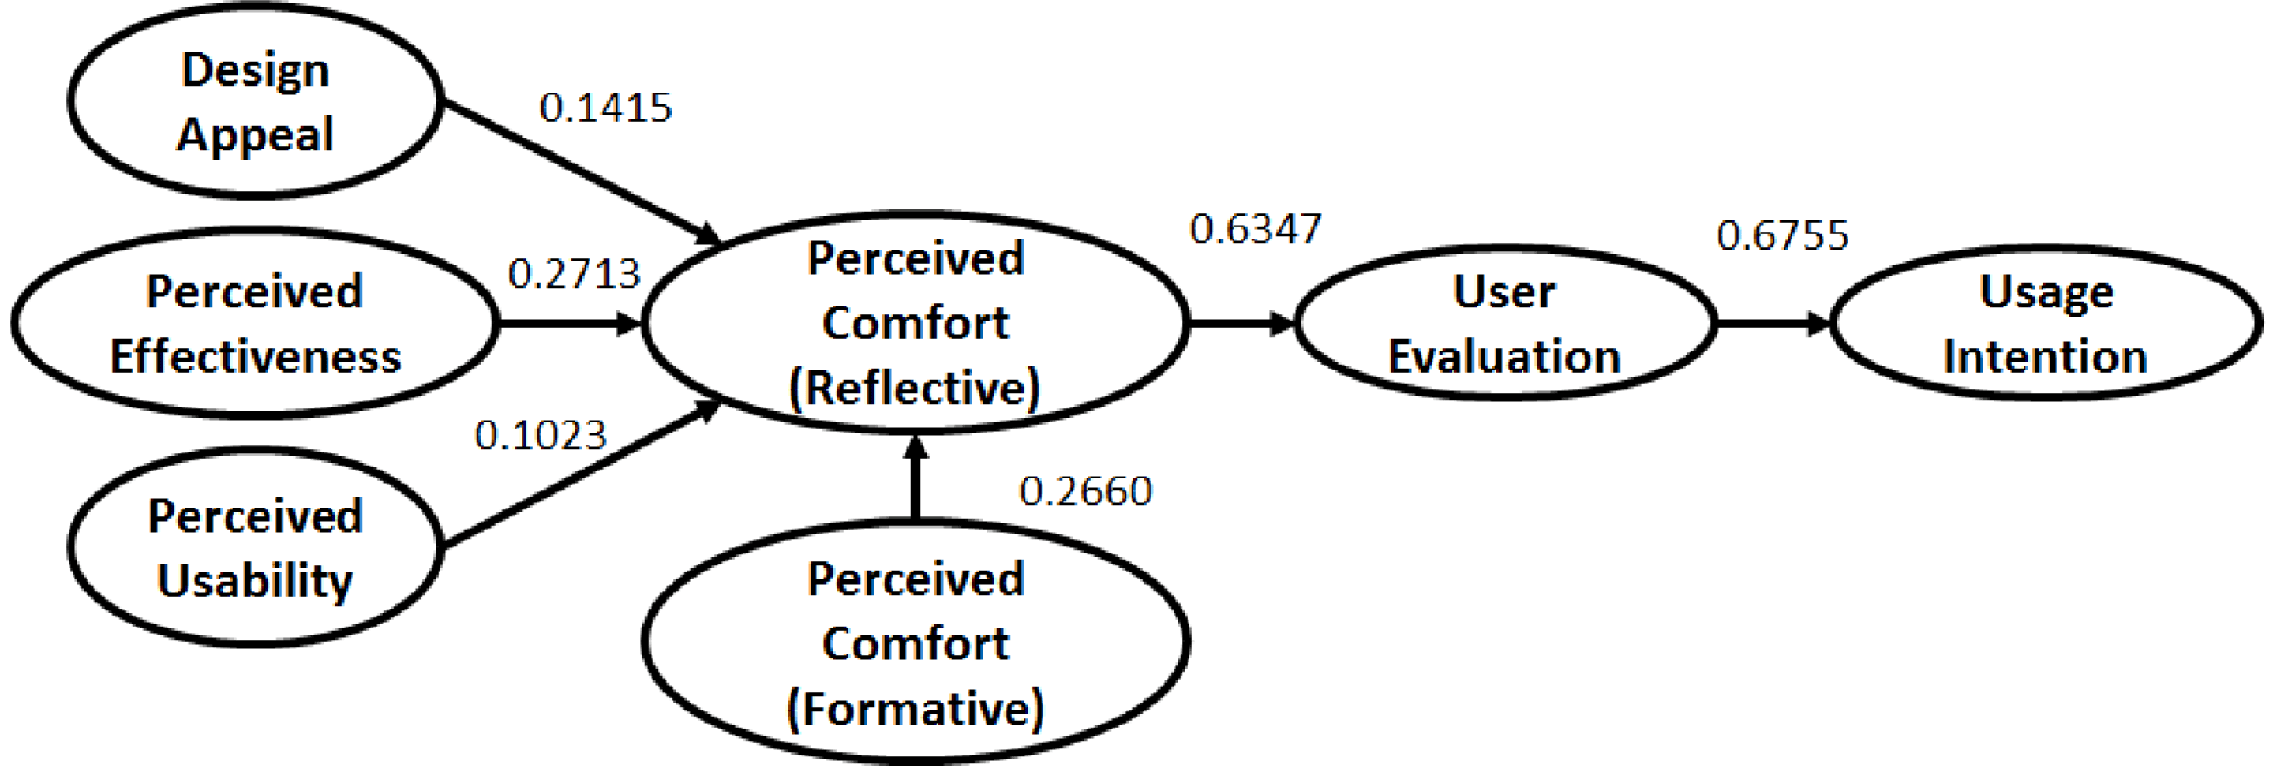
Figure 12. Structural Model Path Coefficients – Cyber-Empathic Model (Autoencoder Features).


 Open access