


Mild cognitive impairment (MCI) is defined as cognitive decline beyond normal aging with no significant functional impairment. The amnestic variant of MCI (aMCI) has a high potential of conversion into Alzheimer’s disease (AD). Patients with aMCI progress to AD at a rate of 10–15% compared to the global incidence AD rate of 1–2%. Reference Petersen, Roberts and Knopman1 When patients with aMCI are positive for cerebrospinal fluid (CSF) AD biomarkers, they are diagnosed with prodromal AD Reference McKhann, Knopman and Chertkow2 and are at a very high risk of conversion into AD. Prodromal AD is a perfect target for anti-amyloid therapies aimed at stabilizing the disease and preventing further neuronal loss. 3
Diagnosis of the amnestic variant of AD is based on clinical evaluation, basic laboratory tests, and structural magnetic resonance imaging (MRI) with all parts of puzzle being equally important. The medial temporal atrophy (MTA) scale is routinely used as a visual rating scale in the imaging workup of suspected AD. Reference Duara, Loewenstein and Potter4 However, some authors have suggested that the entorhinal cortex is affected even earlier than the hippocampus by AD. Reference deToledo-Morrell, Stoub and Bulgakova5 Recently, a new visual quantitative visual scale named the entorhinal cortex atrophy (ERICA) score was developed based on atrophy of the entorhinal cortex. An ERICA score ≥ 2–3 is thought to have high diagnostic accuracy for probable AD. Reference Enkirch, Traschütz and Müller6 We compared ERICA vs. MTA’s ability to predict conversion from aMCI to AD. We predicted that ERICA would show higher interrater reliability than MTA and higher specificity in predicting conversion from aMCI to AD.
We retrospectively analyzed all MRI data from 61 aMCI patients diagnosed at La Clinique Interdisciplinaire de Mémoire (CIME) between January 2017 and 2020 (see Table 1). Total follow-up period extended as long as 3 years. All patients were diagnosed according to recent consensus criteria. Reference McKhann, Knopman and Chertkow2,Reference Smith, Barber and Field7 CSF biomarkers (aß1–42, p-tau and total tau), when positive, were considered proof of underlying AD pathology. The study was approved by our local ethics committee. Only participants with a brain MRI performed within a year from clinical evaluation were included. All subjects underwent brain MRI – dementia protocol – either on a 1.5-T unit (Magnetom Aera, Siemens, Germany) or a 3-T unit (Magnetom Skyra, Siemens, Germany). We used coronal sections aligned to the brainstem with a section thickness of 1 mm after multiplanar reconstruction of the T1 3D FSPGR sequence to rate MTA and ERICA scales. Independent raters (XR, MB) were blinded to clinical diagnosis. XR is a fourth-year medical student and MB a radiologist with 15 years of experience in neuroimaging. Each hemisphere was scored with the ERICA (0–3) and MTA scales (0–4) (see Figure 1). Interrater reliability was analyzed, but only MB’s results were used for predictive analysis. An ERICA score ≥2 and a MTA score ≥2 for ≤75 years old (yo), or ≥3 for >75 yo were considered AD-positive. Reference Duara, Loewenstein and Potter4,Reference Enkirch, Traschütz and Müller6 If the scores differed between each hemisphere, then the highest value was used for analyses. Weighted Cohen’s Kappa statistics was calculated to assess interrater reliability. Sensitivity, specificity, confidence intervals (CI), and chi-square tests were performed for both MTA and ERICA to predict conversion from aMCI to AD. A multiple logistic regression analysis was conducted to identify predictors of AD conversion.

Figure 1: The ERICA score. A score of 0 refers to normal volume of the entorhinal cortex and parahippocampal gyrus; a score of 1, mild atrophy with widening of the collateral sulcus; a score of 2, moderate atrophy with detachment of the entorhinal cortex from the cerebellar tentorium (the “tentorial cleft sign”); and a score of 3, pronounced atrophy of the parahippocampal gyrus and a wide cleft between entorhinal cortex and the cerebellar tentorium. 3
Table 1: Demographics

Missing data: 12 MMSE and 5 MoCA.
Results showed that a positive ERICA score (≥2–3) was associated with AD conversion with a sensitivity (SE) of 56% (95% CI: 30–80%) and a specificity (SP) of 78% (63–89%) (p = 0.02) vs. 69% (41–89%) SE and 60% (44–74%) SP for the positive MTA score (≥2 for ≤75 yo, or ≥3 for >75 yo). Interrater reliability estimated using Cohen’s kappa at 95% CI was superior for the ERICA method, for both hemispheres: 0.43 (0.25–0.61) vs 0.27 (0.15–0.40) for right hemisphere and 0.56 (0.39–0.72) vs 0.36 (0.23–0.50) for left hemisphere. Moreover, ERICA was significantly associated with CSF positivity for AD (p = 0.02) (SE of 46%; SP of 100%), whereas MTA was not (SE of 62%; SP of 60%; p = 0.41). Regression analyses identified age as the best predictor of AD conversion (OR 1.17, 95% CI 1.02–1.36), while adjusting for MMSE (1.26, 0.76–2.08), MTA score (5.86, 0.99–34.82) and ERICA (3.23, 0.62–16.74). AUC of 0.67 (p = 0.0150) for ERICA and 0.64 (p = 0.0539) for MTA.
Figure 2 is an illustration of the differences between ERICA and MTA in a single patient who converted from aMCI to AD over 1 year.
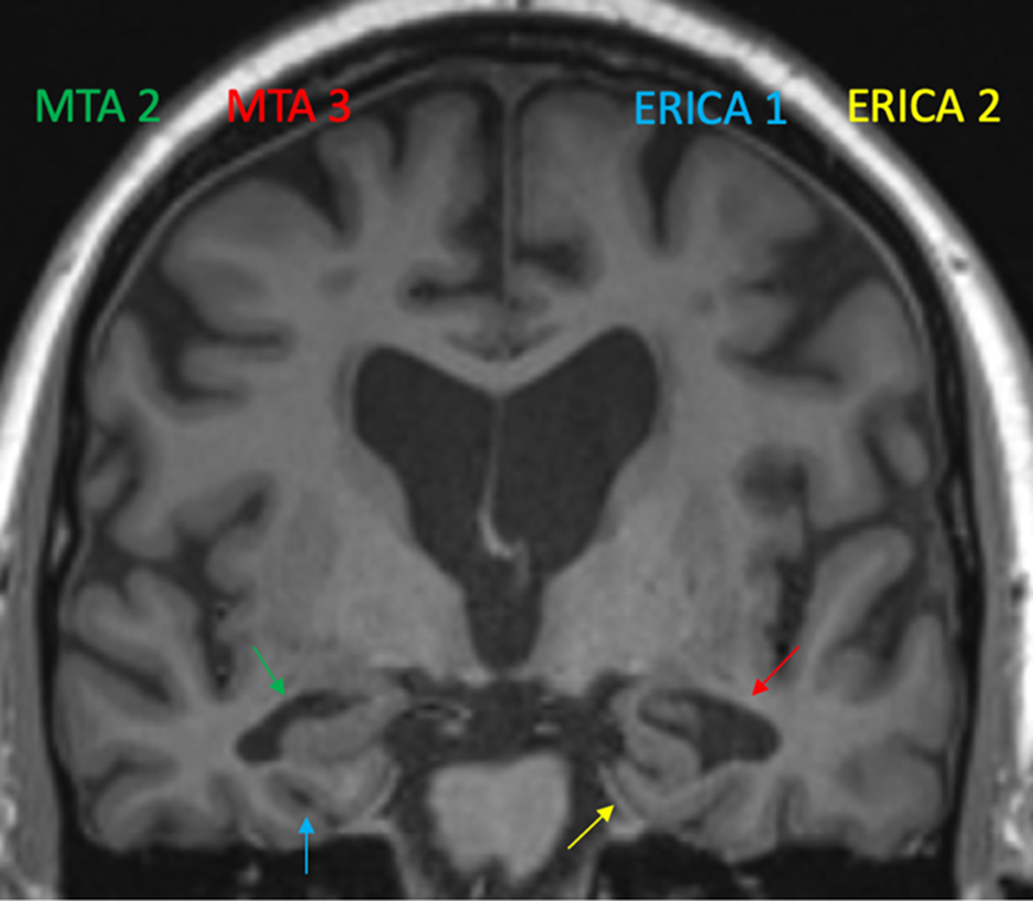
Figure 2: The MTA and the ERICA score in a single patient who converted from aMCI to AD over a 1-year follow-up. Green arrow shows a MTA score of 2 (widening of the right choroid fissure and right temporal horn) while the red arrow shows a MTA score of 3 (moderate loss of hippocampal volume). Blue arrow shows an ERICA score of 1 (mild atrophy with widening of collateral sulcus). Yellow arrow shows an ERICA score of 2, moderate atrophy with detachment of the entorhinal cortex from the cerebellar tentorium (the “tentorial cleft sign”).
In conclusion, we showed that the ERICA score was superior to MTA in predicting conversion to AD in a sample of 61 aMCI participants. Although SE measures were similar, ERICA showed superior SP. Interrater reliability was higher for ERICA, and this score was associated with CSF positivity, whereas MTA was not. These results expand on previous literature which has shown similar SE and SP for the ERICA score to predict AD conversion from MCI. Reference Traschütz, Enkirch and Polomac8 However, our data suggest that ERICA could be an efficient tool with higher specificity than MTA in the identification of AD conversion from aMCI. Further research with larger cohorts will be needed to replicate these findings. Combining ERICA with AD biomarkers as well as other variables may improve diagnostic accuracy.
Acknowledgements
Authors want to acknowledge the support of Laval University's research chaire on progressive primary aphasias.
Disclosures
We have no competing interests to disclose.
Statement of Authorship
MS and DB contributed equally to this work. XR, MB and RJrL were involved in study design, data analysis, and drafting the initial version of the manuscript. XR was involved in data collection. All authors provided input to the manuscript and agreed on the final version of the manuscript.


 Open access