


N conservation is a priority to all animal species(Reference Singer1); however, as ruminants evolved, they developed additional ways to conserve N more pronouncedly as a survival mechanism(Reference Reynolds and Kristensen2,Reference Detmann, Valente and Batista3) . As a consequence, ruminant animals became able to produce milk and meat feeding on diets with low protein content or exclusively from non-protein N (NPN) sources(Reference Virtanen4). In cattle, as much as 40–80 % of urea produced by the liver may re-enter the gastrointestinal tract (GIT), being most of recycled urea directed towards the rumen(Reference Lapierre and Lobley5). Urea entry into the rumen occurs through combinations of the saliva flow and the transfer through the rumen epithelium(Reference Kennedy and Milligan6). The transfer of urea across the rumen epithelium also can occur via process mediated by urea transporters and aquaporins (AQP)(Reference Abdoun, Stumpff and Rabbani7,Reference Røjen, Poulsen and Theil8) .
The amount of recycled urea into GIT is directly associated with dietary N intake(Reference Lapierre and Lobley5). Under low protein intake, the proportion of dietary N recycled as urea is increased to assure a continuous N supply for microbial growth(Reference Egan9,Reference Van Soest10) . Concurrently, the urinary N losses decrease as an attempt to spare N(Reference Batista, Detmann and Valadares Filho11). There is also a direct relationship between dietary N intake and urinary N excretion, whereby increasing dietary N will increase urinary N excretion and consequently the N wasted(Reference Li, Titgemeyer and Hanigan12).
Besides the amount of dietary N, the digestion and absorption site may also influence the N excretion, urea recycling and the efficiency of N utilisation. For instance, when the amount of dietary rumen undegradable protein is increased, N excretion can be decreased and the efficiency of N utilisation can be improved(Reference Batista, Detmann and Gomes13,Reference Silva, Detmann and Rennó14) . Therefore, if the N source is provided in the abomasum, the forage intake can increase(Reference Egan9,Reference Carvalho, Doelman and Martín-Tereso15) , the urinary N excretion decreases and efficiency of N utilisation is enhanced(Reference Carvalho, Doelman and Martín-Tereso15). In others words, as an alternative to decrease N excretion and improve efficiency of N utilisation, the dietary N source may be provided in the post-rumen. Thus, further studies are needed varying the site of N supply to understand N metabolism and its utilisation by the animal.
Thus, considering that NPN sources, such as urea, can be absorbed in the intestine, we hypothesise that moving supplementation site from rumen to abomasum can improve the efficiency of N utilisation without compromising productive characteristics, such as intake and digestibility.
Therefore, our objective was to evaluate differences between the supplementation or infusion of urea in rumen and/or abomasum on forage digestion, N metabolism, urea kinetics and ruminal urea transporters in cattle fed a low-quality tropical forage. Further understanding the possibilities of NPN supply aims to expand the use of non-edible feed resources, potentially improving the profitability and sustainability of the livestock production in the tropics, further reducing the resource used for meat production and N outputs to the environment.
Material and methods
This experiment was carried out at the Department of Animal Science of the Universidade Federal de Viçosa, Viçosa, Brazil. All surgical and animal care procedures and management followed the Guide for the Production, Maintenance or Use of Animals for Teaching Activities or Scientific Research of the Brazilian National Council for Animal Experimentation Control and were approved by the Institutional Animal Care and Use Committee of the Universidade Federal de Viçosa before commencing this experiment (protocol number 015/2019).
Animals and management
Five rumminally and abomasally fistulated Nellore heifers, averaging 283 (se 23) kg of body weight (BW), were used. The heifers were housed in individual stalls (2 × 5 m) with concrete floor and had unrestricted access to water and complete macro/micro mineral mixture (80 g/kg of P). The animals were adapted to experimental facilities, management and basal diet for 30 d prior the beginning of the experiment. The basal diet consisted of a low-quality Tifton hay (Cynodon sp., Table 1) chopped to a 15-cm particle size and fed twice daily at 06.00 and 18.00 hours. To ensure ad libitum forage intake, the amounts of hay and orts were monitored daily in order to assure at least 300 g of orts/kg of forage offered.
Table 1. Chemical composition of the Tifton hay
(Mean values with their standard errors)
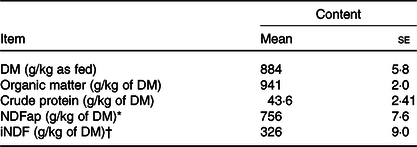
* Neutral-detergent fibre corrected for contaminant ash and protein.
† Indigestible neutral-detergent fibre.
Treatments and experimental design
The experiment was performed according to a complete 5 × 5 Latin square design, with five treatments, five animals and five experimental periods. Each experimental period lasted 25 d, with 14 d for adaptation to the supplement(Reference Machado, Detmann and Mantovani17) and 11 d for sample collection. The animals were weighed at the beginning and at the end of each experimental period in order to calculate the average BW and relative voluntary intake.
The five treatments were control (only forage), continuous infusion of urea in the abomasum (AC), continuous infusion of urea in the rumen, a pulse dose of urea in the rumen every 12 h (PR) and a combination of PR and AC, with half of the urea dose delivery in each delivery site.
The amount of supplemental urea (a mixture of urea and ammonium sulphate at the ratio of 9:1) was calculated in order to increase the crude protein (CP) content of the diet up to 100 g/kg DM. This dietary CP content has been based on a previous work and is expected to allow optimising intake and fibre digestion in cattle fed a low-quality tropical forage(Reference Sampaio, Detmann and Paulino18). From the average forage intake obtained during the 30-d adaptation of the animals to experimental facilities, we obtained a first estimate of the supplemental urea amount. Then, that amount was supplied during the first 7 d of the adaptation period. As the forage intake changed due to supplemental N, the urea amount was adjusted based on average forage intake during the first 7 d and offered during the last 7 d of adaptation period. The average forage intake of the last 7 d of adaptation period was then used to estimate the supplement amount to be offered during the collection period. This approach was applied in each of the five consecutive periods.
For the pulse dose of urea, the supplement was packed into paper bags and provided into the rumen twice per d concurrently with forage feeding. For the continuous infusion either in rumen or abomasum, urea was previously diluted in 1·5 litres of a NaCl solution (9 g/l). The solution was infused continuously into the rumen and/or abomasum via the cannula using a peristaltic pump (BP600/4, Milan® Scientific Equipment, Inc.) and polyvinyl chloride tubing (4·75 mm internal diameter) at a rate of approximately 64 ml/h. Daily infusions were designed to last about 23·5 h, but if the infusions were not completed in that time, the remaining 0·5 h was used to ensure that the entire infusate was provided within a 24-h period. In order to assure a more homogenous experimental condition, the animals not assigned to continuous urea infusion were infused with the NaCl solution into the rumen and abomasum, as described above.
Sample collections
Voluntary forage intake was quantified from day 15 to day 19 of each experimental period. The calculations took into account the amount of forage offered from day 15 to day 18 and the orts obtained from day 16 to day 19. Representative samples of hay and orts were collected daily, stored in plastic bags and blended manually at the end of each period to obtain pooled samples per animal. All pooled samples were ground in a knife mill to pass through a 2-mm screen sieve. After that, half of each sample was ground again to pass through a 1-mm screen sieve. Samples were then stored for subsequent chemical analyses. Urea samples were retained from each 25-kg package of product and pooled for subsequent analysis.
Total faecal output was measured from day 19 to day 22. Faeces were collected immediately after each spontaneous defecation and stored in 35-litre buckets. At the end of each 24-h period, buckets were changed and the faeces weighed and manually blended, and an aliquot (50 g/kg) was collected daily. Each daily faecal sample was oven-dried (60°C) and ground as previously described for hay and orts samples. After grinding, samples were pooled per animal and period in proportion to the daily excretion to measure digestibility and N balance. Faecal samples from day 19 were used to quantify the background enrichment of 15N, and those from day 22 were used to measure enrichment of 15N for calculating urea kinetics(Reference Wickersham, Titgemeyer and Cochran19).
Also from day 19 to day 22, urine was collected quantitatively using a 2-way Foley probe (no. 24, Rush Amber, Kamuting) with a 30-ml balloon. At the free end of the probe, a polyethylene tube was attached through which the urine was conducted to a clean urine collection vessel (20 litres). Vessels were kept all time into Styrofoam boxes with ice in order to avoid N losses. At the end of each 24-h period, urine output was weighed and mixed thoroughly, and an aliquot (10 ml/l) was filtered through four layers of cheesecloth and frozen (–20°C) for later analysis. Total collections of urine from day 19 and day 22 were used to measured 15N background and enrichment, respectively, for later urea kinetics calculations(Reference Wickersham, Titgemeyer and Cochran19).
On day 18 of each experimental period, heifers were fitted with temporary central venous catheters (CVC; 14Ga × 20 cm; Biomedical®) in the jugular vein by percutaneous venipuncture(Reference Holder, Tricarido and Kim20) for blood collection and infusion of double-labelled urea ([15N15N]-urea, 99·8 atom % of 15N; Cambridge Isotope Laboratories). The catheter was flushed with sterile saline solution and filled with 5 ml of sterile solution containing heparin (100 IU/ml). Patency of the catheters was maintained by flushing with 5 ml of heparinised saline (10 IU/ ml) at least every 6 h, from the time the catheter was placed until 06.00 hours on day 20, when infusion of [15N15N]-urea solution started. The concentration of [15N15N]-urea in the solution was adjusted on the assumption that urea production was similar to N intake, and urea concentration of the solution was adjusted to yield a predicted enrichment of [15N15N]-urea of 0·1 atom percentage excess at plateau(Reference Marini and Van Amburgh21). In each period, 500 ml of solution was produced for each treatment, from which a 1·3 g/l stock solution of [15N15N]-urea was dissolved in sterile saline solution (9 g NaCl/l). The [15N15N]-urea solution was prepared using a sterile technique in a laminar flow hood and filtered through a 0·22-µm filter (Sterivex; Millipore Corporation) into a sterilised glass container stored at 4°C until its use. The infusion rate was 5 ml/h which delivered 0·200 mmol of urea N/h using a syringe infusion pump (BS-9000 Multi-Phaser; Braintree Scientific Inc.) until 16.00 hours of day 23, when the last sample was collected. To quantify the exact volume infused, syringes were weighed before and after infusion.
On day 19, blood was collected via catheter at 06.00, 12.00, 18.00 and 24.00 hours using syringes. Two 5-ml aliquots of blood were discarded before obtaining samples. Blood samples (10 ml) were injected immediately into vacuum tubes (BD Vacutainer) containing heparin (143 IU), placed in ice immediately after collection and centrifuged (1200 g , 15 min at 4°C). Plasma and serum were frozen (–20°C) for later analysis.
Digesta flow into the abomasum was estimated with the double marker method, using indigestible neutral-detergent fibre (NDF) and complex cobalt-ethylenediaminetetraacetic acid (Co-EDTA)(Reference Rotta, Valadares Filho and Detmann22). As a fluid marker, 5 g/d of Co-EDTA (420 mg of Co/d) were diluted in 4 litres of water and infused in the rumen continually from day 14 to day 22 of each period using a peristaltic pump (Milan Scientific Equipment, Inc.). Eight abomasal samples (1300 ml per sample) were collected from day 19 to day 22 of each experimental period. Sample collection began after discarding digesta accumulated in the cannula neck. The schedule used sampling at 9-h intervals(Reference Allen and Linton23) to represent every 3 h of a 24-h period in order to account for diurnal variation. Sampling was on day 19 at 00.00 and 12.00 hours, day 20 at 09.00 and 21.00 hours, day 21 at 06.00 and 18.00 hours and on day 22 at 03.00 and 15.00 hours. After collection, abomasal samples were split in two parts: 800 ml were filtered through a nylon filter (100 µm, SefarNitex 100/44; Sefar) for separation of the particle phase from the fluid plus the small particle phase. Fluid plus small particle and particle phase samples were weighed, frozen at –80°C, freeze-dried, ground as previously described, pooled per animal and analysed separately in order to estimate abomasal digesta flow. The remaining 500 ml were used to isolate bacteria associated with the fluid and particle phases(Reference Reynal, Broderick and Bearzi24). The bacterial pellets (from solid and liquid phases) were weighed, frozen (–80°C), freeze-dried and grounded using a mortar and pestle.
On day 23 of each period, for quantifying incorporation of urea recycled into microbial protein, samples of abomasal digesta (200 ml) were collected from the abomasal cannula just before morning feeding and at 2, 4, 6, 8 and 10 h after feeding, frozen at –80°C and freeze-dried. These sampling times represented 72–82 h of label infusion, during which the isotopic enrichment of 15N reached a plateau(Reference Wickersham, Titgemeyer and Cochran25). The freeze-dried samples were ground as previously described and subsequently pooled across sampling times on an equal weight basis.
On day 23, at the same times as abomasal sampling for 15N enrichment, ruminal fluid samples were obtained to evaluate pH, ruminal ammonia N (NH3-N) and volatile fatty acids (VFA; acetate, propionate, and butyrate) and to measure the 15N enrichment in bacteria. Ruminal contents (500 ml) were collected manually from the cranial, ventral and caudal areas of the rumen and filtered through four layers of cheesecloth. The pH samples were measured using a digital potentiometer. After that, an 8-ml aliquot of rumen fluid was combined with 2 ml of a 250 g/l solution of meta-phosphoric acid and frozen for subsequent VFA analysis. Another 40-ml aliquot was combined with 1 ml of a 9 M H2SO4 solution and frozen for later analysis of NH3-N. The remaining fluid and solids were used to isolate bacteria by differential centrifugation(Reference Cecava, Merchen and Gay26). Bacterial pellets were freeze-dried and ground using a mortar and pestle.
On day 25 at 06.00 hours, rumen papillae were biopsied from the ventral sac(Reference Kelly, McBride and Milligan27). Approximately 150 mg of rumen pappilae were collected during each biopsy and washed in PBS (pH = 7·4, 1X) ten times prior to immediately frozen in liquid N2 and then kept at –80°C for subsequent analysis.
Laboratory analysis
Samples of hay, orts, faeces and abomasal digesta, processed to pass through a 1-mm sieve, were analysed with regard to DM (dried overnight at 105°C; method G003/1), ash (complete combustion in a muffle furnace at 600°C; method M-001/1) and N (Kjeldahl procedure; method N-001/1) contents according to the standard analytical procedures of the Brazilian National Institute of Science and Technology in Animal Science(Reference Detmann, Souza and Valadares Filho28). The NDF contents were evaluated using a heat-stable α-amylase and omitting sodium sulphite(Reference Mertens29). The NDF contents were expressed exclusive of contaminant ash and protein (NDFap). Urea samples were analysed with regard to DM and CP contents. Samples of hay, orts and abomasal digesta, processed to pass through a 2-mm screen sieve, were evaluated with regard to iNDF content using F57 filter bags (Ankom Technology Corp.) and a 288-h in situ incubation procedure(Reference Valente, Detmann and Queiroz30). Cobalt concentration in abomasal samples (both fractions) was quantified through atomic absorption spectrometry (GBC Avanta ∑ atomic absorption spectrophotometer, Scientific Equipment, Braeside).
Abomasal digesta (both fractions) and the microorganisms isolated from it were analysed for purine bases(Reference Ushida, Lassalas and Jouany31) and N(Reference Detmann, Souza and Valadares Filho28) contents. The NRNA:Ntotal ratio in the microorganisms was used as the marker for estimating microbial production in the rumen.
Samples of rumen fluid and blood serum were pooled per animal and experimental period. The NH3-N concentration was quantified using a colorimetric technique(Reference Detmann, Souza and Valadares Filho28). In the VFA analysis, rumen fluid samples were pooled within day (2·0 ml per sample) and centrifuged (12 000 g for 10 min at 4°C). Supernatants were treated as described by Siegfried et al.(Reference Siegfried, Ruckemann and Stumpf32). Ruminal VFA were analysed by HPLC (Shimadzu HPLC class VP series, model SPD 10 A; Shimadzu Corporation) using a reverse phase column (mobile phase 0·15m ortho-phosphoric acid) and UV detector at a wavelength of 210 nm.
Urinary urea (colorimetric kinetic test, Bioclin® K056), urinary creatinine (enzymatic colorimetric method, Bioclin® K067) and urinary ammonia(Reference Detmann, Souza and Valadares Filho28) concentrations were quantified with an AutoAnalyzer (BS200E, Mindray). Total urinary N was obtained by the Kjeldahl procedure.
Blood serum samples were analysed for urea (enzymatic colorimetric method, Bioclin® K056), glucose (enzymatic glucose oxidase-peroxidase method, Bioclin® K082), creatinine (enzymatic-colorimetric method, Bioclin® K067), total protein (colorimetric kinetic test, Bioclin® K031), albumin (bromocresol green method, Bioclin® K040), aspartate transaminase (AST, U.V. kinetic – IFCC, Bioclin® K048) and alanine transaminase (ALT, U.V. kinetic – IFCC, Bioclin® K049). Serum 3-methylhistidine was analysed in a commercial laboratory (Hermes Pardini Laboratory, Belo Horizonte, MG). The concentration of serum globulin was estimated as the difference between the total protein and albumin concentrations.
The 15N enrichment in faecal, ruminal bacteria and abomasal samples was analysed using an isotope ratio mass spectrometer (IRMS, Thermo Finningan Delta Plus, Thermo Electron Corporation). Urinary urea and ammonia concentrations were quantified colorimetrically as described before. Measurements of 15N enrichment of urinary urea were conducted on N2 samples produced from Hoffman degradation of urinary urea by using techniques similar to those described by Wickersham et al.(Reference Wickersham, Titgemeyer and Cochran33), except (1) 250 µmol of urea urinary was pipetted into a column and (2) the procedures of column washing were conducted according to Archibeque et al.(Reference Archibeque, Burns and Huntington34). Samples were analysed for the proportions of [15N15N]-, [14N15N]- and [14N14N]-urea in urinary urea by IMRS (15N Analysis Laboratory, University of Illinois). Results were corrected for [14N15N]-N2 produced by non-monomolecular reactions(Reference Lobley, Bremner and Zuur35).
Rumen papillae analysis
The RNA was extracted from 50 mg of rumen papillae samples using Trizol® (Invitrogen TM, Thermo Fisher Scientific®) according to the manufacturer’s recommendations. The RNA concentration was estimated by NanoVue™ Plus spectrophotometer (GE Healthcare Life Science Inc.), and RNA integrity was evaluated through 1 % agarose gel electrophoresis. The RNA samples were then reverse transcribed into cDNA using the GoScriptTM Reverse Transcription System kit (Promega Corporation). The primers used in the present study were designed as described by Benedeti et al.(Reference Benedeti, Detmann and Mantovani36). The genes assessed were AQP 3, 7, 8 and 10 (AQP3, AQP7, AQP8 and AQP10) and solute carrier family 14 members 1 (SLC14A1) and 2 (SLC14A2). The 18S ribosomal RNA (18S; NR_036642·1) was used as the endogenous control gene. Real-time quantitative PCR reactions were performed in thermal cycler ABI Prism 7300 Sequence Detection System (Applied Biosystems) using the detection method hydrolysis probe (Kit TaqMan, Thermo Fisher Scientific) according to the following cycle parameters: 95°C for 2 min, forty cycles at 95°C for 15 s and 60°C for 60 s. Gene expression was calculated using the 2–ΔΔct method(Reference Livak and Schmittgen37).
Calculations
The abomasal flow was estimated using indigestible NDF as internal marker of the particle phase and Co-EDTA as external marker of the liquid phase. The indigestible NDF was assumed as an ideal marker of the solid phase, while Co-EDTA was assumed as non-ideal marker of liquid phase. The reconstitution factor of the abomasal digesta was calculated as stated by France & Siddons(Reference France and Siddons38).
Urea kinetics was calculated according to the methods described by Lobley et al.(Reference Lobley, Bremner and Zuur35). Bacterial and abomasal 15N enrichments were calculated as 15N/total N and were corrected for values in the background faecal samples(Reference Wickersham, Titgemeyer and Cochran19). The microbial N flow (MN) from recycled urea was calculated by multiplying microbial N flow by ratio of bacterial 15N enrichment to 15N enrichment of urinary urea (calculated as one-half the 14N15N-urea enrichment plus the 15N15N-urea enrichment).
The N balance was calculated by subtraction faecal and urinary N from N intake. Rumen N balance was calculated by subtracting N abomasal flow from N intake. Importantly, the urea infused into the abomasum was not considered in ruminal N balance calculation; rather, it was only used to calculate the amount of organic matter and CP digested in the intestines and GIT.
Statistical analyses
Statistical analyses were performed using the MCMCglmm package(Reference Hadfield39) of R software(40) according to a 5 × 5 Latin square design including the effects of treatment, animals and experimental period. All data from one animal were lost because of problems during the experiment, which cause a prominent decrease in statistical power. Facing this constraint, we opted for using Bayesian inference instead a classical frequentist approach, since prior distributions are widely used to supply information on missing experimental units(Reference Blasco41). In this context, the Latin square-based model was fitted under a Markov chain Monte Carlo Bayesian framework using normal prior distribution for each treatment effect, whereas inverse χ 2 distributions were used as prior for variance components associated to animal and period random effects. A total of 45 000 Markov chain Monte Carlo iterations were used in all analyses, assuming the ‘burn-in’ and ‘thin’ periods equal to 10 000 and two iterations, respectively. The Markov chain Monte Carlo convergence was evaluated via Geweke test(Reference Geweke42) implemented in ‘boa’ package of R software(Reference Smith43). The Markov chain Monte Carlo chains for differences between treatment means were obtained, and the statistical significance was accessed through 90 % credible intervals. Thus, if the interval contains the value zero, the difference between two treatments was declared non-significant. In order to simplify the notation related to significant differences, the term P < 0·10 was used here, where P means posterior probability.
Results
Intake and digestibility
Treatments did not influence (P > 0·10) voluntary intake, excepting the CP intake, which was greater (P < 0·10) when urea was supplied (Table 2).
Table 2. Voluntary intake in heifers fed a low-quality tropical forage and supplemented with urea in different sites of the gastrointestinal tract
(Mean values and standard deviations)
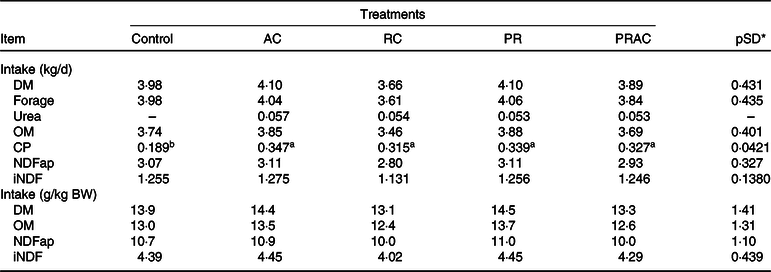
AC, abomasal continuous infusion; RC, ruminal continuous infusion; PR, ruminal pulse dose every 12 h; PRAC, half dose supplied as a pulse dose in the rumen every 12 h and half dose supplied through continuous abomasal infusion; OM, organic matter; CP, crude protein; NDFap, neutral-detergent fibre corrected for contaminant ash and protein; iNDF, indigestible neutral-detergent fibre.
a,b Unlike superscript letters indicate differences based on overlapping of 90 % credibility intervals.
* A posteriori standard deviation for the difference between two treatments means.
The amounts of organic matter (OM) and fibre digested in the rumen or in the entire GIT were not affected (P > 0·10) by the treatments (Table 3). Despite the supplementation form, the amount of CP digested in GIT was greater (P < 0·10) when urea was provided. The amount of CP digested in the rumen was increased (P < 0·10) by ruminal supplementation either continuously or as a pulse dose when compared with control or abomasal infusion. An intermediate pattern was observed when the urea dose was split between rumen and abomasum. The treatments did not alter (P > 0·10) the amount of fibre digested in the intestine. The amount of CP digested in the intestine increased (P < 0·10) as the amount of intestinal urea supplying increased. The OM digested in the intestine was greater (P < 0·10) for control and abomasal infusion and lower (P < 0·10) when urea was supplied by ruminal dose pulse. The remaining treatments exhibited an intermediate pattern. Overall, the dietary ratio of CP to digested OM (DOM) was improved (P < 0·10) when urea was supplemented. On average, CP:DOM was 164 g/kg for supplemented treatments compared with 72 g/kg observed in control.
Table 3. Amount of material digested in different sites in heifers fed a low-quality tropical forage and supplemented with urea in different sites of the gastrointestinal tract
(Mean values and standard deviations)
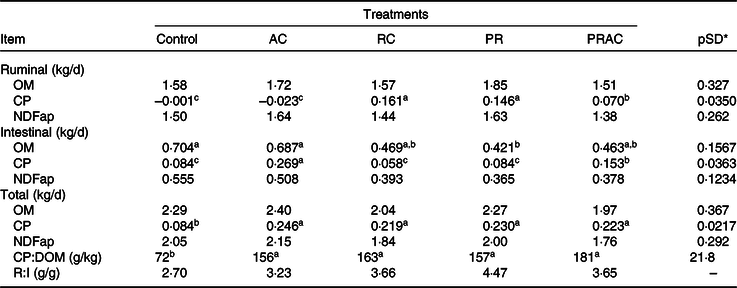
AC, abomasal continuous infusion; RC, ruminal continuous infusion; PR, ruminal pulse dose every 12 h; PRAC, half dose supplied as a pulse dose in the rumen every 12 h and half dose supplied through continuous abomasal infusion; OM, organic matter; CP, crude protein; NDFap, neutral-detergent fibre corrected for contaminant ash and protein; CP:DOM, dietary ratio of CP to digested OM; R:I, ratio of fibre digested in rumen to fibre digested in the intestines.
a,b,c Unlike superscript letters indicate differences based on overlapping of 90 % credibility intervals.
* A posteriori standard deviation for the difference between two treatments means.
Ruminal fermentation
There was a treatment effect on rumen pH. When urea was totally supplied in the abomasum, the rumen pH was lower (P < 0·10) compared with the other treatments (Table 4). The NH3-N concentration was higher (P < 0·10) when urea was totally or partially supplied in the rumen. No treatment effect was detected (P > 0·10) on VFA concentration nor on their molar proportion.
Table 4. Ruminal fermentation characteristics in heifers fed a low-quality tropical forage and supplemented with urea in different sites of the gastrointestinal tract
(Mean values and standard deviations)
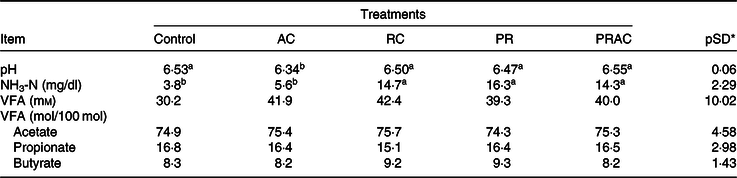
AC, abomasal continuous infusion; RC, ruminal continuous infusion; PR, ruminal pulse dose every 12 h; PRAC, half dose supplied as a pulse dose in the rumen every 12 h and half dose supplied through continuous abomasal infusion; NH3-N, rumen ammonia N; VFA, volatile fatty acids
a,b Unlike superscript letters indicate differences based on overlapping of 90 % credibility intervals.
* A posteriori standard deviation for the difference between two treatments means.
Nitrogen metabolism
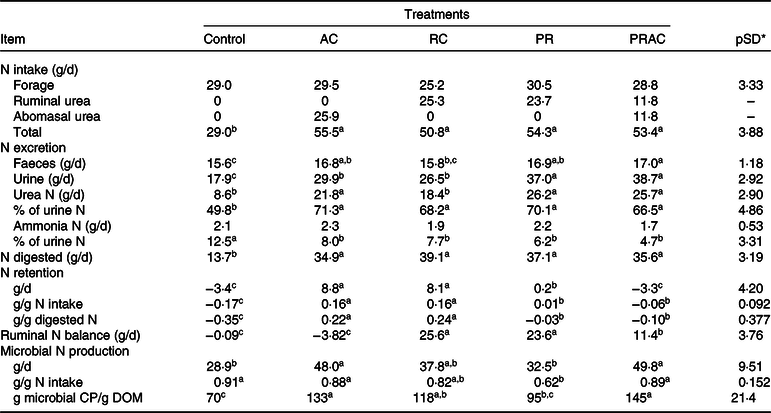
The amount of N consumed and digested in GIT behaved as previously presented for CP intake and digestion (Table 5). The control exhibited the lowest (P < 0·10) faecal and urinary N losses, which were, overall, increased by supplementation. Faecal N was greatest (P < 0·10) when supplemental urea was split between rumen and abomasum. On the other hand, the highest urinary N losses (P < 0·10) were observed when urea was either totally or partially supplied as a ruminal pulse dose. The proportion of urea-N in total urinary N increased (P < 0·10), whereas the proportion of ammonia-N in urine decreased (P < 0·10) with supplementation, without differences (P > 0·10) amongst supplementation forms. N accretion was improved (P < 0·10) by supplementation when compared with the control, being the highest (P < 0·10) when urea was continuously provided either in rumen or abomasum.
Table 5. Characteristics of nitrogen utilisation in heifers fed a low-quality tropical forage and supplemented with urea in different sites of the gastrointestinal tract
(Mean values and standard deviations)
AC, abomasal continuous infusion; RC, ruminal continuous infusion; PR, ruminal pulse dose every 12 h; PRAC, half dose supplied as a pulse dose in the rumen every 12 h and half dose supplied through continuous abomasal infusion; CP, crude protein; DOM, digested organic matter.
a,b,c Unlike superscript letters indicate differences based on overlapping of 90 % credibility intervals.
* A posteriori standard deviation for the difference between two treatments means.
Rumen N balance was negative for the control and when urea was totally supplied in the abomasum. An improvement on this variable was obtained (P < 0·10) when half of the supplemental urea was delivered in the rumen, which become even higher (P < 0·10) when urea was totally supplied in the rumen either continuously or as a pulse dose. The greatest microbial N production (P < 0·10) was obtained when urea was partially or totally supplied in the abomasum. For this variable, the lowest values (P < 0·10) were observed for the control and when urea was totally supplied as a ruminal pulse dose. The continuous delivery of urea in the rumen behaved intermediately. Moreover, the highest efficiency of microbial production (EFM) was observed (P < 0·10) when urea was partially or totally supplied in the abomasum, and the lowest efficiency of microbial production (P < 0·10) occurred for the control. The other treatments exhibited an intermediate pattern.
Urea kinetics and nitrogen recycling
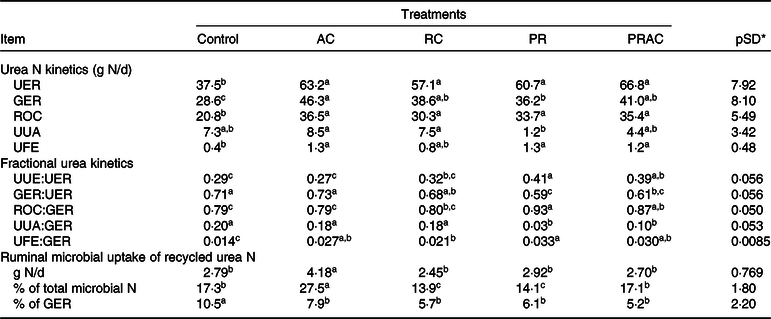
In terms of absolute values (g/d), the urea-N synthesised in liver (urea N entry rate, UER) was increased (P < 0·10) by supplemental urea regardless of the supplementation form (Table 6). The amount of urea-N recycled to the GIT (GIT entry rate, GER) was increased (P < 0·10) by providing urea, but differently among treatments. The greatest GER (P < 0·10) was obtained by continuous urea infusion in the abomasum, whereas the pulse dose supplementation caused an intermediary GER between control and abomasal infusion. The other treatments placed between abomasal infusion and pulse dose. On the other hand, the amount of urea-N returned to the ornithine cycle (ROC) was increased (P < 0·10) by supplemental urea and did not differ (P > 0·10) amongst supplementation forms. The greatest (P < 0·10) amounts of urea-N used for anabolism (UUA) were observed when urea was totally and continuously infused, regardless of the supplementation site. The lowest UUA (P < 0·10) was verified when urea was totally supplied as a pulse dose in the rumen. Overall, urea supplementation increased (P < 0·10) faecal excretion of urea-N from urea synthesised in the liver.
Table 6. Urea kinetics and microbial assimilation of recycled urea nitrogen in heifers fed a low-quality tropical forage and supplemented with urea in different sites of the gastrointestinal tract
(Mean values and standard deviations)
AC, abomasal continuous infusion; RC, ruminal continuous infusion; PR, ruminal pulse dose every 12 h; PRAC, half dose supplied as a pulse dose in the rumen every 12 h and half dose supplied through continuous abomasal infusion; UER, urea N entry rate; GER, gastrointestinal tract entry rate; ROC, urea N returned to the ornithine cycle; UUA, urea N utilised for anabolism; UFE, urea N excreted in faeces; UUE, urinary N urea excretion (Table 4).
a,b,c Unlike superscript letters indicate differences based on overlapping of 90 % credibility intervals.
* A posteriori standard deviation for the difference between two treatments means.
Considering urea kinetics in terms of fractional rates (g/g), we observed that the total or partial urea supplementation as a ruminal pulse dose increased (P < 0·10) the proportion of urea-N synthesised in liver that was lost in urine (UUE:UER) compared with the control (Table 6). The continuous infusion in the abomasum propitiated urinary losses similar to those observed for the control (P > 0·10), whereas ruminal continuous infusion caused intermediate values. In general, the greatest (P < 0·10) proportion of hepatic urea-N recycled to the GIT (GER:UER) was obtained for the control and with total abomasal infusion. The partial or total urea supplementation as a ruminal pulse dose decreased (P < 0·10) the proportion of urea-N recycled to the GIT. The continuous infusion of urea in the rumen resulted in intermediate responses. The greatest proportion (P < 0·10) of GER used for anabolism (UUA:GER) (e.g. recycled N available for microbial production) was observed for the control and when urea was totally and continuously infused in the rumen or abomasum. In this case, providing urea totally of partially as a ruminal pulse dose decreased (P < 0·10) its availability for anabolic purposes. In spite of some small oscillations among supplementation forms, providing urea increased (P < 0·10) the proportion of GER that was lost in faeces (UFE:GER). As a reflex of UFE and UUA pattern, the greatest (P < 0·10) proportions of GER that returned to the ornithine cycle (ROC:GER) were obtained when urea was totally or partially provided through ruminal pulse dose. The lowest proportions (P < 0·10) were obtained for the control and total abomasal infusion. Intermediate values were obtained for ruminal continuous infusion.
The continuous abomasal infusion of urea resulted in the highest (P < 0·10) assimilation of microbial N from recycling (g/d), whereas the other treatments did not differ (P > 0·10) to each other (Table 6). The highest proportion of microbial N coming from recycling (P < 0·10) was also observed when urea was continuously infused in the abomasum, being followed by control and split infusion, and ruminal both supplementations (continuous and pulse dose), which produced the lowest proportions (P < 0·10). The evaluation of microbial N assimilation as a fraction of total recycled N (GER) indicated the highest dependency on recycling for the control (P < 0·10), while the supplemented treatments did not differ to each other (P > 0·10).
Serum characteristics and liver function
The different treatments did not influence (P > 0·10) serum glucose, total protein, albumin nor globulins (Table 7). Serum urea N was higher (P < 0·10) and serum 3MH was lower (P < 0·10) when supplemental urea was provided compared with the control, regardless of the supplementation form.
Table 7. Serum characteristics and liver function in heifers fed a low-quality tropical forage and supplemented with urea in different sites of the gastrointestinal tract
(Mean values and standard deviations)

AC, abomasal continuous infusion; RC, ruminal continuous infusion; PR, ruminal pulse dose every 12 h; PRAC, half dose supplied as a pulse dose in the rumen every 12 h and half dose supplied through continuous abomasal infusion; 3MH, 3-methylhistidine; AST, aspartate aminotransferase; ALT, alanine aminotransferase.
a,b Unlike superscript letters indicate differences based on overlapping of 90 % credibility intervals.
* A posteriori standard deviation for the difference between two treatments means.
Serum AST was higher (P < 0·10) when urea was totally supplied as a ruminal pulse dose compared with the control (Table 7). The remaining treatment behaved in an intermediate way. Serum ALT was greatest (P < 0·10) when urea was totally supplied as a ruminal pulse dose.
Gene expression
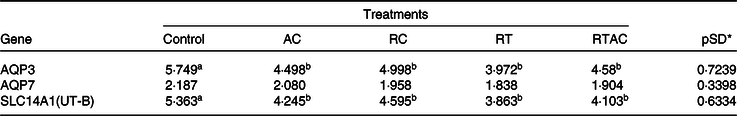
We did not detect any gene expression for aquaporin 8, aquaporin 10 and urea transport protein UT-A (SLC14A2) in the rumen epithelium. Moreover, there was no treatment effect (P > 0·10) on the gene expression for aquaporin 7. The genes associated with aquaporin 3 (AQP3) and urea transport protein UT-B (SLC14A1) were more expressed (P < 0·10) in the control compared with the supplemented treatments, which did not differ (P > 0·10) to each other (Table 8).
Table 8. Gene expression of aquaporins and urea transporters in rumen epithelium of heifers fed a low-quality tropical forage and supplemented with urea in different sites of the gastrointestinal tract
(Mean values and standard deviations)
AC, abomasal continuous infusion; RC, ruminal continuous infusion; PR, ruminal pulse dose every 12 h; PRAC, half dose supplied as a pulse dose in the rumen every 12 h and half dose supplied through continuous abomasal infusion.
a,b Unlike superscript letters indicate differences based on overlapping of 90 % credibility intervals.
* A posteriori standard deviation for the difference between two treatments means.
Discussion
Overall, the supplements did not affect the voluntary intake of forage. Generally, it is assumed that ruminal N availability is the main limitation to intake and fibre degradation of low-quality forages(Reference Egan and Doyle44,Reference Detmann, Paulino and Mantovani45) . However, several authors have found no effects of supplemental N on voluntary intake in cattle fed low-quality tropical forages(Reference Batista, Detmann and Gomes16,Reference Rufino, Detmann and Gomes46,Reference Franco, Detmann and Valadares Filho47) . The control of voluntary intake in ruminants cannot be explained by a single factor as its control is multifactorial(Reference Forbes48). The protein:energy ratio in the total diet seems a more valuable indicator of the supplementation influence on forage intake, as it integrates the supplemental effects on both rumen and metabolism(Reference Detmann, Valente and Batista3,Reference Poppi and McLennan49) . Voluntary intake of tropical forages would be maximised when the CP:DOM of the diet is raised to about 210 g/kg by supplementation(Reference Reis, Detmann and Batista50). In this experiment, the CP:DOM in the basal forage was 72 g/kg and was increased, on average, up to 164 g/kg by supplementation, being very lower than the ratio expected to optimise forage intake.
The total protein digestion was improved by N supplementation. This pattern should be expected as the apparent digestibility of a non-fibrous compound is positively associated with its intake, which causes a dilution of the metabolic faecal fraction(Reference Van Soest10). This is in line with the digestibility pattern of CP in both rumen and post rumen, which also increased when urea was supplied at those compartments.
Amid all digestibility measurements, there was an oscillating pattern for the intestinal OM digestibility among treatments, which cannot be solely explained by the post-rumen N infusion. At first glance, the intestinal fibre digestibility could not help for any explanation here because the amount of fibre digested in the intestine did not vary among treatments. However, the ratio of fibre digested in the rumen to the fibre digested in the intestine was quite different between control (2·70) and supplemented animals (3·75 on average, Table 3). This pattern brings into evidence two facts. First, the supplementation increased the proportion of fibre digested in the rumen despite the absence of difference amongst treatments concerning the amount of ruminal digested NDF. Such effects seemed almost homogenous for all supplementation forms. Therefore, a rumen N deficiency did occur in non-supplemented animals and constrained ruminal fibre digestion. Second, any constraint to rumen degradation may imply an increased intestinal fibre digestion(Reference Dixon and Stockdale51). The main explanation for that relies on a greater escape of potentially digestible NDF from rumen to the hindgut. Thus, the control exhibited greater intestine fibre digestion due to constraints on rumen digestion. A differential escape of potentially digestible NDF among treatments may be responsible, at least in part, for the oscillating intestinal digestion of OM of supplemented animals.
Despite the unclear effects of the supplemental N on intake and digestibility, we can conclude that the rumen of non-supplemented animals did work suboptimally under N deficiency. Such statement is supported by the negative N balance in the rumen, the limited microbial growth and the increased expression of auxiliary mechanisms of urea carriage within rumen epithelium in the control. Even though urea can be passively carried through rumen wall, an improvement in auxiliary transportation mechanisms, such as UT-B, would provide an increased N supply for rumen bacterial growth(Reference Simmons, Chaudhry and Graham52) by optimising ruminal urea inflow. Thus, considering the low serum urea availability in the control, the increased expression of UT-B and AQP3 constitutes an attempt by the animals to sustain a continuous microbial growth on the N-deficient basal substrate.
In agreement with several reports from the tropics(Reference Batista, Detmann and Gomes13,Reference Rufino, Detmann and Gomes46,Reference Franco, Detmann and Valadares Filho47,Reference Rufino, Batista and Rodrigues53) , the impacts of N supplementation were more prominent on metabolic characteristics than on intake and digestibility. The metabolic action of supplemental N encompasses two different effects, which may or not occur simultaneously: an improvement in anabolism and a decrease in catabolism(Reference Detmann, Batista and Silva54). The anti-catabolic effect of supplemental N occurred similarly for all supplementation forms, as demonstrated by the decrease in the serum 3MH:creatinine ratio. The 3MH is an amino acid formed from methylation of histidine after its inclusion in the muscle proteins. When muscle proteins are degraded, the 3MH cannot be reused for protein synthesis and is excreted in the urine(Reference Waterlow55). The greatest serum 3MH in the control indicates a greater muscle catabolism, as an attempt to mobilise N for an additional rumen supply(Reference Batista, Detmann and Gomes16,Reference Rufino, Detmann and Gomes46) , which, in turn, may compromise the overall efficiency of N utilisation in the animal body(Reference Detmann, Batista and Silva54).
On the other hand, the anabolic effects of the supplemental N were not equal among supplementation forms, as there were differences in N accretion and efficiency of N utilisation. These specific measurements provide a holistic view of animal efficiency, as N accretion is dependent on both energy and protein metabolism(Reference Detmann, Batista and Silva54) and is directly associated with animal performance. As indicated by catabolic aspects, the control had a negative N balance as a result of the dietary N deficiency. However, when supplements were provided, N accretion was greater for continuous infusion compared with total or partial ruminal urea supply through a pulse dose, despite the supplemented treatments that have shown similar effects limiting muscle catabolism.
The present study aimed to investigate the effects of NPN supplementation excluding the influences of other compounds, such as carbohydrates or true protein. Interactions between supplemental N and carbohydrates do exist on N accretion and microbial assimilation(Reference Franco, Detmann and Valadares Filho47,Reference Souza, Detmann and Paulino56,Reference Lazzarini, Detmann and Valadares Filho57) . However, the present study fundamentally aimed to understand the dynamics of NPN supplied at different sites of GIT.
In this light, we conclude that when urea was supplied entirely by continuous infusion in either rumen or abomasum, a greater and more consistent N accretion was achieved. Compared with the pulse-dose treatments, the continuous infusion resulted in a lower urinary loss of N, which was, at least partially, responsible for a greater N accretion. A greater N loss would decrease the availability of metabolisable N for anabolic purposes, as it was somehow indicated by UUA pattern.
When urea was supplied totally or partially as ruminal pulse dose, the pattern of NH3-N throughout time after feeding was less stable than the patterns obtained with continuous infusion (Fig. 1), resulting in peaks between 2 and 4 h after supplementation. Similar patterns were also detected in the study by Carvalho et al.(Reference Carvalho, Doelman and Martín-Tereso15). The transfer of ammonia excess from portal drained viscera to the blood is proportional to the ammonia concentration in the rumen fluid(Reference Kennedy and Milligan6,Reference Abdoun, Stumpff and Martens58) . Moreover, when cattle are fed low-quality forages, the NH3-N accumulation becomes more prominent when concentrations exceed 10–12 mg/dl(Reference Detmann, Valente and Batista3,Reference Detmann, Paulino and Mantovani45) , which seems associated with a limitation in the energy supply for microbial N uptake. Therefore, the excessive ammonia represented by the peaks after feeding was transferred to the blood; however, its return to the rumen as urea was compromised, which is suggested by the increased urinary N loss and the higher UUE:UER ratio.

Fig. 1. Average concentrations of rumen ammonia nitrogen (NH3-N) according to the time after morning feeding in heifers fed a low-quality tropical forage and supplemented with urea in different sites of the gastrointestinal tract (AC, abomasal continuous infusion; RC, ruminal continuous infusion; PR, ruminal pulse dose every 12 h; PRAC, half dose supplied as a pulse dose in the rumen every 12 h and half dose supplied through continuous abomasal infusion). ![]() , Control;
, Control; ![]() , AC;
, AC; ![]() , RC;
, RC; ![]() , PR;
, PR; ![]() , PRAC.
, PRAC.
The ruminal pulse-dose treatment aimed to simulate feed grade urea supplementation in a low-intake supplement. However, this type of urea releasing proved to be inefficient in terms of anabolism and to even be detrimental to the animals, as indicated by an increased AST and ALT serum activities. The ALT and AST are important for transferring of amino groups to α-ketoglutarate and producing glutamate, which, in turn, can serve as amino-group donor for hepatic urea synthesis(Reference Nelson and Cox59). Normally, the serum activity of both enzymes is extremely low as compared with their liver activity(Reference Pantegini, Bais, Burtis, Ashwood and Bruns60). Therefore, their increased serum activity may indicate a degree of liver injury(Reference Giannini, Testa and Savarino61) that took place with this treatment. Likely, a hepatic overload of ammonia led to hepatocyte damages and released more AST and ALT into bloodstream. A similar pattern was detected by Palma(Reference Palma62), who observed an increased serum ALT when cattle fed tropical forage received a high-urea supplement.
Overall, the continuous delivery of supplemental N either in rumen or abomasum has the greatest effect on improving N accretion and utilisation efficiency. However, continuous delivery of N in the rumen intends to represent a theoretical procedure and must be seen here as a ‘positive control’ compared with the other supplemented treatments. Current technologies applied for delaying urea hydrolysis in the rumen either propitiate similar ammonia concentrations(Reference Mahmoudi-Abyane, Alipour and Moghimi63) or are only able to create a lag for ammonia release(Reference Joysowal, Tyagi and Tyagi64) compared with regular feed-grade urea. Therefore, those technologies, as used nowadays, cannot confer a ruminal releasing close to a steady-state condition. On the other hand, any technology capable to propitiate a complete protection of the urea particles from ruminal degradation, but being soluble or hydrolysable either in the abomasum acid or in the intestinal alkali, would be able to promote a steady-state release of urea in the intestine. Such abomasal delivery pattern derives from the liquid rate of passage from rumen to the intestine, which tends to be rather constant throughout the day.
Despite resulting in equal N accretion and efficiency of utilisation, the continuous infusions in rumen and abomasum presented some remarkable differences in terms of N metabolism. Even though being statistically similar to each other, the microbial N production and efficiency were slightly superior when urea was continuously provided in the abomasum. Moreover, the efficiency of microbial N uptake from recycling was remarkably higher with the abomasal supplementation. That improved microbial production can imply a greater metabolisable protein supply from bacterial protein, which, in turn, may support the better N accretion compared with the control. In this sense, the enhanced microbial production in the rumen obtained by abomasal infusion is a direct consequence of recycling.
Several reports have brought into evidence that supplying N in either the abomasum or the duodenum increases the amount of N recycled to the rumen(Reference Egan9,Reference Batista, Detmann and Gomes16,Reference Egan65) . Indirect evidences of greater recycling with abomasal supplementation can be obtained by evaluating the rumen N balance and NH3-N concentration in comparison with the control. The ruminal N balance became more negative, showing that rumen N output was greater compared with N intake and recycling is the potential explanation, as reported by Batista et al.(Reference Batista, Detmann and Gomes13) and Rufino et al.(Reference Rufino, Detmann and Gomes46). This is also directly illustrated by the higher GER obtained with the abomasal infusion. Despite resulting in the same NH3-N concentration as compared with the control, the greater microbial N production indicates that ruminal ammonia availability did increase with abomasum supplementation. However, the delivery of N through recycling presents a delay compared with the rumen supplementation(Reference Joysowal, Tyagi and Tyagi64) as the hepatic pathways intermediate its return to the rumen. It caused the N delivery slower and approximately constant along the day (Fig. 1). Considering that substrate has a limited energy supply, this slow ammonia supply seemed allowing microorganisms work on a more coupled way. In other words, the slow energy extraction coupled with a slow N delivery conferred a greater and more efficient microbial synthesis. Additionally, the higher ammonia concentration obtained with continuous ruminal infusion can decrease urea-N transfer rate from blood across rumen epithelium(Reference Kennedy and Milligan6), as supported by its slightly lower GER and GER:UER, and microbial uptake of recycled N when compared with continuous abomasal infusion.
It important to note that total continuous abomasal infusion caused a decrease in rumen pH compared with the other treatments. This is indicative of the grater microbial growth obtained with this supplementation form. Despite presenting a similar microbial N production, the split supplementation was not able to decrease rumen pH, a direct effect of the buffering capacity caused by ruminal urea delivery. The lower pH obtained with complete infusion of urea in the abomasum can be positive to keep a more adequate N supply for microbial growth in the rumen. A lower pH decreases the permeability of the rumen epithelium to ammonia(Reference Abdoun, Stumpff and Martens58), then avoiding an excessive ammonia transfer to the bloodstream. Moreover, a decrease in rumen pH down to 6·2 optimises urea transportation from blood to rumen(Reference Lu, Stumpff and Deiner66), which seems a very interesting effect when a low-quality quality forage is fed to ruminant animals. Therefore, such a pattern brings into evidence other positive mechanism associated with post-ruminal urea supplementation.
On the other hand, the continuous supplementation in the rumen caused a slightly lower microbial production compared with abomasal infusion. This is counterintuitive as NH3-N was increased by rumen N infusion. However, the NH3-N pattern after feeding highlights an interesting difference compared with the other treatments. When urea was completely delivered in a continuous way in the rumen, there was a peak of NH3-N, but this one took place latter compared with pulse-dose treatments (Fig. 1). At first glance, a NH3-N peak should not be expected in a continuous infusion system. However, the releasing of ammonia from urea can behave faster for dietary urea compared with recycled urea. Therefore, even though being both continuous delivering ways, the ruminal infusion is able to increase ruminal ammonia pool faster compared with abomasal infusion, as previously discussed. Considering the low availability of energy in the basal substrate, there would be a break point in time where energy and N availability will be no longer coupled, causing the accumulation of the compounds with greater availability, the N in this case. This pattern is supported by the latter ammonia peak observed with ruminal continuous infusion of urea.
Consequently, the ruminal continuous infusion should have conferred a lower supply of metabolisable protein from microorganism compared with abomasal infusion. However, both supplementations forms gave the same N accretion and efficiency of N utilisation. There are two likely explanations for this observation. First, the continuous ruminal infusion allowed keeping the urinary N losses lower compared with pulse-dose treatments, being similar to the continuous abomasal infusion. Despite presenting a later NH3-N peak, the NH3-N profile along time was more stable compared with pulse dose treatments (Fig. 1), then supporting the lower urinary N loss obtained with continuous ruminal infusion.
Second, compared with abomasal infusion, the ruminal continuous infusion propitiated a slightly lower amount of N recycled to GIT. However, the improved N availability for metabolism (e.g. blood urea) coupled with the lower urinary losses may have alter the N status in the animal body. In theoretical terms, the expression ‘N status’ defines the quantitative and qualitative availability of N compounds for different physiological functions in animal metabolism, including functions associated with the metabolism of other compounds, such as energy(Reference Detmann, Valente and Batista3). When N status is improved, the metabolism can achieved a better adjustment. In other words, molecules of NPN can be direct towards other metabolic pathways, such as the urea cycle. Thus, amino acids utilisation for those pathways will decrease, which, in turn, improves the availability of metabolic precursors for protein synthesis(Reference Detmann, Valente and Batista3,Reference Detmann, Batista and Silva54,Reference Reis67) .
The treatment in which the urea dose was split into rumen and abomasum aimed to simulate the N supply of a low-intake supplement with a partial replacement of feed-grade urea by a urea form able to avoid rumen degradation. The partial urea infusion into abomasum resulted in a microbial growth similar to that one observed with total infusion of urea into abomasum. However, the partial pulse dose into the rumen increased the urinary N losses and, as consequence, N with anabolic potential was lost. For some key variables, this treatment behaved intermediately between total urea as a rumen pulse dose and total infusion into abomasum (e.g. GER, UUA, rumen N balance, fraction of microbial N from recycling). However, unexpectedly, there was no improvement in N accretion compared with the control. To our knowledge, a likely explanation for this result could not be taken drawn from this experiment. We hypothesise that some negative interactions could exist between two forms of supplementation, but that subject deserves further research.
Conclusions
The continuous supply of urea throughout the day either in the rumen or abomasum is able to improve N accretion, despite the mechanism responsible for that be different for the ruminal and abomasal supply. The supply of urea as a pulse dose in the rumen is not able to confer the same benefits because of the greater urinary N loss. Current technologies for delaying urea release in the rumen are not totally effective in terms of achieving a steady-state condition. Therefore, the protection of urea aiming to its releasing into a post-rumen compartment seems a promising technology that may improve the N utilisation from a non-edible N source.
Acknowledgements
The authors would like to thank CNPq, CAPES, FAPEMIG and INCT Ciência Animal for financial support and scholarships. The authors also recognise the financial and technical support from Trouw Nutrition, which made this experiment possible.
C. V. R. O. performed the experiment and wrote the original draft. T. E. S. performed the experiment and reviewed the manuscript. E. D. B. performed analyses and reviewed the manuscript. L. N. R. performed the experiment and reviewed the manuscript. F. F. S. performed the formal analysis and reviewed the manuscript. I. P. C. C. reviewed the manuscript. J. M.-T. conceived the experiment and reviewed the manuscript. E. D. wrote the manuscript, conceived the experiment, performed the formal analysis, coordinated the funding acquisition and supervised and administrated the project.
The authors declare that there are no conflicts of interest.


