

The authors apologise for an error in the 3rd paragraph of the discussion section: when converting kcal to kJ, rather than multiplying the kcal by 4.1858, the values were instead divided. Consequently, some changes should be made in the text and in Table 2, as noted below.
Original text:
On the other hand, our results of mean TWI per kg of body weight were close to those reported on water turnover by Fusch et al. in 1993 in the same age groups(3). Three-quarters of the infants and most toddlers had a TWI/energy ratio below the AI set for their age(5), but overall our results were higher than those reported in Mexico(23). This in line with the high energy densities of the diets we reported previously as increasing with age and the introduction of solid foods, on average from 64 to 85 kcal/100g and even over 100 kcal/g in more than 10% of children older than 18 months (44). The gradual increase of non-adherence to the AI after six months of age was linked to the increasingly significant share of solid food with age. The decreasing consumption of formula or milk was not compensated for by the drinking of water. The reported median age for the introduction of solid food in the study sample was 4.9 (3.9–5.9) months(44).
Revised text (changes in bold):
On the other hand, our results of mean TWI per kg of body weight were close to those reported on water turnover by Fusch et al. in 1993 in the same age groups(3). Three-quarters of the infants and most toddlers had a TWI/energy ratio below the AI set for their age(5), but overall our results were higher than those reported in Mexico(23). This in line with the high energy densities of the diets we reported previously as increasing with age and the introduction of solid foods, on average from 2679 to 3558 kJ/100 g (64 to 85 kcal/100g) and even over 4186 kJ/g (100 kcal/100g) in more than 10 % of children older than 18 months(44). The gradual increase of non-adherence to the AI after 6 months of age was linked to the increasingly significant share of solid food with age. The decreasing consumption of formula or milk was not compensated for by the drinking of water. The reported median age for the introduction of solid food in the study sample was 4·9 (Q1–Q3: 3·9–5·9) months(44).
Original Table 2:
Table 2. Population characteristics and reported daily dietary intakes of energy, protein, and sodium (n = 1,035)(43–45). Body weights are given as mean ± SD. Intakes are given as median values with interquartile range (Q1-Q3) in brackets and compared to the highest values of the corresponding EFSA dietary references (DRVs).

a : According to age, boys were on average slightly heavier than girls (NS); b: Average Requirements; c: Population Reference Intake; d: Adequate Intake
Revised Table 2 (changes in bold):
Table 2. Population characteristics and reported daily dietary intakes of energy, protein and Na (n = 1035)(43–45). Body weights are given as mean values and standard deviations. Intakes are given as median values with interquartile range (Q1–Q3) and compared with the highest values of the corresponding EFSA dietary references (DRV)
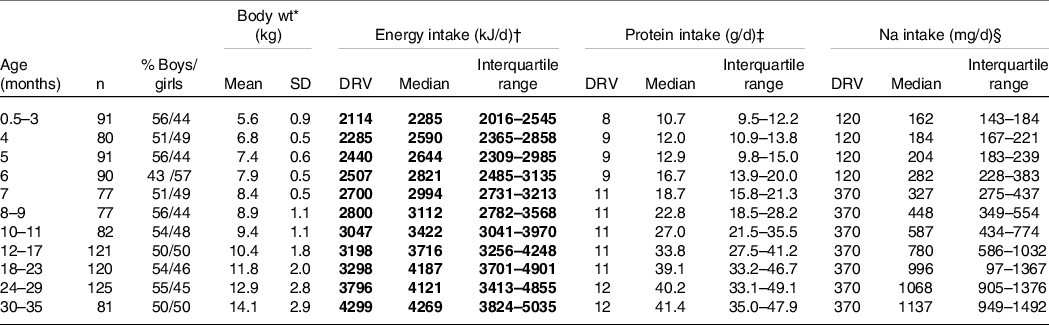
* According to age, boys were on average slightly heavier than girls (NS).
† Average requirements.
‡ Population reference intake.
§ Adequate intake.


