


The population of adults 80+ years is the fastest growing age group worldwide resulting in an ageing population(Reference Lunenfeld and Stratton1). This demographic transition increases the importance of effective preventive strategies to promote healthy independent ageing(Reference Lunenfeld and Stratton1). Poor nutrition is considered one of the important risks, and low intake of dietary protein is associated with accelerated loss of lean mass(Reference Houston, Nicklas and Ding2), mobility limitations(Reference Houston, Tooze and Garcia3) and greater incidence of frailty(Reference Mendonca, Granic and Hill4) and disability(Reference Mendonça, Kingston and Granic5) in community-dwelling older adults. According to the guidelines from the European Society for Clinical Nutrition and Metabolism, ESPEN, healthy older adults are recommended a minimum intake of 1·0 g dietary protein/kg body weight per d for optimal preservation of lean mass, function and health(Reference Volkert, Beck and Cederholm6,Reference Deutz, Bauer and Barazzoni7) . In a recent systematic review, the prevalence of community-dwelling older adults (mean age ≥ 65 years) with a low protein intake (defined as <1·0 g protein/kg per d) was summarised to 23 and 27 % in women and men, respectively(Reference Ter Borg, Verlaan and Mijnarends8). In these numbers, there is only a minimum representation of self-reliant community-dwelling adults 80+ years; hence, not much knowledge on this age group exists.
Several physiological, psychological and social factors have shown to affect the diet in the older age and to challenge the optimal intake of protein. Reduced appetite, often referred to as anorexia of ageing, is a geriatric syndrome determined by physiological changes such as hormonal alterations, gastrointestinal motility and multimorbidity(Reference Landi, Calvani and Tosato9). Additionally, psychological and social determinants such as grief, depression and reduced desirability to eat while living alone have been suggested to affect appetite(Reference Landi, Calvani and Tosato9). Reduced appetite is associated with low intake of protein in community-dwelling adults aged 65–79 years(Reference Hung, Wijnhoven and Visser10,Reference van der Meij, Wijnhoven and Lee11) . Also, it has been considered a risk factor for overall malnutrition (identified by weight loss, low BMI or a low nutritional screening score) in different health care settings (e.g. rehabilitation and nursing homes)(Reference O’Keeffe, Kelly and O’Herlihy12). Dysphagia, dental status, mouth dryness, nausea, constipation and pain have furthermore been suggested as potentially modifiable risk factors for malnutrition, despite strong evidence is still lacking(Reference O’Keeffe, Kelly and O’Herlihy12). However, it is unclear if these potentially modifiable risk factors for malnutrition in older adults from various settings (community-dwelling, rehabilitation, nursing home and acute care) may also contribute to low protein intake in self-reliant community-dwelling adults 80+ years.
Dietary patterns have also been associated with risk of low protein intake. Irregularly eating breakfast was earlier associated with daily low protein intake in home-bound older adults (age 61–98 years)(Reference Sharkey, Branch and Zohoori13). Additionally, a study in +85-year-old community-dwelling adults found that breakfast contributed more to total daily protein intake in participants with a low protein intake (<0·8 g/kg per d) compared with participants with an adequate intake of protein(Reference Mendonça, Granic and Mathers14). An uneven distribution of protein intake (greater CV) was a characteristic in frail compared with non-frail and pre-frail older adults (75–96 years), even with sufficient protein intake(Reference Bollwein, Diekmann and Kaiser15). Studies suggest that maximal muscle protein synthesis in older adults is reached with a minimum of 0·4 g protein/kg per serving(Reference Moore, Churchward-Venne and Witard16). Nevertheless, reaching such threshold on each main meal may be difficult. This was recently demonstrated in healthy community-dwelling adults aged 75–85 years where the daily number of meals meeting this threshold varied from 0·43 to 1·0(Reference Gingrich, Rennekamp and Brandl17). Hence, evidence suggests that dietary patterns are important for achieving optimal daily protein intake, but knowledge on the oldest old is limited.
In summary, knowledge about the prevalence of low protein intake and modifiable risk factors affecting optimal intake of protein in self-reliant community-dwelling adults aged 80+ years is still limited. Obtaining a greater knowledge about protein, dietary patterns and risk factors is important to optimise preventive strategies targeted very old adults.
The primary objectives of this study were to investigate the prevalence of low protein intake and to describe dietary patterns associated with low protein intake in self-reliant community-dwelling adults aged 80+ years. Secondary objectives were to use exploratory analyses to describe key modifiable risk factors associated with low protein intake.
Methods
Design, recruitment procedure and ethical statement
The current study has a cross-sectional design and was conducted in the Municipality of Odense, Denmark. Participants were recruited through an existing cohort of community-dwelling older adults (the Healthy Aging Network of Competence in Southern Denmark – Northern Schleswig-Holstein, HANC-study(Reference Kendall, Boyle and Hartvigsen18)). The purpose of the HANC-study was to optimise primary prevention strategies by incorporating objective and self-reported assessments to identify older adults at risk of functional decline. Participants enrolled in the HANC-Cohort were self-reliant community-dwelling older adults. From January 2017 to August 2018, participants from the HANC-cohort were invited to participate in a follow-up. In addition to the regular follow-up visit, eligible participants were invited to participate in the ‘I’m still standing, study 1’, which aimed to characterise self-reliant community-dwelling adults aged 80+ years in terms of nutritional intake, physical function and health. Participants were first contacted by phone and received written and oral information about the study before home visit. The ‘I’m still standing study 1’ was conducted according to the guidelines laid down in the Declaration of Helsinki, and all procedures involving participants were approved by the regional ethical committee (Project-ID: S-20170105) and by the Danish Data Protection Agency (reg. no. 18/12126). Written informed consent was obtained from all participants.
Inclusion criteria
Inclusion criteria were: (i) ≥80 years old community-dwelling adults, living in the municipality of Odense; (ii) not reliant on in-home services (personal care and practical assistance); (iii) intact cognitive function evaluated by a score ≥3 in the short form of the Mini-Mental State Examination(Reference Callahan, Unverzagt and Hui19) and (iv) willing and able to fill out a 4-d food record.
Data collection
Data collection was carried out during two home visits by trained research assistants from the University of Southern Denmark. A set of self-reported questionnaires (e.g. the brief pain inventory) were completed by each participant between the two home visits.
Descriptive characteristics
Age, sex, living status and number of diseases diagnosed by a medical doctor from a list of seventeen medical conditions (blood clots, hypertension, osteoarthrosis, osteoporosis, asthma, chronic obstructive pulmonary disease, heart failure, myocardial infarct, diabetes, kidney disease or reduced kidney function, reduced sight, reduced hearing, changes in back or spine, chronic pains, depression, anxiety and overweight) were asked during the first home visit. Height was measured standing up against a wall without shoes. Body weight was measured on a calibrated transportable scale (Tanita BC 420 SMA) with 0·5 kg subtracted to consider the light clothes worn by the participant. BMI was calculated as weight (kg)/height (m2). Unplanned weight loss was assessed with a single question about any unplanned decrease in body weight during the last month.
Physical function was assessed by The Short Physical Performance Battery(Reference Guralnik, Simonsick and Ferrucci20). The Short Physical Performance Battery combines balance (side-by-side, semi-tandem and tandem: 10 s each position), gait (timed 3 m walk at usual pace) and chair rise (5 timed chair stand as quickly as possible). The Short Physical Performance Battery scores range from 0 (worst performance) to 12 (best performance)(Reference Guralnik, Simonsick and Ferrucci20). A cut-point of ≤9 was used as an indicator of increased risk of mobility disability and activities of daily living(Reference Vasunilashorn, Coppin and Patel21,Reference Guralnik, Ferrucci and Pieper22) . The Short Physical Performance Battery was previously validated to measure physical function and predicted loss of mobility and ability to perform ADL in community-dwelling older adults(Reference Vasunilashorn, Coppin and Patel21–Reference Freiberger, de Vreede and Schoene23).
Daily physical activity was continuously measured by wrist-worn accelerometers (ActiGraph GT3X/GT3X+; ActiGraph Inc.) on the dominant hand for 7 d. Participants were asked to remove the accelerometers only when in water activities or when taking showers. Participants were encouraged to maintain their usual daily routines. Accelerometer data were downloaded by the Acti-Life software (version 6.4.11) into Actigraph counts (.gt3x file format) and converted into .agd file format. A custom-made software programme was used to produce counts per minute. Valid data were defined as a minimum of 10-h daily recordings for at least 4 d. Periods of ≥30 min with zero count allowing for one single spike below 100 counts were defined as non-wear time. Physical activity was summed for the accelerometer wear time from 08.00 to 23.00 hours and generating the average count per minute. A cut-point of ≤2302 counts/min was applied to identify sedentary behaviour(Reference Koster, Shiroma and Caserotti24). Time spent sedentary was calculated using accelerometer wear time as denominator and expressed in percentage.
Prevalence of low protein intake and dietary patterns
Participants were instructed to fill out a 4-d food record on three weekdays and 1 d during the weekend. This method is referred to as the gold standard method to assess self-reported nutritional intake(Reference Thompson and Byers25) and has been previously applied to studies with older community-dwelling participants(Reference Timon, Astell and Hwang26,Reference Beck, Kjær and Hansen27) . Four days of registration was selected to provide a sufficient weekly representation of the usual intake of macronutrients, taking into account the burden of the data collection method on the participants and the risk of poor data quality due to fatigue(Reference Thompson and Byers25,Reference Millen, Quatromoni and Franz28) .
Photos of portion sizes of selected foods (meat, pasta, rice, vegetables, cereals and butter/margarine on breads) were provided. If participants did not measure the amount of food they ingested, they were asked to make a detailed description and to select the photo (marked with numbers) with the portion size that matched their intake. The photos were used to increase precision of the registered portion sizes. The main meals (breakfast, lunch and dinner) were defined by the participants. Lunch and dinner were categorised as hot meals (requiring cooking such as potatoes, meat and sauce) or cold meal (no cooking required, e.g. bread and filling). Snack meals were defined as any additional nutritional intake contributing to total energy intake (excluding water, tea or coffee without added sugar, milk etc.). Participants were instructed to eat as usual, report all food and drink and to fill out the food record in detail. During the second home visit, the food record was qualified by a trained research assistant who asked participants for additional information about types of food, preparation and portion sizes. Content of glasses and cups was directly measured during the home visit to quantify fluid intake. Dietary intake was calculated by nutritional professionals. The dietary programme Winfood (version 4.1), based on the national food database, was used to quantify intake of energy and macronutrients. If not specified by the participants, standard portion sizes were entered(Reference Ygil29). Daily intake of protein (total g/d, g/meal per d, g/kg per meal/d, g/kg per d, energy percentage (E%) from protein), energy (total kJ/d, kJ/kg per d), protein from cold meals (lunch and/or dinner – g/meal), protein from hot meals (lunch and/or dinner – g/meal) and number of meals was averaged for the 4 d. Low protein intake was defined as <1·0 g/kg per d and normal protein intake as ≥1·0 g/kg per d calculated as an average for the 4 d. The minimum recommended energy intake from protein was 15E%, following the Nordic Nutrition Recommendations 2012(30). The averaged intake of protein from each meal (breakfast, cold meals, hot meals and snack meals) during the 4 d was used to calculate the relative contribution to the total daily intake of protein (averaged from the 4 days). A cut-point of ≤20 % was used to categorise participants with a low contribution to total protein intake from breakfast. Protein and energy variability (CV: mean/standard deviation) were calculated as i) meal-to-meal: the average intake of protein and energy from the main meals for the 4 d and ii) day-to-day variability: the average total intake of protein and energy per day for the 4 d. A cut-point of <20 % was used to categorise participants with low day-to-day variation in protein intake.
Modifiable risk factors for low protein intake
Modifiable risk factors were defined as risk factors that can be modified by (i) treating the condition or (ii) modifying the diet to reduce the consequences on the dietary intake. These included appetite, dysphagia, dental status and eating symptoms (e.g. nausea, mouth dryness) administered by personnel during the second home visit and pain collected by the self-administered questionnaire filled out between the two home visits.
Appetite was assessed by The Simplified Nutritional Appetite Questionnaire (SNAQ)(Reference Wilson, Thomas and Rubenstein31). SNAQ consists of four questions about appetite, taste, satiety and number of meals, each with five possible answers. The questionnaire results in a score from 5 to 20. A SNAQ-score ≤14 indicates reduced appetite and significant risk of at least 5 % weight loss within 6 months(Reference Wilson, Thomas and Rubenstein31). The questionnaire was previously validated in community-dwelling older adults, long-term care facilities and geriatric patients to identify older adults at risk of weight loss due to reduced appetite(Reference Wilson, Thomas and Rubenstein31,Reference Hanisah, Suzana and Lee32) .
Dysphagia was assessed by the EAT-10 Questionnaire(Reference Belafsky, Mouadeb and Rees33), which consists of ten questions related to swallowing issues. Participants were asked to rate the symptoms on a scale from 0 to 4, with 0 reflecting ‘no problem’ and 4 reflecting ‘severe problem’. EAT-10 results in a score from 0 to 40. A score ≥3 indicates risk of dysphagia. The questionnaire has previously been validated to identify symptoms of dysphagia and initial dysphagia severity in older adults(Reference Belafsky, Mouadeb and Rees33).
Dental status was assessed by three questions: (1) Is eating painful due to your denture or dental status? (2) Do you avoid certain foods due to denture or dental status? (3) Have you visited a dentist during the last year?
Eating symptoms were assessed by The Eating Symptom Questionnaire which consist of thirteen eating symptoms, for example nausea, mouth dryness and constipation which may affect appetite and eating ability(Reference Norden, Gronberg and Bosaeus34). Participants were asked to rate whether and to what degree they had experienced symptoms during the previous 2 weeks (five steps, ranging from ‘no symptoms’ to ‘severe symptoms’). Eating Symptom Questionnaire was developed to investigate the prevalence of eating symptoms in older patients with Chronic Obstructive Lung Disease (+62 years) and was previously validated to identify participants who were nutritionally depleted and had lower appetite(Reference Norden, Gronberg and Bosaeus34).
Pain was assessed by The Brief Pain Inventory – Short Form(Reference Cleeland and Ryan35) which is a self-administered questionnaire used to evaluate the impact of overall pain and anatomic location-specific pain on daily functioning. Participants with pain were asked to report pain interference with general activity, mood, walking ability, normal work, relations with other people, sleep and enjoyment of life on a scale from 0 to 10 (0 indicates no pain interference and 10 indicates pain completely interferes) for each domain. The mean of the seven interference items was used as a measure of pain interference(Reference Cleeland and Ryan35). The questionnaire was originally developed to evaluate cancer-related pain and further validated with several non-cancer conditions (e.g. arthritis, low back pain and chronic non-malignant pain)(Reference Tan, Jensen and Thornby36–Reference Keller, Bann and Dodd39).
Statistical methods
The present study was a secondary analysis of observational data from the ‘I’m still standing study 1’. Sample size calculation was performed on the study’s primary aim, to investigate the contribution of nutritional intake to physical frailty.
Descriptive statistics was performed to summarise participant’s characteristics, their dietary pattern and their modifiable risk factors by protein intake. Distribution of data in the continuous variables was checked, and data are presented as mean or median and 95 % CI, as appropriate. For categorical variables, data are presented as percentage of participants and 95 % CI. Multivariable logistic regression analyses were conducted to explore if the different characteristics (dietary patterns and modifiable risk factors) were independently associated with protein intake.
Variables with P < 0·2 in the bivariate analysis (data not presented) and a minimum of ten events for each variable were tested in separate regression models adjusted for age and sex (model 1) and age, sex, BMI categories and number of diseases (model 2). Age was a categorical variable using quartiles. The lowest quartile was used as reference category. BMI categories, low and high (BMI < 22·0 kg/m2 or >27 kg/m2) and normal (BMI 22–27 kg/m2), were used in the models. These cut-points have earlier been applied(Reference Wijnhoven, Elstgeest and de Vet40,Reference Berner, Becker and Wise41) , and the use of higher BMI cut-points for older adults was supported by the recent ESPEN guideline(Reference Volkert, Beck and Cederholm6). Results from the separate regression models are only shown if P < 0·1. Last, the aggregation of risk factors was tested in separate logistic regression models. Model assumptions were validated. If continuous variables failed the linearity assumption of the log odds, the variable were categorised. All logistic regression models were repeated in a sensitivity analysis where participants who had a protein intake between 0·95 and 1·05 g/kg per d (corresponding to +/–5 % from the cut-point of 1·0 g/kg per d) were removed. Statistical significance was set at P < 0·05. Analyses were restricted to participants with complete data on all variables. All statistical analysis was performed in the statistical software programme STATA 16 (StataCorp. 2019. Stata Statistical Software: Release 16.).
Results
Recruitment
A total of 366 participants were invited to participate in the HANC follow-up. Thirty-six participants were lost to follow-up, and forty-seven were not eligible (n 20 not self-reliant, n 15 < 80 years, n 6 not living in the Municipality of Odense, n 6 poor cognitive function). Seventy participants declined to participate in the project due to: poor health (n 15), project too demanding (n 12), too busy (n 8), not interested (n 5), bad experiences from other projects (n 6) and no reason (n 24). A total of 213 were included in the HANC follow-up, and 147 participants also agreed to participate in the I’m still standing study. Five participants aged 78–79 years were included (mean age 79·1 years). Thirteen participants declined to fill out the food record, six food records had inadequate details and two were unable to complete the task due to visual impairments. A total of 126 fulfilled the 4-d food records and were included in the present analysis.
Descriptive characteristics of study participants
Study participants were 86 (sd 3·6) years old, 63·5 % were women and 68·8 % were living alone (81·0 % and 47·8 % for women and men, respectively). Average daily protein intake was 0·99 (sd 0·28) g/kg per d, and average energy intake was 113 (sd 33) kJ/kg per d. Average BMI was 26·4 (sd 4·1) kg/m2, and 10·3 % reported an unplanned weight loss during the last month (7·5 % and 15·2 % for women and men, respectively). Risk of dysphagia was observed in 11·9 % of participants (15 % and 6·5 % women and men, respectively). Average counts per minute were 1949·9 (sd 582·5), and participants spend 64·9 % of waking time in sedentary behaviour. Increased risk of mobility disability was found in 37·1 % of the study participants with a sex distribution of 30·4 % and 48·9 % in women and men, respectively. Last, participants reported an average of 3·5 (sd 2·1) medically diagnosed conditions.
Prevalence of low protein intake and characteristics by protein intake
The prevalence of low protein intake (<1·0 g/kg per d) was 54 %, and daily protein intake contributed less to total energy intake than recommended (<15 E% from protein) in 50·8 % of the participants. Furthermore, 74·6 % of the participants had less than one meal/d meeting the threshold of 0·4 g/kg body weight. Number of meals ≥0·4 g/kg per d ranged from 0 to 2·25 per d.
Descriptive characteristics by protein intake are provided in Table 1. The low protein group had significant lower total and relative daily average intake of protein. The protein content was significantly lower from main meals for the low protein intake group, but similar to the normal protein group from snack meals. Participants with low protein intake had significant fewer meals with a high protein content compared with participants in the normal protein intake group. Last, participants with low protein intake were older, had higher BMI and lower physical function compared with participants with normal intake of protein. However, no significant between-group differences were observed for sex distribution, living status, number of diagnosed diseases, prevalence of unintentional weight loss, physical activity and time spend in sedentary behaviour.
Table 1. Descriptive characteristics by protein intake
(Mean values, medians, percentages and 95 % confidence intervals)

* n 56 and n 61 in the groups with normal and low protein intake, respectively.
† Mean.
‡ Assessed by wrist-worn accelerometer.
§ n 54 and n 59 in the groups with normal and low protein intake, respectively.
|| Physical function: the Short Physical Performance Battery, SPPB.
Protein intake and dietary patterns
Breakfast contributed significantly less to the overall protein intake in participants with low compared with normal protein intake. In addition, significantly greater day-to-day and meal-to-meal protein intake variability was observed in the low protein group, whereas no group differences were observed in day-to-day and meal-to-meal energy intake variability (Table 2).
Table 2. Dietary patterns by protein intake
(Mean values, medians, percentages and 95 % confidence intervals)
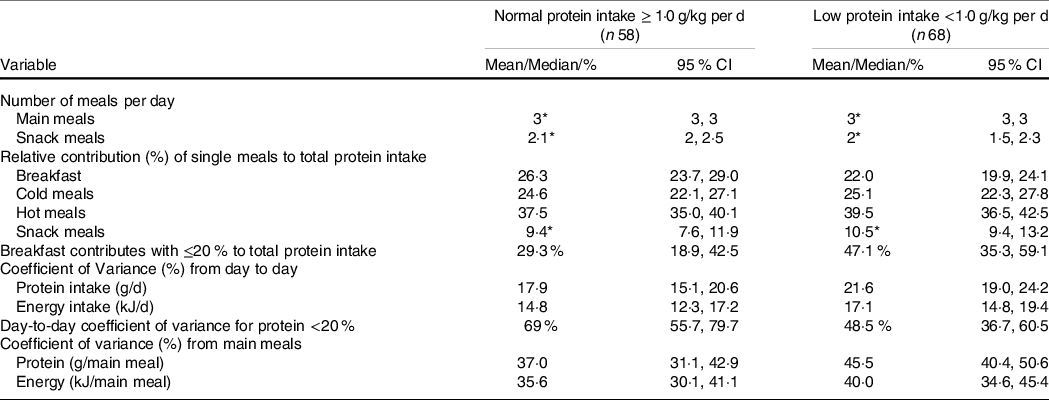
* Median.
Logistic regression analysis revealed a significant difference in the odds found for having low protein intake with high (≥20 %) day-to-day protein intake variability when adjusting for age, sex, BMI categories and number of diseases (Table 3).
Table 3. Associations between low protein intake and dietary patterns*
(Odds ratio and 95 % confidence intervals)

* Logistic regression with normal protein intake (≥1·0 g/kg per d) as reference category (n 58) and low protein intake (<1·0 g/kg per d) as outcome category (n 68). Model 1 is adjusted for age and sex. Model 2 is adjusted for age, sex, BMI categories (0 = BMI below 22 or above 27 1 = BMI range from 22 to 27) and number of diseases. The results are obtained from six different regressions. Significant findings (P < 0·05) highlighted.
† The relative contribution from breakfast to total protein intake, 0 = breakfast contribute with 20 % or less to total protein intake, 1 = breakfast contribute with more than 20 % total protein intake.
‡ CV in protein intake from day-to-day, 0 = intake varies <20 % from day-to-day, 1 = intake varies by 20 % or more from day-to-day.
§ CV in protein intake from main meals, continuous variable expressed as percentage, a larger percentage indicates larger variation in intake.
Protein intake and modifiable risk factors
Participants with low protein intake had a significant greater prevalence of eating symptoms including nausea, diarrhoea and mouth dryness compared with the normal protein intake group. In addition, a trend (P = 0·06) for reduced appetite and pain interference with activities was observed in the low compared with the normal protein intake group. No differences for dysphagia or dental status were found between the groups (Table 4).
Table 4. Potential modifiable risk factors by protein intake
(Medians, percentages and 95 % confidence intervals)
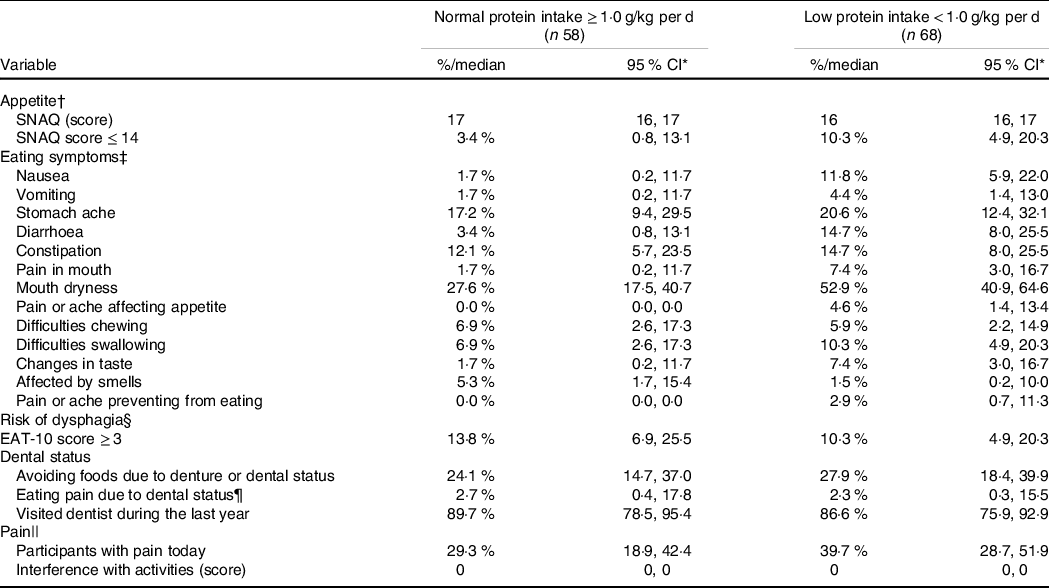
* Appetite: Simplified Nutritional Appetite Questionnaire, SNAQ.
† Eating symptoms: the Eating symptom questionnaire.
‡ Dysphagia: the EAT-10 questionnaire.
§ Pain: the Brief Pain Inventory.
|| n 37 and n 43 in the groups with normal and low protein intake, respectively.
In the fully adjusted logistic regression model, reduced appetite, mouth dryness and pain were associated with significant higher odds of low protein intake, whereas no differences were observed for diarrhoea (Table 5).
Table 5. Associations between low protein intake and appetite, mouth dryness, diarrhoea and pain*
(Odds ratio and 95 % confidence interval)
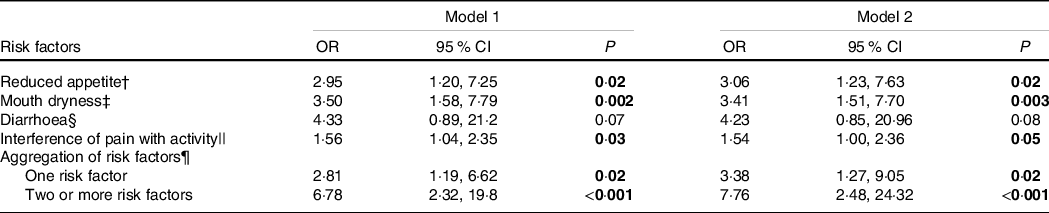
* Logistic regression with normal protein intake (≥1·0 g/kg per d) as reference category (n 58) and low protein intake (<1·0 g/kg per d) as outcome category (n 68). Model 1 is adjusted for age and sex. Model 2 is adjusted for age, sex, BMI categories (0 = BMI below 22 or above 27 1 = BMI range from 22 to 27) and number of diseases. The results are obtained from ten different regressions. Significant findings highlighted.
† Reduced appetite was assessed by the Simplified Nutritional Appetite Questionnaire (SNAQ), score range from 5 to 20 and a higher score indicate a better appetite. 0 = Participants have an appetite score > 15; 1 = Participants have an appetite score ≤ 15.
‡ Mouth dryness: 0 = no symptoms, 1 = mild to severe symptoms.
§ Diarrhoea: 0 = no symptoms, 1 = mild to severe symptoms.
|| Interference of pain with activity range from 0 to 10. 0 indicates no interference of pain with activities and 10 indicates that pain total interferes with activities.
¶ Aggregation of the risk factors reduced appetite (SNAQ score ≤ 14), mouth dryness, diarrhoea and pain that interferes with activities, reference is having none of the risk factors.
Protein intake and aggregation of risk factors
The presence of one risk factor or two or more risk factors was associated with significant greater odds of low protein intake after adjusting for age and sex, and age, sex, BMI categories and diseases (fully adjusted model any risk factor: OR 3·38; two or more risk factors: OR 7·76) (Table 5).
Sensitivity analysis
For the sensitivity analysis, the multiple logistic regression analysis was repeated with normal protein intake (>1·05 g/kg per d) as reference category (n 49) and low protein intake (<0·95 g/kg per d) as outcome category (n 63). The OR were not markedly affected, and conclusions from the initial analysis were reproduced (data not shown).
Discussion
The main findings of the present study were (i) 54 % prevalence of low protein intake (<1·0 g/kg per d) in self-reliant community-dwelling adults 80+ years, (ii) the association of low protein intake and dietary patterns characterised by a greater day-to-day protein intake variability and (iii) the association of reduced appetite, mouth dryness and pain and low protein intake.
Prevalence of low protein intake and associated characteristics
Meeting recommended daily protein intake is critical for the maintenance of lean mass and therefore an important target in the preventive strategies for older adults(Reference Deutz, Bauer and Barazzoni7). In the present study, we found that the prevalence of low protein intake was greater than that estimated based on the evidence from a previous systematic review (54 % v. 23–27 %)(Reference Ter Borg, Verlaan and Mijnarends8). The participants in the present study were on average 86 years old with the minimum age of 80 years. This age group was relatively underrepresented in the studies included in the review. Such age difference may partially explain the greater prevalence of inadequate protein intake in the present study, and it is supported by the significantly older age in the low protein intake group (Table 1). Differences in nutritional assessment methods may also add to the explanation of the greater prevalence of low protein intake in the present study. In the systematic review by Ter Borg and colleagues(Reference Ter Borg, Verlaan and Mijnarends8), the included studies have used diverse methods to assess protein intake (e.g. FFQ, 24–48-h recalls, 4–7-d food records). It was earlier suggested that estimation of protein intake may vary with the method used(Reference Timon, Astell and Hwang26,Reference Schatzkin, Kipnis and Carroll42) , which potentially challenge direct comparison between studies applying different methods. Last, nutritional intake may differ between cultural settings. A recent Danish study found that the prevalence of low protein intake (cut-point <1·1 g/kg per d) was 44 and 47 % in healthy community-dwelling women and men, respectively (age 65–81 years, using 3-d weighed food records)(Reference Rønnow Schacht, Vendelbo Lind and Bechshøft43). Considering the higher cut-point for low protein intake and the relatively younger age, the results from the two Danish studies (Rønnow Schacht and colleagues, and the present study) seem more comparable. The prevalence of low protein intake in self-reliant community-dwelling adults 80+ years is, to the best of knowledge, unknown in Denmark. In addition, nutritional data on older adults include a range of age where oldest old are often poorly represented. Due to cultural differences in eating habits, results from other cultures, for example, the USA, cannot be extrapolated to this setting. The large proportion of older adults with a low protein intake highlights the need to target this nutritional challenge.
Low BMI and unintentional weight loss are indicators commonly used to identify poor nutritional status in older adults despite being unable to differentiate between intake of macronutrients. Our results showed that participants with an inadequate protein intake were not identified by these methods (Table 1). Participants had a higher BMI in the low compared with the normal protein group. Further, self-reported unintentional weight loss was evenly distributed in the low and the normal protein group, and the prevalence of unintentional weight loss (in all participants) did not reflect the prevalence of low protein intake (7·5–15·2 % in women and men, respectively, v. 54 %). Hence, despite that BMI and unintentional weight loss reflect long-term and short-term imbalances in energy intake compared with energy expenditure, it does not reflect risk of low protein intake in our population. The current recommendations for protein intake are expressed as g/kg per d, indicating that the body weight of the participant determines the total amount of protein recommended. However, both the normalised protein intake per kg of body weight and the total intake of protein differed between groups (low protein group: 0·79 ± 0·12 g/kg per d and 58·0 ± 11·2 g/d; normal protein group: 1·2 ± 0·23 g/kg per d and 79·3 ± 14·4 g/d), indicating that BMI could not entirely explain the lower intake. To take into account the potential effect of very high or very low body weight on the ability to achieve the recommendation for protein intake, and that there may not be a linear relationship between body weight and lean mass, we adjusted the analysis for BMI beyond the normal range, applying the cut-points earlier suggested for older adults(Reference Wijnhoven, Elstgeest and de Vet40,Reference Berner, Becker and Wise41,Reference Cederholm, Jensen and Correia44) . The rationale for the applied cut-points was that validity of standard BMI cut-points to reflect overweight and obesity in older adults has been debated due to age-related changes in height and body composition(Reference Volkert, Beck and Cederholm6). Further, higher BMI has been associated with reduced mortality and better health profile in older adults(Reference Global, Di Angelantonio and Bhupathiraju Sh45–Reference Flegal, Kit and Orpana47). In addition to a higher BMI, participants with a low protein intake also have lower physical function (Table 1). Direct measures of lean mass would be required to investigate if the differences in physical function are associated with between-group differences in lean mass. Participants in the low protein group also had a significantly lower intake of energy despite a higher BMI. Cut-points often used to exclude participants underreporting energy are not eligible for this population(Reference Goldberg, Black and Jebb48). Physical activity assessed by accelerometers may provide an estimate of energy expenditure. In the present study, physical activity was assessed with wrist-worn accelerometers which showed that approximately 65 % of waking time was spent in sedentary behaviour (Table 1). This is slightly lower than 78 % of waking time reported in a recent study using hip-worn accelerometers in participants recruited in a similar way(Reference Giné-Garriga, Sansano-Nadal and Tully49). This potential mismatch may be caused by the slightly older age of our participants and, most importantly, by the anatomic location of the accelerometers (hip v. wrist) where sitting/laying upper body active behaviour (e.g. knitting) may have not been captured by hip-worn accelerometers. Nevertheless, estimating energy expenditure by accelerometry methodology in very old adults may be challenging. Postural energetics (e.g. energy expenditure during sitting, standing, postural transition from sitting to standing), which may substantially contribute to total daily energy expenditure in highly sedentary participants, cannot be quantified by wrist- and hip-worn accelerometers(Reference Miles-Chan and Dulloo50). Indeed, postural energetics has recently been suggested as target for increasing daily energy expenditure(Reference Miles-Chan and Dulloo50). Also, dynamic sitting assessed by hip-worn accelerometers which was earlier associated with lower BMI, waist circumference and lower odds of having the metabolic syndrome cannot be captured by wrist-worn accelerometers(Reference van der Berg, Stehouwer and Bosma51). Finally, higher BMI has been associated with more sedentary time(Reference Giné-Garriga, Sansano-Nadal and Tully49). This is in agreement with our data, indicating that the participants with higher BMI (>27 kg/m2) had fewer counts per minute (mean 1839 (sd 658)) compared with participants with lower BMI (<22 kg/m2) (2280 (sd 544)) and may also explain the lower energy intake in the low protein group despite a higher BMI. In general, less physical activity and different types of daily physical activity may partially explain some of the discrepancy between energy intake and body mass. However, based on the available data and the methodology used in the present study, it is not possible to accurately estimate energy expenditure and conclude whether differences in energy intake are explained by underreporting or simply reflect differences in physical activity level.
Dietary patterns and association with protein intake
Our results showed that dietary patterns differed between low and high protein intake groups. Optimal distribution of protein intake during the day is currently debated, and studies investigating the influence of protein distribution on functional outcomes are sparse(Reference Murphy, Oikawa and Phillips52). Nevertheless, a minimum protein intake per meal of ≥0·4 g/kg has been shown to optimally stimulate muscle protein synthesis in older adults(Reference Moore, Churchward-Venne and Witard16). In the present study, only 25·4 % of our population ingested at least one daily meal above this threshold. This is low compared with previous findings in community-dwelling adults 75–85 years where a weekly range between 30 and 60 % was shown(Reference Gingrich, Rennekamp and Brandl17). However, participants with recent weight loss, very low or high BMI or several chronic conditions, including diabetes, lung diseases and heart conditions, were excluded in the latter study(Reference Gingrich, Rennekamp and Brandl17). Hence, the greater proportion of meals with minimum protein content of 0·4 g/kg may reflect a more selected group of community-dwelling older adults(Reference Gingrich, Rennekamp and Brandl17). In the present study, participants with a low intake of protein had significant fewer meals meeting the threshold of maximally stimulatory protein intake compared with participants with normal intake of protein (Table 1). This is possibly related to the differences in total protein intake, but could also indicate that participants in the low protein group would benefit less from the ingested protein, due to suboptimal stimulation of muscle protein synthesis as previously shown(Reference Moore, Churchward-Venne and Witard16). However, information about muscle protein synthesis is only one aspect of muscle protein turnover. Muscle protein breakdown must be considered, and the rate of breakdown may be affected by various conditions, for example, inflammatory states (following chronic and acute diseases) and energy deficits(Reference Gwin, Church and Wolfe53). In addition, it is important to note that the suggested threshold of 0·4 g protein/kg per meal was based on the acute effects of intake of isolated proteins(Reference Moore, Churchward-Venne and Witard16). Long-term effect of protein from mixed meals is currently unknown as discussed by Murphy and colleagues(Reference Murphy, Oikawa and Phillips52). Hence, it is unknown if the threshold of 0·4 g protein/kg per meal is clinically relevant in the present population of older adults that have various chronic conditions, differ in energy status and are eating protein containing mixed meals.
Day-to-day variability in protein intake has previously been reported in community-dwelling older adults(Reference Gingrich, Rennekamp and Brandl17). The present study found that day-to-day and meal-to-meal variability in protein intake was significantly greater in the low protein group (Table 2) and that a high day-to-day variability (operationalised as >20 %) was associated with higher odds of low protein intake (Table 3). The day-to-day and meal-to-meal variability (19·8 and 41·6 %, respectively) is lower than previous findings in healthy community-dwelling adults aged 75–85 years (24 and 50 % variability from day-to-day and meal-to-meal, respectively)(Reference Gingrich, Rennekamp and Brandl17). Both the nutritional assessment methods (7- v. 4-d food records) and cultural differences in dietary patterns (greater intake of proteins on Sundays in the study by Gingrich and colleagues(Reference Gingrich, Rennekamp and Brandl17)) may partially explain such differences between the studies. Our results indicate that the intake of protein-rich foods was less consistent in participants with low protein intake and that this contributed to lower total protein intake. Whether specific types of protein-rich foods may explain this variability (e.g. meat for dinner), or whether social aspects (e.g. dining alone) may play a role needs to be evaluated in future studies.
In the present study, breakfast contributed less to total protein intake in the group with low protein intake (Table 2). Additionally, there was a trend that a high contribution of protein from breakfast (operationalised as >20 % of total protein intake) was associated with reduced odds of low protein intake (adjusted for age and sex, P = 0·053, Table 3). Results from previous studies are conflicting. Two studies found that protein intake in community-dwelling older adults was low at breakfast(Reference Tieland, Borgonjen-Van den Berg and van Loon54,Reference Valenzuela, Ponce and Morales-Figueroa55) and was associated with low muscle mass(Reference Valenzuela, Ponce and Morales-Figueroa55). On the contrary, recent findings show that a greater proportion of protein in the morning was associated with a lower total protein intake and a greater risk of low protein intake in community-dwelling adults(Reference Mendonça, Granic and Mathers14,Reference Rooijackers, Ocke and Hengeveld56) . These studies used different cut-points for low protein intake (<0·8 g/kg per d v. <1·0 g/kg per d), and this may partially explain the mismatch. Additionally, differences in the type of protein-rich food ingested during breakfast may potentially add to the complexity (protein quality, rate of absorption, effect on satiety)(Reference Anderson and Moore57). Results from the present study showed that the association between low protein intake and contribution from breakfast was non-significant when adjusting for age, sex, BMI categories and diseases, indicating that some of these covariates may play an independent cumulative effect for the low protein group (Table 3).
Modifiable risk factors and association with protein intake
Reduced appetite was identified as a potential modifiable risk factor increasing odds of low protein intake in the adjusted analysis (Table 5). The prevalence of reduced appetite (identified by a SNAQ-score ≤ 14(Reference Wilson, Thomas and Rubenstein31)) was relatively low (10·3 % v. 3·5 % in the low v. normal protein group, respectively) compared with recent findings of 21 % in community-dwelling adults 70+ years admitted to a geriatric outpatient clinic(Reference İlhan, Bahat and Erdoğan58). Acute and chronic conditions are known to have a negative effect on appetite(Reference Landi, Calvani and Tosato9) supporting the lower prevalence in the present study. In addition, the cut-point used in the SNAQ, applied in both studies, was validated to identify participants at-risk of weight loss (indicating low energy intake compared with requirements) and it has not been validated to identify participant at risk of low protein intake due to reduced appetite. Appetite may be affected by physical activity(Reference Hung, Wijnhoven and Visser10). However, the level of physical activity and time spend sedentary did not differ between groups (Table 1). In the logistic regression analysis using a cut-point of SNAQ ≤ 15, appetite independently increased odds of low protein intake (Table 5). Reduced appetite has been associated with both frailty and disability(Reference Tsutsumimoto, Doi and Makizako59) and inadequate protein intake was suggested as one of the key factors affecting muscle mass and muscle strength loss(Reference Tsutsumimoto, Doi and Makizako59). The association of reduced appetite and low protein intake is relevant as reduced appetite may be a modifiable risk factor. Several multi-component strategies including changes in eating environment, medication, food form and portion sizes have been previously proposed to improve appetite and overall dietary intake in this target group(Reference Landi, Calvani and Tosato9,Reference Leidy, Apolzan and Mattes60) .
The prevalence of risk of dysphagia was low in the present study (Table 4). The challenges of assessing dysphagia in older adults are well known, and it was recently illustrated in a systematic review where the prevalence ranged between 5 and 72 % in studies in community-dwelling adults >60 years using a variety of assessment methods(Reference Madhavan, LaGorio and Crary61). Objective assessment for risk of dysphagia would possibly identify more participants compared with the self-reported questionnaire. This has earlier been illustrated in community-dwelling women aged 85–94 years, where prevalence of self-reported dysphagia was 15 % compared with 72 % identified by swallowing test(Reference González-Fernández, Humbert and Winegrad62). In addition, despite only speculative, our participants may have adjusted their diet by leaving out certain foods or making changes in texture (more semi-solid and soft foods) to minimise the symptoms of dysphagia.
A strong association between low protein intake and mouth dryness was observed in the present study (Table 5). Mouth dryness was earlier associated with incident malnutrition, loss of appetite, decreased chewing and swallowing abilities and unbalanced dietary intake in community-dwelling, hospitalised and institutionalised older adults (age range 66–84 years)(Reference Kiesswetter, Hengeveld and Keijser63–Reference Muñoz-González, Vandenberghe-Descamps and Feron65). Our findings support previous studies by showing a relationship between mouth dryness and low protein intake. In the present study, pain increased the odds of low protein intake (Table 5). This is supported by an independent association between nutritional risk (assessed by a questionnaire screening tool) and chronic musculoskeletal pain in community-dwelling adults ≥65 years(Reference Bárbara Pereira Costa, Andrade Carneiro Machado and Marcos Domingues Dias66). The authors suggested that this association may be mediated by a combination of depleted muscle mass and inflammatory responses triggered by insufficient nutritional intake that leads to increased joint loading and pain(Reference Bárbara Pereira Costa, Andrade Carneiro Machado and Marcos Domingues Dias66). It was also highlighted that pain may be worsened in the sarcopenic obesity phenotype due to the disparity between muscle mass and loading(Reference Bárbara Pereira Costa, Andrade Carneiro Machado and Marcos Domingues Dias66). Pain was also reported to have a negative effect on appetite(Reference Landi, Calvani and Tosato9,Reference Pilgrim, Robinson and Sayer67) which possibly mediated the effect on protein intake. Mouth dryness and pain may be modified by treating the underlying condition and/or targeted nutritional interventions, for example, changing the texture or composition of the diet. The aggregation of the risk factors evaluated in the present study was confirmed by the stepwise increase in odds (adjusted logistic regressions) when one or two and more risk factors were combined (Table 5). This indicates that strategies to improve protein intake in this population should (i) identify the primary causes of the low intake and (ii) offer intervention tailoring each individual risk factor.
Strengths and limitations
Strengths of the present study include the use of 4-d food records, which (i) is considered the gold standard method(Reference Thompson and Byers25), (ii) provide detailed information on specific foods consumed and (iii) allow the evaluation of day-to-day and meal-to-meal variability, which cannot be estimated with other methods (e.g. FFQ). In addition, 4-d food record method is less reliant on memory compared with other nutritional assessment methods, such as 24-h recalls and FFQ, which may increase accuracy(Reference Volkert and Schrader68). Previous findings showed that participants filling out food records are less likely to underreport protein compared with energy(Reference Livingstone and Black69). Additionally, compared with independent urine biomarkers of protein intake, the 4-d food records were valid in their assessment of protein intake in community-dwelling adults aged 65–89 years(Reference Timon, Astell and Hwang26). The sensitivity analysis reproduced the results from the primary analysis, which indicates that the results are robust. Last, our method included data from both weekdays and weekends which may improve the precision of the average daily protein intake taking into account potential different food habits during the week, as earlier demonstrated(Reference Gingrich, Rennekamp and Brandl17). All data collection was performed in the homes of the participants. This reduced the risk of selection bias due to reduced mobility or costs related to transportation.
A limitation of the study was the cross-sectional design that did not allow for investigation of causal relations. In addition, a large part of the data collection was based on self-reported questionnaires or records (e.g. pain, eating symptoms and appetite). Answers reflect the understanding and interpretation of the questions and may be biased by social desirability. Food records may also be affected by social desirability, seasonal variation and underreporting(Reference Stelmach-Mardas, Kleiser and Uzhova70,Reference Subar, Freedman and Tooze71) . To limit the risk of social desirability bias, participants were not informed about the specific focus of the nutritional assessment. In addition, food records were collected over the course of the year and each record was individually qualified by nutritional professionals with each participant by interviews.
Conclusion
In conclusion, the present study showed that 54 % of the self-reliant community-dwelling adults 80+ years had protein intake below the recommended level. A greater day-to-day variability in protein intake increased significantly the odds of low protein intake. Reduced appetite, mouth dryness and pain were identified as modifiable risk factors that significantly increased odds of low protein intake. These findings add to the understanding of the complexity of achieving optimal intake of protein in very old adults and may contribute to develop tailored preventive strategies to minimise the consequences of low protein intake. Future prospective studies are needed to investigate whether modifying the identified risk factors may increase protein intake in this population.
Acknowledgements
We thank Jenny Havn, chief of the department for preventive home visits in the Municipality of Odense, and her team for their collaboration, Mathias Skjødt for his assistance with the HANC-cohort and Jan Christian Brønd, Associate Professor at the Institute of Sports Science and Biomechanics at the University of Southern Denmark for physical activity data.
The ‘I’m still standing’ project was funded by the Danish Dairy Research Foundation with co-funding from the involved partners; the University of Southern Denmark, University College Copenhagen and Arla Foods Amba.
P. C., A. M. B. and B. C. designed the study. S. F. B. wrote up the detailed protocol. S. F. B. and G. K. collected and entered data. S. F. B., E. B. and P. C. analysed and interpreted data. S. F. B., P. C., A. M. B. and B. C. drafted the manuscript. All authors read and approved the final manuscript.
B. C. from Arla Foods Amba has been a project partner in the application and was involved in the planning of the study including definition of study population and aim, and in the selection of methods to assess nutritional intake. B. C. has not been involved in recruitment of participants, data collection, data analysis or interpretation of data. S. F. B., P. C., G. K., E. B. and A. M. B. declare no conflicts of interest.


