


Pancreatic cancer is the fourth leading cause of cancer-related deaths in Japan, accounting for more than 30 000 deaths in 2016(1). At the time of consultation, almost 80 % of the patients are diagnosed with unresectable pancreatic cancer and the prognosis of such patients is poor, with the median overall survival (OS) being 9–15 months despite chemotherapy(Reference Lotze2). Recently, FOLFIRINOX (FX) comprising fluorouracil, leucovorin, irinotecan and oxaliplatin as a multi-agent chemotherapy regimen was reported to be more effective with better response rates and duration of survival in cases of metastatic pancreatic cancer(Reference Conroy, Desseigne and Ychou3). However, malnutrition due to the adverse events of chemotherapy might have a significant effect on the clinical course(Reference Conroy, Desseigne and Ychou3,Reference Assaf, Verlinde-Carvalho and Delbaldo4) .
Sarcopenia, defined as a decrease in skeletal muscle mass (SMM) and strength, is often observed in elderly patients and is known to cause negative outcomes such as physical disability, poor quality of life and death(Reference Goodpaster, Park and Harris5). Age-related sarcopenia is different from secondary sarcopenia resulting from diseases such as cancer. Sarcopenia is observed in approximately 65 % of the patients with pancreatic cancer at the time of diagnosis(Reference Ninomiya, Fujii and Yamada6–Reference Basile, Parnofiello and Vitale8) and is reported to be associated with physical disability, increased length of hospital stay, post-operative infections, poor tolerance to chemotherapy and reduced survival(Reference Daly, Ní Bhuachalla and Power9–Reference Prado, Lieffers and McCargar12). However, the effect of decrease in SMM during anticancer treatment has not yet been studied well. In this study, we investigated the impact of sarcopenia and decrease in SMM in patients with unresectable pancreatic cancer during FX.
Methods
Patients
This was a retrospective study conducted at a single academic centre, Gifu University Hospital. Consecutive patients who received FX regimen chemotherapy for pathologically proven unresectable pancreatic cancers between June 2014 and March 2018 were enrolled in this study. However, patients who did not have the initial evaluation using computed tomography (CT) were excluded from the study. Data were obtained from the electronic medical records and analysed retrospectively. This study was performed in accordance with the human and ethical principles of research set forth in the Helsinki guidelines and was approved by the institutional review board.
Treatment strategies
Patients were treated with a modified FX regimen every 2 weeks, which composed of a bolus injection of oxaliplatin 85 mg/m2 over 2 h, l-leucovorin 200 mg/m2 over 2 h and irinotecan at 150 mg/m2 over 90 min, followed by continuous infusion of 5-FU 2400 mg/m2 over 46 h without any bolus dose. Patients were administered an initial regular dose of chemotherapy in the first cycle. Doses were reduced in the subsequent chemotherapy cycles for patients who had severe adverse events, particularly grades 3–4 neutropenia. The criteria for dose reduction were based on the previous reports(Reference Conroy, Desseigne and Ychou3,Reference Yoshida, Iwashita and Uemura13) . Adverse events included haematological toxicities such as neutropenia, leukopenia and thrombocytopenia; non-haematological toxicities such as anorexia, vomiting, liver dysfunction, peripheral neuropathy and diarrhoea and febrile neutropenia. The symptoms of adverse events were graded according to the Common Terminology Criteria for Adverse Events version 4.0.
Body composition analysis
CT performed as part of routine patient care was used to assess the SMM as in previous studies(Reference Heymsfield, Wang and Baumgartner14). Skeletal muscle areas (SMA) (cm2) were assessed from a single axial image at the level of the third lumbar vertebra (L3). Hounsfield unit-based analysis of the image was performed using SYNAPSE VINCENT software version 4.0 (FUJIFILM). CT attenuation thresholds were –29 Hounsfield unit and 150 Hounsfield unit for skeletal muscles(Reference Ninomiya, Fujii and Yamada6). SMA and adipose tissue area (cm2) were automatically calculated by summing the tissue pixels and multiplying by the pixel surface area after applying the Hounsfield unit thresholds(Reference Kurita, Kobayashi and Tokuhisa15). SMA and adipose tissue area were normalised for height to calculate the skeletal muscle index (SMI) and adipose tissue index in cm2/m2. CT images at diagnosis were obtained prior to administration of chemotherapy with FX (median 18 d; range 1–49 d). After approximately 2 months, CT was performed again for the initial assessment during FX. The median duration between scans was 71 (range 52–130) d. The cut-off value of sarcopenia was defined as SMI < 42 cm2/m2 for men and SMI < 38 cm2/m2 for women. This cut-off value is determined according to the Asian Working Group for sarcopenia(Reference Chen, Liu and Woo16). The median rate of SMM loss in 2 months from the initiation of chemotherapy was 7·9 %. Therefore, the threshold of SMM loss between the CT before chemotherapy and the first CT after chemotherapy was set to 7·9 %, and the comparison was made according to the threshold.
Statistical analysis
Data on baseline characteristics and body composition are shown as medians and ranges. Comparisons between the two groups of patients were done using Fisher’s exact test for categorical variables and the Mann–Whitney U test for continuous variables. The median OS and progression-free survival (PFS) were estimated using Kaplan–Meier analysis and compared using the log-rank method. Survival was measured from the date of initiation of FX therapy until the date of death or censored date. The multivariate analysis using Cox proportional hazard model to determine the independent prognostic factors associated with survival, as hazard ratios (HR) and 95 % CI. All tests were two-sided, and a P value of <0·05 was considered statistically significant. Statistical analyses were performed using JMP version 13 software (SAS Institute).
Results
Baseline characteristics are presented in Table 1. A total of sixty-nine patients with advanced pancreatic cancer were enrolled in the study. The median patient age in this population was 63 (range 38–74) years. There were thirty-eight (55 %) males and thirty-one (45 %) females. All patients had good performance states (Eastern cooperative oncology group performance states 0–1). There were no cases in which uridine diphosphate glucuronosyltransferase A1 genotypes was compound heterozygous of *6 and *28 or homozygous of *6 or *28. The *6 heterozygous was observed in 18 cases and *28 heterozygous in 11 cases. Baseline anthropometry and nutritional characteristics are presented in Table 2. The BMI of most patients was normal (18·5–24·9 kg/m2) (71·4 %). The median SMI was 39·9 (range 25·1–56·2) cm2/m2 and, in total, thirty-three (48 %) patients were identified with sarcopenia based on SMI at the time of diagnosis. Body composition was serially assessed on CT performed almost 2 months from the initiation of chemotherapy. The change in SMA on serial assessment was –7·5 (range –52·4 to 8·6) cm2, with a relative SMI loss of 7·9 %. The prevalence of sarcopenia increased from 48 % (33/69) to 74 % (50/69) (Table 3). The median PFS of FX and OS was 8 (95 % CI 8·8, 13·7) and 15 (95 % CI 14·7, 20·3) months, respectively.
Table 1. Clinical characteristics of patients included in this study
(Numbers and percentages; median values and ranges)
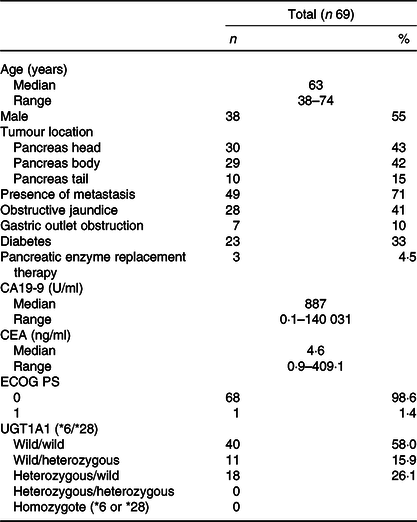
CA19-9, carbohydrate antigen 19-9; CEA, carcinoembryonic antigen; ECOG, Eastern Cooperative Oncology Group; PS, performance status; UGT1A1, uridine diphosphate glucuronosyltransferase A1.
Table 2. Anthropometric and nutritional status characteristics of patients at diagnosis and at the first assessment of chemotherapy (after 2–3 months) (Numbers and percentages; median values and ranges)
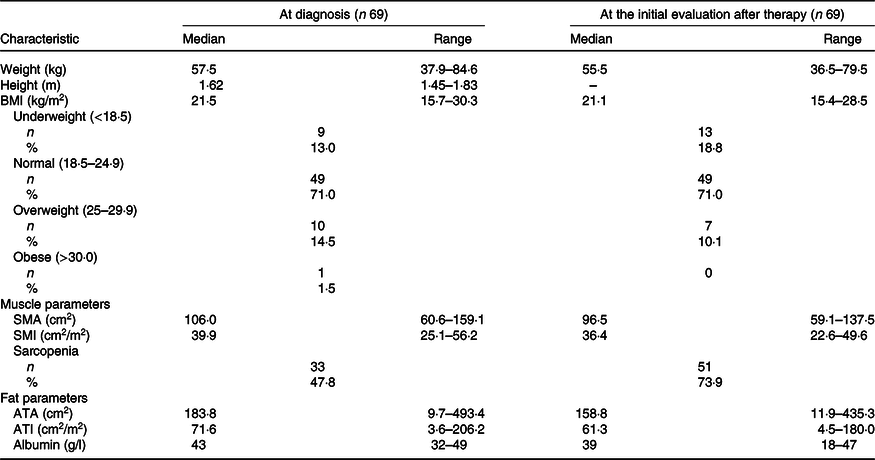
SMA, skeletal muscle area; SMI, skeletal muscle index; ATA, adipose tissue area; ATI, adipose tissue index.
Table 3. Change in measures of anthropometry between the computed tomography (CT) before chemotherapy and after 2 months
(Median values and ranges)
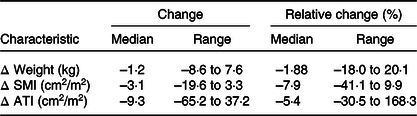
SMI, skeletal muscle index; ATI, adipose tissue index.
The baseline characteristics of patients in the sarcopenia (n 33) and non-sarcopenia (n 36) groups at diagnosis are shown in Table 4. Compared with the non-sarcopenia group, the sarcopenia group had significantly a greater number of females (P < 0·01), and the patients had a smaller tumour size (P = 0·03) and lower BMI (P < 0·01). The best response of FX did not show a significant difference between the two groups. In addition, there was no significant difference in the number of courses and relative dose intensity of FX between the groups (Table 5). The presence of sarcopenia at diagnosis did not significantly impact the rates of any adverse events of FX (Table 6). The number of deaths in the sarcopenia and non-sarcopenia groups was twenty-six (79 %) and twenty-three (64 %), respectively (P = 0·20). The median OS was 14·9 (95 % CI 11·9, 21·0) months in the sarcopenia group and 17·8 (95 % CI 10·3, 27·8) months in the non-sarcopenia group (log-rank P = 0·33) (Fig. 1). The median PFS during FX was 8·8 (95 % CI 3·2, 14·6) months in the sarcopenia group and 8·8 (95 % CI 5·2, 15·1) months in the non-sarcopenia group (P = 0·88) (Fig. 2).
Table 4. Comparison of clinical factors based on sarcopenia
(Numbers and percentages; median values and ranges)
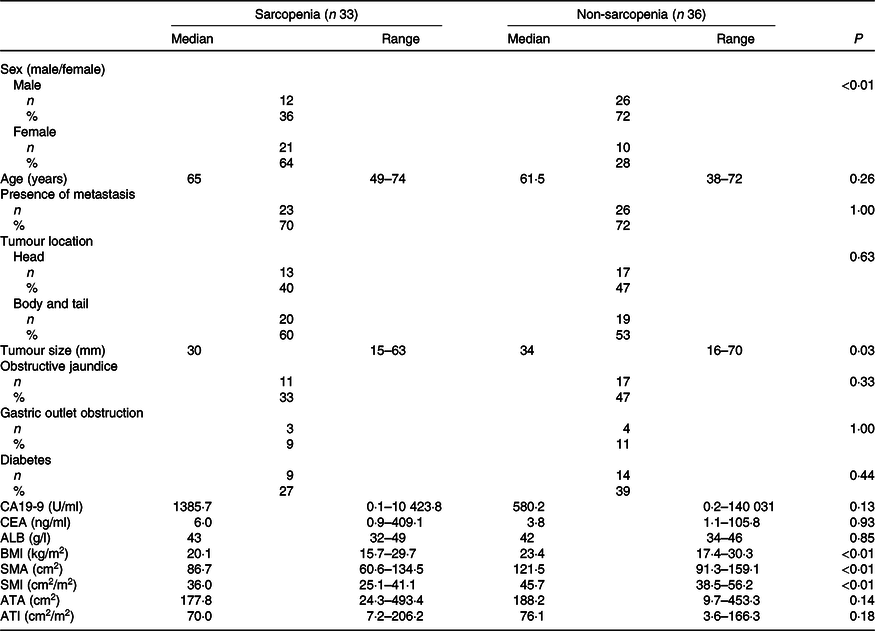
CA19-9, carbohydrate antigen 19-9; CEA, carcinoembryonic antigen; ALB, albumin; SMA, skeletal muscle area; SMI, skeletal muscle index; ATA, adipose tissue area; ATI, adipose tissue index.
Table 5. Response and relative dose intensity by FOLFIRINOX (FX) based on sarcopenia
(Numbers and percentages; median values and ranges)
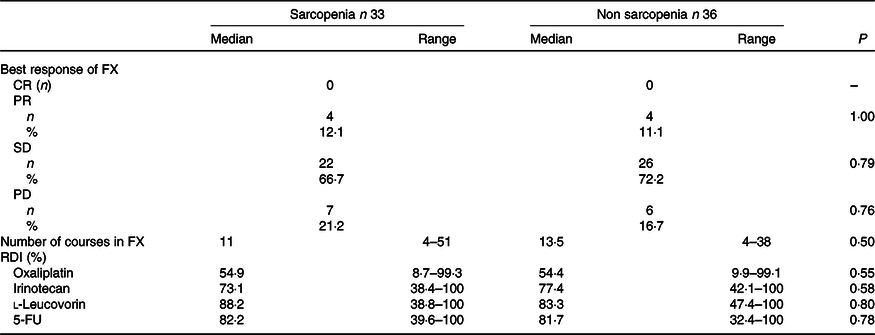
CR, complete response; PR, partial response; SD, stable disease; PD, progressive disease; RDI, relative dose intensity.
Table 6. Side effects of grade 3 or more by FOLFIRINOX based on sarcopenia
(Numbers and percentages)
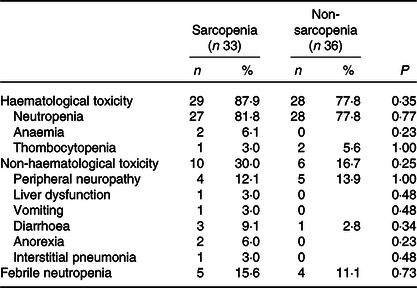
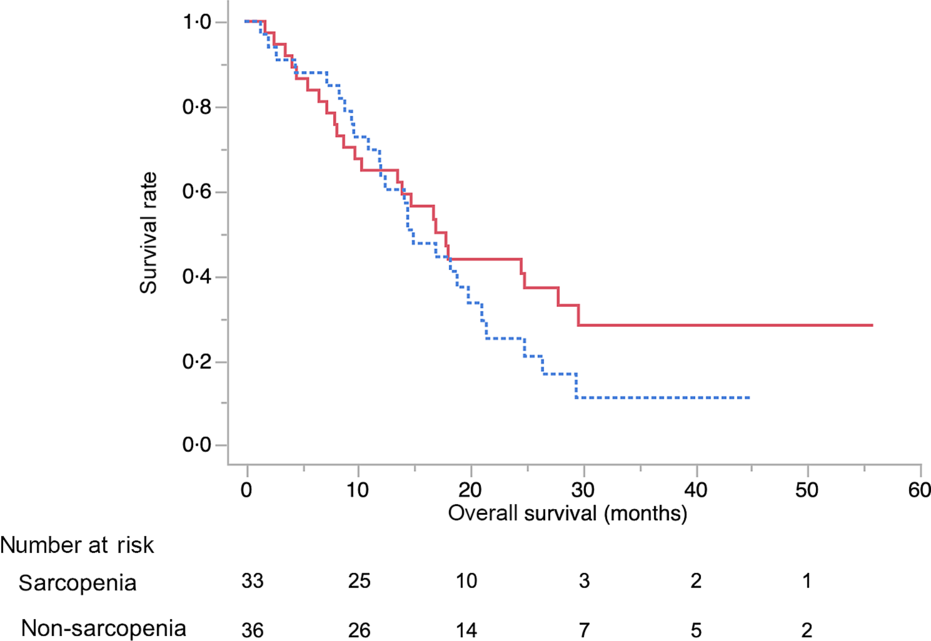
Fig. 1. Kaplan–Meier curves for overall survival between the sarcopenia (![]() ) group and the non-sarcopenia (
) group and the non-sarcopenia (![]() ) group at diagnosis. The median survival times were 14·9 months in the sarcopenia group and 17·8 months in the non-sarcopenia group (log-rank P = 0·33).
) group at diagnosis. The median survival times were 14·9 months in the sarcopenia group and 17·8 months in the non-sarcopenia group (log-rank P = 0·33).
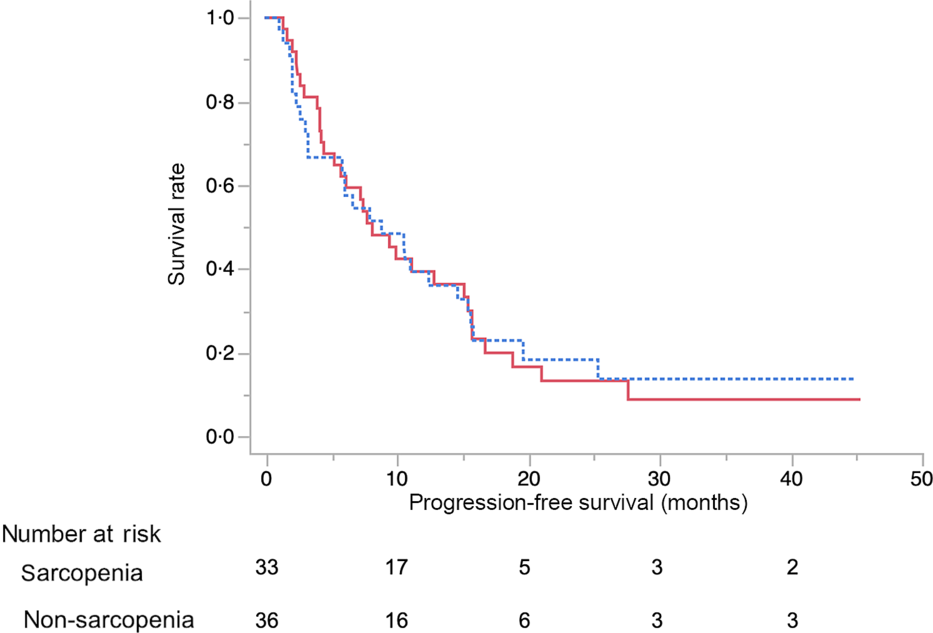
Fig. 2. Kaplan–Meier curves for progression-free survival during FOLFIRINOX therapy between the sarcopenia (![]() ) group and the non-sarcopenia (
) group and the non-sarcopenia (![]() ) group at diagnosis. The median progression-free survival times were 8·8 months in the sarcopenia group and 8·1 months in the non-sarcopenia group (log-rank P = 0·88).
) group at diagnosis. The median progression-free survival times were 8·8 months in the sarcopenia group and 8·1 months in the non-sarcopenia group (log-rank P = 0·88).
The results of the multivariate analysis of potential prognostic factors associated with the duration of survival such as age, sex, presence of metastasis, obstructive jaundice, gastric outlet obstruction, diabetes, tumour size, tumour location, serum levels of carbohydrate antigen 19-9 and carcinoembryonic antigen, BMI, albumin, uridine diphosphate glucuronosyltransferase A1 homozygous of *6 or *28 adipose tissue index at diagnosis, change in adipose tissue index, presence of sarcopenia at diagnosis, change in SMI and progressive disease at the initial assessment on CT are summarised in Table 7. Among these, progressive disease at the initial CT assessment (HR 3·87, 95 % CI 1·53, 9·67), decrease in SMI ≥ 7·9 % (HR 4·02, 95 % CI 1·87, 8·97) and carcinoembryonic antigen ≥ 4·6 (HR 2·52, 95 % CI 1·10, 6·11) were identified as significant independent risk factors for the duration of survival. There were thirty-seven patients (54 %) in whom the decrease in SMI was found to be ≥7·9 % at the initial CT after FX. The median OS in patients with SMI loss of ≥7·9 % and <7·9 % was 10·9 (95 % CI 8·1, 14·9) months and 21 (95 % CI 16·9, 27·8) months, respectively (P < 0·01) (Fig. 3).
Table 7. Multivariate analyses for survival duration
(Hazard ratios and 95 % confidence intervals)
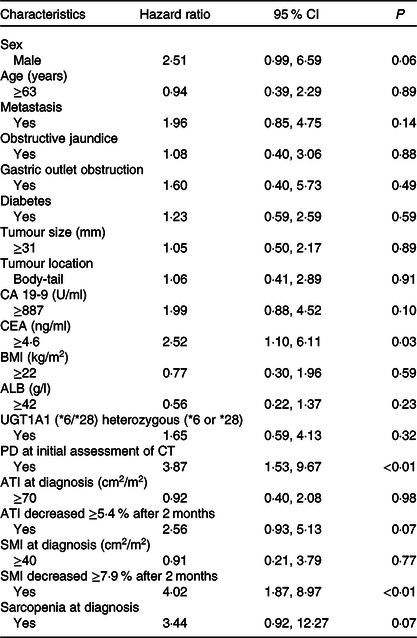
CA19-9, carbohydrate antigen 19-9; CEA, carcinoembryonic antigen; ALB, albumin, UGT1A1, uridine diphosphate glucuronosyltransferase A1; PD, progressive disease; CT, computed tomography; ATI, adipose tissue index; SMI, skeletal muscle index.
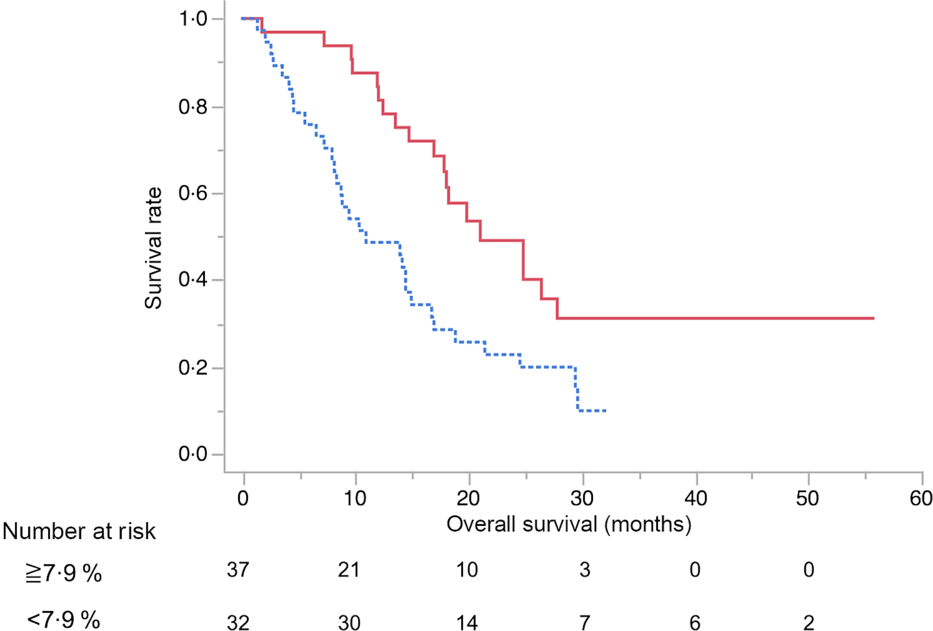
Fig. 3. Kaplan–Meier curves for overall survival between the skeletal muscle index decreased ≥7·9 % (![]() ) group and <7·9 % (
) group and <7·9 % (![]() ) group after 2 months from the start of FOLFIRINOX therapy. The median survival times were 10·9 months in the ≥7·9 % group and 21 months in the <7·9 % group (log-rank P < 0·01).
) group after 2 months from the start of FOLFIRINOX therapy. The median survival times were 10·9 months in the ≥7·9 % group and 21 months in the <7·9 % group (log-rank P < 0·01).
Discussion
Our study evaluated the impact of sarcopenia and decrease in SMM during FX therapy in sixty-nine patients with unresectable pancreatic cancer. The result of this retrospective study showed that sarcopenia at diagnosis did not significantly impact the rates of adverse events, PFS or OS. Furthermore, the multivariate analysis showed that sarcopenia at diagnosis was not an independent risk factor for the duration of survival in this study. However, progressive disease at the CT assessment after 2 months of FX therapy and decrease in SMI ≥7·9 % were identified as significant independent risk factors for survival. Patients with SMI loss of ≥7·9 % from the time of diagnosis to the initial evaluation after FX therapy had significantly lower duration of survival compared with SMI loss of <7·9 %.
Sarcopenia was reported to be associated with poor survival in patients with advanced pancreatic cancer receiving chemotherapy(Reference Kurita, Kobayashi and Tokuhisa15). Kurita et al. showed that sarcopenia at the time of diagnosis of advanced pancreatic cancer is an independent risk factor for poor survival following chemotherapy with FX (HR 3·85 (95 % CI 1·34, 11·04), P = 0·01)(Reference Kurita, Kobayashi and Tokuhisa15). However, in our cohort, sarcopenia at diagnosis was not an independent risk factor for survival (HR 1·38 (95 % CI 0·73, 1·38), P = 0·29). Our finding was inconsistent with this previous report. There might be a couple of reasons for that. The study by Kurita et al. did not use the standardised cut-off value for SMI to diagnose sarcopenia. Several cut-off values for SMI with wide variations have been reported by studies (36–55·4 cm2/m2 for men and 29–42·1 cm2/m2 for women)(Reference Daly, Ní Bhuachalla and Power9) and there is no consensus on the optimal cut-off values to define sarcopenia in patients with pancreatic cancer. Therefore, our study used the cut-off value for sarcopenia (SMI < 42 cm2/m2 for men and SMI < 38 cm2/m2 for women) defined by the Asian Working Group for sarcopenia(Reference Chen, Liu and Woo16), which included the Japanese population and used lower cut-off values than those of the Western population (52·4 cm2/m2 for men and 38·5 cm2/m2 for women on CT images at L3 level)(Reference Prado, Lieffers and McCargar12). The cut-off values of muscle mass and muscle strength in Asian populations might differ from those in Caucasians because of ethnicity, body size, lifestyle and cultural backgrounds(Reference Chen, Liu and Woo16). Furthermore, we believe our cut-off value for sarcopenia could not affect the study results, since SMI at the diagnosis was not an independent risk factor for OS in the multivariate analysis. Another possibility of the inconsistency between our study and the study by Kurita et al.(Reference Kurita, Kobayashi and Tokuhisa15) is a difference in the basic characteristics of the patients where our study cohort included more patients with better performance states. The patients with better performance states might be able to tolerate FX therapy regardless of the state of sarcopenia.
Consequences of sarcopenia including tolerance to chemotherapy have been evaluated and the incidence of adverse events in patients with sarcopenia is reported to be higher(Reference Cousin, Hollebecque and Koscielny17,Reference Prado, Baracos and McCargar18) . Since the dosage of chemotherapeutic agents is decided based on body surface area calculated from the height and body weight, sarcopenic obesity defined as high BMI or body fat mass despite sarcopenia could mask skeletal muscle wasting, leading to greater toxicity and potentially serious adverse effects of chemotherapy(Reference Kurita, Kobayashi and Tokuhisa15,Reference Prado, Baracos and McCargar18) . Several studies suggest that patients with sarcopenia or sarcopenic obesity develop more adverse effects during chemotherapy(Reference Cousin, Hollebecque and Koscielny17,Reference Prado, Baracos and McCargar18) . However, in our study, there was no significant difference in the rate of grade 3 or 4 adverse events including haematological and non-haematological toxicity between patients with or without sarcopenia at diagnosis. There was also no significant difference in PFS of FX between the two groups. This might be because our cohort included few patients with obesity as defined based on BMI; thus, our cohort had few patients with sarcopenic obesity. These results might suggest that sarcopenic obesity was also a factor affecting tolerance to chemotherapy.
Some studies have reported the impact of decrease in SMM during chemotherapy in patients with advanced pancreatic cancer(Reference Basile, Parnofiello and Vitale8,Reference Daly, Ní Bhuachalla and Power9) . Basile et al. reported early loss of SMM (in the first 3 months of first-line chemotherapy) >10 % has a negative impact on prognosis in patients of advanced pancreatic cancer(Reference Basile, Parnofiello and Vitale8). In our study, the decrease in SMM at 2 months (muscle loss of ≥7·9 %) during FX was an independent risk factor for poor OS (HR 2·50 (95 % CI 1·32, 4·88), P < 0·01). From these results, assessment of decrease in SMM over time during chemotherapy, and not only at the time of diagnosis, might be important in patients with advanced pancreatic cancer. Then, management of sarcopenia might be the next upcoming challenge. In our study, almost 50 % of the patients were diagnosed with sarcopenia at the baseline. Patients with pancreatic cancer are considered to have an associated gastrointestinal absorption disorder due to the compromised pancreatic exocrine function; moreover, active inflammation and higher energy consumption from the cancer itself could lead to sarcopenia(Reference Kurita, Kobayashi and Tokuhisa15). Several attempts, including nutritional support, for maintaining or increasing the SMM in patients with advanced cancer during chemotherapy have been reported; however, their outcomes are still unclear(Reference Basile, Parnofiello and Vitale8,Reference Caccialanza, Cereda and Pinto19–Reference Cox, Powell and Carter21) . Considering the results of such studies including this study, early nutritional interventions to maintain SMM might improve the prognosis for patients with advanced pancreatic cancers.
The present study has several limitations. First, it was a retrospective study with a relatively small sample size at a single centre; this could lead to a bias in patient selection and treatment strategy. Second, the threshold value of sarcopenia was defined based on Asian Working Group for sarcopenia(Reference Chen, Liu and Woo16). To date, no consensus exists on the optimal cut-off value to define sarcopenia in patients with cancer. At present, we think that the optimal cut-off value for sarcopenia in Asians should be used with the one reported by Asian Working Group for sarcopenia. In the future, it might be ideal if specific diagnostic criteria for sarcopenia could be made by medical condition or race.
In conclusion, sarcopenia at diagnosis did not affect OS, PFS and rates of adverse events in patients with advanced pancreatic cancer undergoing FX therapy. However, an early decrease in SMM was an independent risk factor for poor prognosis. Therefore, interventions including nutritional support to maintain SMM during FX therapy for advanced pancreatic cancer might be an important factor to improve survival.
Acknowledgements
We thank all patients, clinicians and support staff who participated in this study.
S. U. and T. I. wrote the manuscript. S. U., T. I., M. S., N. M., Y. I., H. I. and M. S. managed the patients.
The authors declare that there are no conflicts of interest.


