


Fe and iodine deficiencies are detrimental to maternal health and lead to fetal and infant growth retardation, stunting and impaired cognitive development(Reference Gayer and Smith1–Reference Bath, Steer and Golding3). Globally, deficiencies of Fe and iodine are the most common in women of reproductive age and children due to increased needs of the subgroups and poor quality of diets(Reference Gayer and Smith1,Reference Stewart, Iannotti and Dewey2) . Worldwide, 29 % of women and 43 % of children suffer from anaemia, 42 and 43 % of the reported anaemic cases in women and children, respectively, were attributed to Fe deficiency (ID)(4). Similarly, 30 % of children suffer from iodine deficiency using urinary iodine concentration (UIC) as a measure of iodine status, while estimates on women are unavailable due to insufficient data to directly estimate regional or global prevalence of low iodine intake in this important target group(Reference Andersson, Karumbunathan and Zimmermann5). Micronutrient deficiencies in Ghana, including Fe and iodine deficiencies, are a major problem(6–Reference Zimmermann and Hurrell11). About 21·5 and 39·6 % of women and children, respectively, suffer from ID. About 61·5 % of Ghanaian households use salt with no or insufficient iodine amounts. Ironically, iodised salt is the main source of dietary iodine intake. Currently in Ghana, iodine deficiency prevalence especially among women of reproductive age is unknown as there is no nationally representative data available on UIC(12). Non-availability of data is largely due to costly and laborious biomarkers or non-specific clinical examinations.
A recent study in Ghana indicates that 13·7 and 21·5 % of women and children, respectively, are Fe deficient(13), while 66 % of children and 42 % of women are anaemic(6). Within Ghana, the prevalence of anaemia and malnutrition is higher in northern Ghana (Upper East, Upper West, North East, Savannah and Northern regions) compared with the rest of the country(6,9,10,14) . To illustrate, the five northern regions (‘Northern belt’) had higher prevalence of anaemia (women: 27·6 %, children: 53·2 %), ID (women: 21·5 %, children: 39·6 %) and ID anaemia (women: 15·4 %, children: 29·0 %) compared with those in the southern regions for anaemia (women: 23·3 %, children: 32·3 %), ID (women: 13·6 %, children: 12·6 %) and ID anaemia (women: 9·2 %, children: 5·2 %)(13).
Vulnerability to iodine deficiency is commonly estimated by household usage of iodised salt in countries where iodised salt is the main source of iodine. Although Ghana introduced Universal Salt Iodisation in 1996, not all populations have and used iodised salt containing iodine at the recommended level(12). In 2014, about 38·5 % of Ghanaian households reported using iodised salt containing iodine at the recommended level(12). This percentage of households using adequately fortified iodised salt varies among regions: Western region (60 %), Accra (55 %), Ashanti (46 %), Brong Ahafo (35 %) to Northern (16 %) and Upper East (18 %) regions in Ghana(12). Urban areas are more likely to use adequately iodised salt (50 %) than rural areas (26 %)(12). These data may suggest a possible high prevalence of inadequate iodine intake in northern Ghana as iodised salt is the main source of iodine in this part of the country(Reference Kubuga, Abizari and Song15).
Among multifaceted causes of micronutrient deficiencies such as Fe and iodine, diet intake plays a key role(Reference Andersson, Karumbunathan and Zimmermann5,Reference Lynch16,Reference Humphries, Mosites and Otchere17) . Dietary consumption in Ghana is largely monotonous plant-based staple foods with limited nutrient-rich animal-sourced foods. The situation is compounded in the northern belt partly due to high poverty and household food insecurity prevalence(18); intake of diets consisting of staple cereals and vegetables with little or no animal products reduced quantities of food and micronutrients intake. In an attempt to reduce the resultant high prevalence of micronutrient deficiencies, it is vital to measure the associated risk for micronutrient deficiencies by non-invasive dietary intake approaches (which are lacking in Ghana), compared with costly and laborious biomarkers or non-specific clinical examinations. In some studies, dietary patterns (DP) predicted the associated risk of iodine deficiency in Ethopia(Reference Hassen, Beyene and Ali19) and did not explain the associated risk of anaemia or ID in Uganda(Reference Turyashemererwa, Kikafunda and Annan20). Currently, Ghana has no dietary assessment tools that are developed and validated by biomarkers. The aim of this study was to identify practical dietary assessment methods to predict Fe and iodine status of mother–child dyads. Studies among women of childbearing age are vital with respect to Fe and iodine indicators due to the biological roles Fe and iodine play in the life stages(Reference Valera-Gran, de la Hera and Navarrete-Munoz21–Reference Radlowski and Johnson24). Dietary approaches in this paper are neither intended to measure the use of iodised salt in the research settings nor its impact but dietary diversity as a tool to reflect micronutrient adequacy of women. Additionally, dietary diversity or pattern sometimes indicates social structure which may determine individuals’ consumption and the quality of diets being consumed.
Subjects and methods
This cross-sectional study was drawn from a community-based feeding trial (clinicalTrials.gov ID: NCT03754998)(Reference Kubuga, Hong and Song25) in which a total of 120 dyads were drawn from the upper east region and agreed to participate in a feeding trial. Optimal design software (version 3.01) was used to calculate the minimal adequate sample size of 100 dyads with a power of 80 %, significance level of 5 %, coefficient of determination of 65 %, minimum detectable effect of 0·33 of diet on Fe and iodine status and 20 % attrition rate. Reference for formulae used by this software can be found online(Reference Spybrook, Bloom and Congdon26). Details of research methods and recruitment have been published earlier(Reference Kubuga, Abizari and Song15,Reference Kubuga, Hong and Song25) . The drawn sample had three sets of twins, two dyads relocated before the completion of data collection giving 118 dyads with three sets of twins (118 mothers, 121 children). Data were collected from non-pregnant women aged 15–49 years and their toddlers (6–23 months) sampled from five communities in two districts in the Upper East region (Kassena Nankana West and Builsa North Districts) between May and June 2016.
The dyads were drawn using community-based birth registers at Community-Based Health Planning and Services compounds kept by community health nurses/volunteers. Announcements were then made through the community chiefs/leaders in the respective communities for all women with children younger than 5 years of age to meet at their respective community health centres. The research team briefed the women and the community leaders on the study. Names that were shortlisted from the birth registers and other sources were read-out. Dyads were contacted individually to check on their willingness to be part of the study through the community health volunteers and community health nurses. Participants voluntarily agreed to be part of the research by signing/thumb printing a written consent or assent forms, parents/guardians consented for underage mothers or minors by signing/thumb printing a written parental consent form. Verbal consent was sought from spouses of women who were willing to be part of the study for cultural reasons. As such, only women who consented and whose spouses also consented, had consent from guardians (underage mothers), were lactating, were not pregnant and had a child aged 0–24 months participated in the study.
Measurements and data collection
Malaria testing
Rapid malaria diagnostic cassettes (lot: 05CDB050DA, Standard Diagnostic, Inc.) were used to test for malaria status for all research participants. Malaria status was assessed based on the presence of histidine-rich protein-2 in whole blood. Histidine-rich protein-2 is known to be specific to Plasmodium falciparum, which causes more than 90 % of malaria cases in Ghana(Reference Asante, Zandoh and Dery27). Sensitivity and specificity of cassettes were 95 and 99·5 %, respectively. For quality control, researchers used rapid malaria diagnostic cassettes with the same lot number. Blood smears of samples from individuals with positive (20) and negative (20) rapid malaria diagnostic cassettes’ results were compared to confirm their sensitivity and specificity before they were used for the research. Malaria status was tested as it could be a confounder in predicting Fe status. Malaria was of particular importance as the study area is malaria endemic. Additionally, malaria also affects appetite, comes along with diarrhoea, nausea and vomiting(Reference Aju-Ameh, Awolola and Mwansat28) which inadvently may affect food/nutrients (iodine inclusive) intake.
Anthropometry
Mother–toddler dyads weights and heights were measured according to standard procedures(Reference Cogill29). An electronic scale (Serial number 5874030154862, model 874 1321009. Seca GmbH & Co. KG) was used to measure weights to the nearest 0·1 kg. Height was measured by Seca 217 (Seca GmbH & Co. KG) and UNICEF baby/child length/height measuring board for children who could not stand according to standard procedures(Reference Cogill29,30) . Shoes and heavy clothes were removed during measurements for all participants. Children’s height-for-age z-score and weight-for-height z-score were calculated using AnthroPlus with WHO growth standards. Heights of children were measured in the recumbent position. Heights of children who refused to lie down or for some other reasons were measured in the standing position (such heights were adjusted by adding 0·7 cm)(Reference Cogill29,30) . To ensure quality of data, two trained data collectors were recruited to take anthropometric data. Weighing scales were routinely calibrated using standard weights.
Questionnaire/interview
Food intake data were collected through a structured interview aimed at capturing detailed qualitative information about all foods and beverages consumed by the respondent in the past 24 h. Predetermined list of foods were not provided to minimised recall bias. Each mother reported her 24-h food intake recall and that of her child on the day and night preceding the interview with guidance from researchers. All recalls were documented by researchers. Information on socio-demographic characteristics (religion, ethnicity, mother’s age and height, child’s age and height, mother’s occupation, household wealth index, household head’s age and sex, number of children and adults in household, kind of salt used in household, mother’s participation level in household purchasing decision-making) was also taken via interviews by study staff. Wealth index and women’s decision-making in household were adopted per the Demographic and Health Survey approach(Reference Rutstein31). Wealth index was computed using principal component analysis by subjecting households’ possession and non-possession of predetermined assets and services enumerated by the Demographic and Health Survey questionnaire(Reference Rutstein31). All assumptions were checked.
Biochemical measurements
From each subject, 5 ml of whole blood was drawn into silica-coated serum separator vacutainers (Lot: 20140618, Anhui Kangning Industrial {Group} Co. Ltd) and held at ambient temperature both on the field and during transportation to ensure quality of samples. Serum was separated using a centrifuge (Hettich) at 500 g for 5 min at room temperature was aliquoted, kept frozen at –18°C (Thermo Fisher Scientific) at Navrongo Health Research Center (NHRC) and then transported on dry ice to Medical Diagnostics Services – Lancet Laboratories in South Africa for serum transferrin receptor (sTfR) analysis. The laboratory is ISO/IEC certified and accredited. ID was classified as sTfR > 4·40 mg/l for women and sTfR > 2·85 mg/l for children, Medical Diagnostics Services – Lancet Laboratories reference. Hb levels were checked on the field using a HB 201 analyzer according to prescribed procedures.
Content of iodine (0 parts per million (ppm), <15 ppm and ≥15 ppm) in households’ salts brought by women was tested using validated Rapid Test Kits (batch no. M 050, MBI KITS International) according to prescribed procedures. Change of colour that indicates iodine concentration was compared with the Rapid Test Kit charts and recorded. Spot urine samples of participants were taken and analysed at Noguchi Laboratory-Ghana. Participants were given plastic bottles with tight coverings in the evening preceding the interview day to collect morning urine on the interview day; samples were received the same morning. UIC was analysed using the Sandell–Kolthoff (acid-digestion) reaction(Reference Hedayati, Ordookhani and Daneshpour32,Reference Hedayati, Khazan and Yaghmaee33) , and results were expressed as μg of iodine per litre. The inter-assay CV in the laboratory is 6 %. Urine samples were held at ambient temperature on the field and during transportation to NHRC. The samples were stored at −18°C for 4 months at NHRC and then transported on dry ice to Noguchi laboratory for UIC analysis. The laboratory is certified for its quality control by the CDC’s EQUIP programme. We assessed the iodine status of the study population using median UIC and also by the prevalence of <50 μg/l UIC(34).
Diet assessment
Dietary diversity score (DDS) (0–10) for women and a score of 0–7 for toddlers were calculated from the 24-h dietary recall according to the 2016 recommended guidelines(Reference Kennedy, Ballard and Dop35,36) . A score of ≥5 and ≥4 reflects the micronutrients adequacy of women’s and children’s diet, respectively. Cut-off DDS for women in this study was ≥4 instead of ≥5 for our analysis due to very small proportion of the women having a DDS ≥ 5. The ten food groups classification includes: grains, white roots and tubers, and plantain; pulses (beans, peas and lentils); nut and seeds; dairy products; meat, poultry and fish; eggs; dark green vegetables; other vitamin A-rich vegetables; other vegetables; and other fruits(Reference Kennedy, Ballard and Dop35,36) . A score of 1 was assigned for consumption of the food group and a score of 0 for non-consumption of the food group. The seven food groups for children were grains, roots and tubers; vitamin A-rich fruits and vegetables; other fruits and vegetables; fleshy foods (meat, chicken, fish); eggs; dairy products; and legumes and nuts(Reference Kennedy, Ballard and Dop35,36) . For the women and their children, food items likely to be consumed in <15 g quantity were excluded from counting in the score. Using these criteria, milk was not counted as only milk creamers were consumed in very minute amounts. Similarly, fish consumption was mainly fish powder added to household soup and was not counted. In addition to the in-depth knowledge of diets in the research settings, earlier studies on DDS support the criterion of eliminating food groups consumed in minute amounts specifically in Ghana(Reference Ruel37). It is worth noting that the eliminated foods (fish powder and milk) could be a good source of iodine but this was not the case in our study. The milk powders did not have iodine on their nutrition labels. Our preliminary assessment and in-depth knowledge of diets in the research setting indicated very minute consumption of fish powder. Fish was processed by open sun drying in high temperatures and sold in open containers under similar conditions. Additionally, the fish was largely obtained from lakes and not the sea, and the presence of iodine could not therefore be guaranteed. None of the women consumed meat in the previous 24 h. When only tomatoes were mentioned in mixed dishes, without other vegetables in ‘other vegetables group’, they were not counted per the criterion of eliminating minute consumptions. Our preliminary assessment and in-depth knowledge of diets in the research setting indicated very minute consumption of tomatoes in such diets.
Statistical analysis
Optimal design software (version 3.01) was used to calculate the minimal adequate sample size of 100 dyads with a power of 80 %, significance level of 5 %, coefficient of determination of 65 %, minimum detectable effect of 0·33 of diet on Fe and iodine status and 20 % attrition rate. Details of research methods and recruitment have been published earlier(Reference Kubuga, Abizari and Song15,Reference Kubuga, Hong and Song25) . Data analyses were carried out using SAS 9.4 (SAS Institute Inc.). Socio-demographic characteristics and health indicators of participants were described using frequency distributions, means and standard deviations, medians and interquartile ranges, 95 % CI and adjusted OR.
DP of women and children were identified by analysing food items reported in the 24-h recalls using principal component analysis as the extraction procedure(Reference Hatcher and O’Rourke38). Principal components are linear combinations of the input variables and explain the variation in the data. Each component describes a DP, and the linear combination gives room for the calculation of a component score for each woman/child. In determining the number of factors for retention, multiple methods were used (parallel analysis, visual scree plots and literature search). Varimax rotation was used to help in the interpretation of components. Factor adequacy was established a priori, pattern coefficients ≥ 0·40 were considered salient and practically significant. Complex loadings salient on more than one factor were rejected in the interest of parsimony and to be in consonance with simple structure. Components with single variable loading were also rejected. Factors with at least three salient pattern coefficients and internal consistency reliability ≥0·70 were considered adequate. Internal reliability was checked by using factors loadings at Cochran’s α level ≥0·60.
Multivariable logistic regression models were used to examine whether DDS, DP and socio-demographic factors predict the associated risk of Fe and iodine deficiencies in mother–toddler dyads. Covariates were simultaneously adjusted in the multiple regression analysis. Dependent variables of interest were ID and iodine deficiency (UIC < 50 μg/l). It is worth noting that for sTfR, we had one missing value each for mothers and toddlers which were excluded in our analysis due to inadequate sample volume for such analysis. Additionally, fifty-two and fifty-five participants’ UIC values, respectively, for mothers and toddlers were missing due to inadequate sample volume for such analysis. Participants with missing variables were not significantly different from the other participants when socio-demographic variables were compared. Participants with missing data were excluded from analysis. In the multiple logistic regression analysis, covariates were chosen a priori. Malaria was dummy – absent and present, household wealth index was divided into three categories (lower, middle and upper), household salt content was classified into two (no iodine, iodine), BMI was categorised into two (underweight/normal, overweight/obese), participation in household’s purchasing decision-making was categorised into two (below average, above average), and continuous variables were age, number of adults and children under 5 years in a household.
Ethics
Research procedures were in accordance with the Michigan State University’s Institutional Review Board and Navrongo Health Research Centre (NHRC) Institutional Review Board in Ghana. Pre-approval from the two Institutional Review Board was obtained (Michigan State University: Institutional Review Board no. 16-448 and Navrongo Health Research Center – Ghana: NHRCIRB220).
Results
Socio-demographic characteristics and health indicators (weight, height, sTfR level, Hb level, iodine status, malaria status, anaemia and Fe status) of childbearing age women and their toddlers are summarised in Table 1. Mean values of mothers’ age, BMI and sTfR were 26 years, 22 kg/m2 and 4·9 mg/l, respectively. Toddlers’ mean age was 13 months, height-for-age z-score was 0·01 and sTfR level was 9·5 mg/l. The majority of the participants were farmers (69 %), Kasena (51 %) and Christians (77 %). Most of the households had: male heads (93 %), no iodised salt (90 %), average wealth index (34 %) and animals living in same compound with household members (92 %). On health indicators, 48 % of the women were Fe deficient, 27 % had ID anaemia, 36 % had UIC < 50 μg/l, 53 % had deficient Hb levels and 10 % tested positive for malaria. Among the toddlers, most of them were Fe deficient (98 %), ID anaemia (88 %), iodine deficient – UIC < 50 μg/l (29 %) and Hb deficient (91 %). On the contrary, few toddlers had malaria (8 %) and 8 % were stunted. The median UIC, which is the usual standard for iodine status for a population, indicated that the children had adequate iodine status (median UIC > 100 μg/l). On the contrary, women had inadequate iodine status (median UIC < 100 μg/l). Summary of DDS distribution among mother–toddler dyads in Table 2 indicates a score range of 0–6 for women and 0–4 for toddlers. Mean DDS was 3·6 for mothers and 2·4 for toddlers. Food groups commonly or usually consumed by the women include: ‘grains, white roots and tubers, plantain’; ‘dark green leafy vegetables’; and ‘nuts and seeds’, while ‘grains, white roots and tubers, plantain’ and ‘legumes and nuts’ food groups are the usually consumed food groups among the children.
Table 1. Demographic characteristics and health indicators of mothers (15–49 years) and their toddlers (6–23 months) during the dry/lean season in northern Ghana (Mean values and standard deviations; numbers and percentages; medians and interquartile ranges (IQR))

sTfR, serum transferrin receptor; HAZ, height-for-age z-score; WHZ, weight-for-height z-score; ppm, parts per million; UIC, urinary iodine concentration; IDA, Fe-deficiency anaemia.
* Traditionalist: practitioners of African traditional religion; Decision-making: women participation in household decision-making. IDA: concurrent presence of Hb and Fe deficiencies. Median UIC < 100 μg/l indicates iodine deficiency in a population. Percentages may not sum up to 100 % due to rounding off of decimals.
Table 2. Dietary diversity score (DDS) distribution of mothers (15–49 years) and their toddlers (6–23 months) during the dry/lean season in northern Ghana* (Mean values and standard deviations; numbers and percentages)
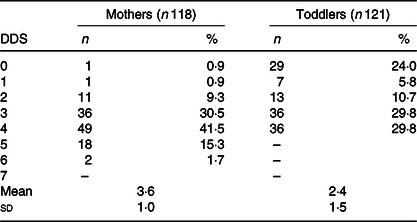
* DDS 0 indicates an individual had no consumption of any of the food groups in the previous 24 h (this is not unusual in the lean season). DDS 0 for children meant they only had breast milk in the previous 24 h.
In Table 3, we modelled the probability of being Fe deficient and adjusted for the stated covariates (DDS, BMI, household wealth index, household iodised salt usage, woman’s age, number of adults and children <5 years in household, involvement in household decision-making) without malaria (model 1) and with malaria (model 2). Both models showed significant associated risk (P = 0·038), where women with DDS < 4 had 1·82 times the odds of having ID (95 % CI 1·03, 3·21). Underweight women and women with normal weight had 0·42 times the odds of being Fe deficient (P = 0·049, 95 % CI 0·18, 0·99). Household wealth index, household iodised salt usage, woman’s age, malaria status, number of adults and children in household, involvement in household decision-making did not show significant associated risk of ID. ID-associated risk analysis in toddlers was not feasible as nearly all the children (97·5 %) were Fe deficient (Table 1).
Table 3. Risk of iron deficiency and its determinants among mothers (15–49 years) during the dry/lean season in northern Ghana (Adjusted odds ratios (AOR) and 95 % confidence intervals)
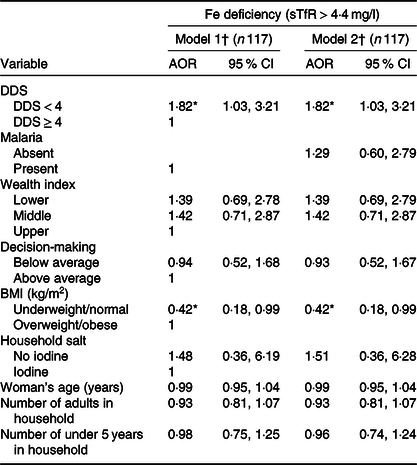
sTfR, serum transferrin receptor; DDS, dietary diversity score.
* P < 0·05: Fe deficiency: sTfR > 4·4 mg/l.
† Model 1: adjusted for household wealth index, household iodised salt usage, woman’s age, number of adults and children in household, involvement in household decision-making. Model 2: model 1 + malaria.
In Table 4, we modelled the probability of being iodine deficient and adjusted for the same covariates as in the Fe analysis (Table 3). Both models showed significant associated risk (P < 0·0001), women with DDS < 4 had 9·32 (95 % CI, 3·11, 27·91) and 9·73 (95 % CI, 3·19, 29·67) times the odds of being iodine deficient in models 1 and 2, respectively. Poor participation of women in household’s purchasing decision-making, number of adults and children under 5 years, and increment in age of women increased the associated risk of iodine deficiency. Ironically, women from households whose salt tested negative (0 ppm) for iodine had 88 and 87 % lower odds for iodine deficiency in models 1 and 2, respectively, although the reverse was expected. BMI showed significant associated risk (P < 0·0001), underweight/normal-weight women had 89 % lower odds of iodine deficiency in both models 1 and 2. Household wealth index and malaria did not show significant associated risk. Associated risk of iodine deficiency was not assessed among toddlers as their median UIC ≥ 100 μg/l indicated adequate iodine intake among the toddlers.
Table 4. Risk of iodine deficiency and its determinants among mothers (15–49 years) during the dry/lean season in northern Ghana (Adjusted odds ratios (AOR) and 95 % confidence intervals)

UIC, urinary iodine concentration; DDS, dietary diversity score.
* P < 0·05: iodine deficiency: UIC < 50 μg/l.
† Model 1: adjusted for household wealth index, household iodised salt usage, woman’s age, number of adults and children in household, involvement in household decision-making. Model 2: model 1 + malaria. Note: multivariable logistic regression was used for the analysis.
Two DP were identified (Table 5) by principal component analysis with seventeen food items or groups among women. Only one DP emerged for the toddlers using the same seventeen food items or groups. These DP were named according to food group factor loadings: ‘rural elites diet’ and ‘indigenous diet’. The ‘rural elites diet’ pattern was characterised by high intake of tea, sugar, milk creamers and fish powder/condiments and explained 1·97 % of the total variance, while the indigenous diet pattern was characterised by dark green vegetables, grains, legumes and wild fruits; it explained 1·84 % of the total variance. The indigenous diet pattern in the children was characterised by the same foods as in the adults with an addition of fats and oils food group. In the research settings, fats and oils were commonly added to children’s diet to increase energy- and fat-soluble vitamins intake. Factor scores (DP scores) were categorised into tertiles using PROC RANK.
Table 5. Rotated factor pattern (24-h dietary recall) among mothers (15–49 years) and their toddlers during the dry/lean season in northern Ghana*
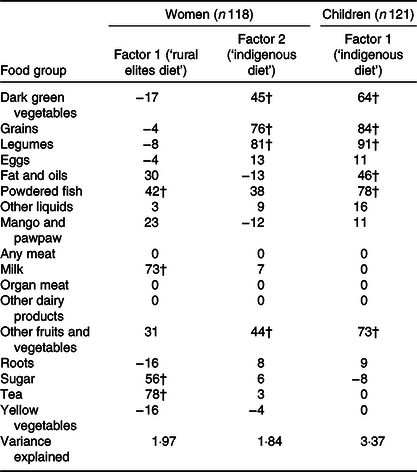
* Food groups were adopted from Ghana Demographic Health Survey food intake questionnaire/food groups classification. Printed values are multiplied by 100 and rounded to the nearest integer.
† Values greater than 0·4 are flagged.
We modelled the probability of being Fe and iodine deficient across women DP in three models (Table 6): crude comparison (model 1), model adjusted for household wealth index, BMI, household iodised salt usage, woman’s age, number of adults and children in household (model 2), and model 3: model 2 plus malaria. Women in the middle tertile for ‘rural elites diet’ had 8·71 (95 % CI 1·79, 42·31) and 8·65 (95 % CI 1·76, 42·39) times the odds of being Fe deficient in model 2 and model 3, respectively, when compared with the upper tertile. Women in the middle tertile for ‘indigenous diet’ had 6·09 (95 % CI 1·34, 27) and 6·08 (95 % CI 1·34, 27·69) times the odds of being Fe deficient in models 2 and 3, respectively; P trend however shows non-significance. On iodine deficiency-associated risk, women in the lower tertile for ‘indigenous diet’ had 9·41 (95 % CI 1·29, 68·43) and 11·41 (95 % CI 1·36, 95·97) times the odds of being iodine deficient in models 2 and 3, respectively. Crude comparison indicated insignificant associated risk of Fe and iodine deficiencies in ‘rural elites diet’ and ‘indigenous diet’. There was no significant associated risk relationship between toddlers’ DP tertiles and toddlers Fe and iodine deficiencies (data not shown).
Table 6. Iron deficiency and iodine deficiency across dietary pattern scores tertiles among mothers (15–49 years) during the dry/lean season in northern Ghana† (Odds ratios, adjusted odds ratios (AOR) and 95 % confidence intervals)

sTfR, serum transferrin receptor; UIC, urinary iodine concentration.
* P < 0·05.
† Model 1: crude association between Fe deficiency (sTfR > 4·4 mg/l, n 117), iodine deficiency (UIC < 50 μg/l) and dietary patterns scores tertiles. Model 2: adjusted for household wealth index, BMI, household iodised salt usage, woman’s age, number of adults and children in household. Model 3: model 2 + malaria. Note: multivariable logistic regression analysis was used in model analysis. Factor scores (dietary pattern scores) were categorised into tertiles using PROC RANK.
Discussion
In developing countries, dietary approaches have not been developed to screen populations at risk of Fe and iodine deficiencies. The use of dietary approaches to assess population vulnerability is simple and cheaper than biochemical or laboratory approaches. This is largely due to incomplete food composition tables. With limited information on food composition tables, we could leverage on synergistic or antagonistic effects of meals by using dietary approaches such as dietary DP or DDS. Meals consumed habitually consist of diverse foods containing complex combinations of nutrients that may be interactive, synergistic or antagonistic(Reference Mozaffarian, Rosenberg and Uauy39). Studying food-based approaches may have important public health implications because overall patterns of dietary intake might be simpler than nutrients or food components for the public to translate into diets(Reference Mozaffarian, Rosenberg and Uauy39). We demonstrated that DDS and DP are associated with the risk of Fe and iodine deficiencies in women of reproductive age.
In developing countries, DDS is often used to predict the micronutrient adequacy of the diet(Reference Korkalo, Erkkola and Heinonen40–Reference Moursi, Arimond and Dewey44) with little known about whether or not DDS can predict levels of biochemical indicators of micronutrient status. In this cross-sectional study, DDS < 4 had higher odds of Fe and iodine deficiency, DP significantly predicted the associated risk of Fe and iodine deficiency in women but not in toddlers. Our findings on DDS are contrary to the findings of a similar study in Mozambique(Reference Korkalo, Erkkola and Heinonen40). Korkalo and colleagues reported that DDS could not predict micronutrient status (Fe: Hb and serum ferritin, and folate) of women, except for Zn during the hunger season(Reference Korkalo, Erkkola and Heinonen40). Our findings on DDS was also contrary to a Cambodian study in which dietary diversity status was not associated with Fe status(Reference McDonald, McLean and Kroeun45). Though further research is needed, this makes our finding relevant to measuring the associated risk for micronutrient deficiencies in rural northern Ghana. It was also interesting to note that overweight/obese women, women who had poor participation in household purchasing decision-making, and increment in women’s age, number of adults and children in a household had higher odds of iodine deficiency. It is also worth indicating that in our research settings, diets are monotonous and based on a small number of plant foods(Reference Cercamondi, Icard-Vernière and Egli46) as is the case in most developing countries(Reference Amugsi, Lartey and Kimani-Murage47). Based on the monotony of the diet, one 24-h recall is enough to approximate routine or usual food intake in this setting. The non-significant findings in toddlers may be due to consumption of breast milk as their source of nutrients(Reference Kubuga, Abizari and Song15,Reference Kubuga, Hong and Song25) .
In this study, two DP were identified for women (DP 1 and DP 2) and one DP (DP 2) for toddlers. DP 1 (‘rural elites diet’) is characterised by a high intake of tea, sugar, milk creamers and fish condiments, and DP 2 (‘indigenous diet’) is characterised by dark green vegetables, grains, legumes and wild fruits. The toddlers had only ‘indigenous diet’. The characterised DP are similar to a study among schoolchildren in Ghana that identified two DP (sweet tooth pattern, traditional pattern)(Reference Abizari and Ali48). In our study, the two DP explained 4 % of the variance which is seemingly low but not unusual(Reference Parsons, Papachristou and Atkins49). The finding of seemingly low variance was similar to studies in the UK(Reference Hamer, McNaughton and Bates50), New Zealand(Reference Jayasinghe, Breier and McNaughton51) and Hong Kong(Reference Chan, Leung and Woo52). It is worth noting that the percentage variance explained by individual DP is a function of the number of food groups or variables included in the factor analysis.
The two DP point to social structure are the rich consuming refined sugars/teas and the poor consuming staple vegetables and grains. Toddlers’ DP is largely being explained by the nature of complementary foods being based on cereal grains in the research setting. The risk of ID associated with the ‘rural elites diet’ could be largely due to the consumption of added sugars, tea, and non-consumption of Fe-rich foods (dark green leafy vegetables and legumes) in the research settings. It is interesting to note that, the insignificant relationship of ID-associated risk in tertile 1 when compared with tertile 3 may be due to diverse factors including less consumption of the sugar- and tea-based diet – implying less consumption of tannins and Fe absorption inhibitors in tea. This may reduce the risk associated with ID. In the case of tertile 2, it is worth noting the two DP point to social structure, the rich consuming refined sugars/tea (DP 1) and the poor consuming staple vegetables and grains (DP 2). The explanation for tertile 2 showing a higher associated risk of ID when compared with tertile 3 could be 2-fold: (1) consumption of sugar- and tea-based diet in tertile 2 is relatively higher than consumption in tertile 1, and (2) individuals in tertile 2 have less income (compared with tertile 3) to obtain other Fe-rich foods and health care. These two reasons may increase the risk associated with ID. To fully understand the observed associations, further research is needed on DP and ID. The non-significant association of DP 1 to iodine deficiency risk points partially to households’ ability to purchase iodised salt in rural communities. Iodised salt is one of the key sources of iodine in the research settings, the strong association of the ‘indigenous diet’ and iodine deficiency may be a better predictor of iodine status in rural settings as we see an inverse association between household iodised salt usage and iodine deficiency in our results. The inverse association might be due to diverse reasons: respondents could have purchased or borrowed iodised salt for the purposes of the research due to social desirability, improper storage of iodised salt, individuals could have shared salts which do not truly represent household usage. This calls for further research on household salt usage and iodine status in the research settings.
The strengths of our study were the use of DDS/DP to predict Fe and iodine status using the biochemical indicators of the micronutrients. The study serves as a basis for population level measurement of the associated risk for Fe and iodine deficiencies. To the best of our knowledge, our study is the first to use DDS and DP to predict the biochemical indicators of the Fe and iodine in our research settings. This study could thus serve as the basis for further research into the development of dietary screening tools for micronutrients in Ghana.
We acknowledge limitations in our study. Limitations of self-report dietary surveys such as recall bias, and social desirability could have influenced our findings. Although the DP approach can help capture the complexity of diet, the complexity poses researchers’ bias or subjective interpretation when DP are labelled or named. The interpretation of these results may be limited to settings or populations similar to northern Ghana.
Conclusion
DDS and DP are associated with the risk of Fe and iodine deficiencies in vulnerable populations and may serve as a basis for further research into the development of dietary screening tools for micronutrients in Ghana. DP appeared to be a better predictor of iodine status in rural settings than the use of iodised salt by households. These findings may provide scientific bases to guide recommendations and policy making on programmes targeted at reducing the risk of Fe and iodine deficiencies in northern Ghana and similar settings.
Acknowledgements
We acknowledge the support of GHS, NHRC, Nutritional Science Department – University for Development Studies – Ghana, the Sakaa and Chania communities in the Kessena Nankana West district and the communities (Chuchuliga-yipaala, Azoayeri and Awulansa) in the Builsa North district of Ghana. To our research participants, we are most grateful. We acknowledge the support of Mr. Ambrose Atosona, Community health nurses (Augustine, Charles, Dauda and Abraham) and nutrition officers (Bantiu Cabral, Boah Michael, Gloria Kobati) for their support on the field.
This study was funded by USAID through Borlaug Higher Education in Research and Agricultural Development (BHEARD) and Borlaug Leadership Enhancement and Agricultural Program (LEAP).
C. K. K. conceptualised the study, carried out the data collection, conducted the analyses and wrote the draft manuscript. G. K. critically reviewed the manuscript and guided the dietary diversity data analysis. W. O. S. guided the data collection and manuscript development and revised the manuscript. All authors have reviewed the submitted manuscript and approved its current form for submission in the journal.
The authors declare no conflicts of interest.
Supplementary material
For supplementary material referred to in this article, please visit https://doi.org/10.1017/S0007114520000604


