


Micronutrient deficiency is a form of malnutrition, in the same way as under-nourishment or over-nourishment(1). However, unlike the other two forms of malnutrition, it is sometimes less visible and may appear in addition to other form of malnutrition, including obesity(Reference Kaidar-Person, Person and Szomstein2). It is considered as a major public health issue as it affects 2 billion people worldwide and has serious and sometimes irreversible health impacts(Reference Bailey, West and Black3,Reference Ritchie and Roser4) . Even in high-income countries, nutrient deficiency remains the other side of the coin of the nutritional quality of the diet, and there are growing concerns with respect to vulnerable sub-populations.
Assessing the risk of micronutrient deficiency using nutrient intake data would be an effective way to estimate the risk in a population and take public health actions consequently(Reference Muthayya, Rah and Sugimoto5). However, to our knowledge, no index currently focuses specifically on assessing the risk of developing nutritional deficiency. There are many diet quality indices that assess the potential impacts of diet on the health of individuals and study adherence to food-based dietary guidelines(Reference Wirt and Collins6,Reference Arvaniti and Panagiotakos7) . These indices are generally based on food-based indicators and/or nutrient-based indicators(Reference Kant8).
Increasing importance has been given to food-based indices for defining diet quality because there is a growing evidence that long-term health is more realistically and confidently reflected by the overall characteristics of a diet(Reference Kant9). However, these scores are not focused on nutrient intake and do not allow to directly study the risk of micronutrient deficiency. By contrast, nutrient-based assessments remain important in terms of fundamental relationships in nutrition, and notably the detection of poor diet quality due to insufficient nutrient intake, which is important for short-term health.
Nutrient-based indices are generally based on nutrient adequacy ratios and mean adequacy ratios(Reference Kant8,Reference Madden and Yoder10,Reference Jun, Zeh and Eicher-Miller11) or on the probability of adequacy of nutrient intakes using a probabilistic approach(Reference Carriquiry12–Reference Arimond, Wiesmann and Becquey15). They may be more difficult to implement than food-based indices, because they require extensive dietary records and food composition tables(Reference Trijsburg, Talsma and de Vries16). They need to refer to recommended intakes of selected nutrients, but there are different criteria that can be used to define nutrient requirements and then estimate these reference values(13). Nutrient requirements are usually defined using higher nutritional criteria than those which prevent the risk of onset of clinical signs of deficiency. Indeed, the requirements can be set so as to maintain a sufficient store of the nutrient or to maximise metabolic/physiological markers(13) and may even also take account of the long-term risks of developing a chronic disease(Reference Otten, Hellwig and Meyers17).
Therefore, existing diet quality indices are more designed to measure overall diet quality and associations with long-term health outcomes rather than nutritional status and the acute risk of nutrient deficiency. There is a need for such an index that aggregates risk estimates of micronutrient deficiency, a nutrient security index that uses more stringent reference values that are associated with the appearance of clinical signs of deficiency. Such an indicator also appears critical for studying ongoing nutritional transition which changes the risk of nutrient shortage.
Our objective was to develop a score that focuses on the risk of nutritional deficiency in adults, by only selecting micronutrients for which a serious clinical deficiency is referenced and using a probabilistic approach to estimate the risk of developing such a deficiency. The content and construct validity of this index was then assessed using data from two French surveys, one from a national representative population and a second with a large number of participants which offered a wide variety of socio-demographic profiles.
Methods
Population data
The data used for the present study came from the Third Individual and National Study on Food Consumption (INCA3, 2014–2015) and the NutriNet-Santé cohort study (2009, ongoing).
The INCA3 is a French nationwide and representative cross-sectional survey, which has been fully described elsewhere(Reference Dubuisson, Dufour and Carrillo18). The INCA3 study was carried out in accordance with the Declaration of Helsinki guidelines and was approved by the ‘Comité Consultatif sur le Traitement de l’Information en matière de Recherche dans le domaine de la Santé’ (Advisory Committee on Information Processing in Health Research). Verbal consent was obtained from, witnessed and formally recorded for all subjects. Briefly, dietary data were collected using three non-consecutive validated 24-h dietary recalls over a 3-week period. Professional investigators were responsible for collecting the dietary records by telephone, and participants were not aware of the days of recall. The nutrient contents of food items came from the 2016 database of the French Centre d’Information sur la Qualité des Aliments (CIQUAL). Socio-demographic questionnaires were also completed, by administered face-to-face questionnaires. Under-reporters for energy intake (EI) were excluded using the Black’s cut-offs based on the Goldberg method(Reference Black19). BMR was estimated using Henry’s equations(Reference Henry20). Participants were not considered under-reporters for a ratio EI:BMR >PAL × exp(−1·96 × S/100) where PAL represents the physical activity level, and S a factor taking into account the variability of EI and BMR and depends on the number of dietary recalls. The study sample was initially composed of 2121 adults (18–79 years) and after exclusion of under-reporters the final sample contained 1774 adults (749 men and 1025 women).
The NutriNet-Santé study is an ongoing French web-based cohort which started in 2009 and has previously been fully described elsewhere(Reference Hercberg, Castetbon and Czernichow21). The NutriNet-Santé study is conducted in accordance with the Declaration of Helsinki guidelines and was approved by the Institutional Review Board of the French Institute for Health and Medical Research (IRB Inserm no. 0000388FWA00005831) and the ‘Commission Nationale de l’Informatique et des Libertés’ (CNIL no. 908 450 and 909 216). Electronic informed consent is obtained from each participant (EudraCT no. 2013-000929-31). All questionnaires are completed online via a web-based interface. At inclusion and every 6 months, participants are required to complete online three 24 h dietary records over a 2-week period. These web-based 24 h dietary records have been validated against dietary records filled during an interview with a dietitian and against blood and urinary biomarkers(Reference Touvier, Kesse-Guyot and Méjean22–Reference Lassale, Castetbon and Laporte24). Portion sizes are estimated using validated photographs(Reference Hercberg, Deheeger and Preziosi25). The nutrient contents of food items come from a published food composition table(Reference Hercberg26). As for the INCA3 study, under-reporters for EI were excluded using the same method(Reference Black19), but BMR was estimated using Schofield’s equations(Reference Schofield27). Participants also complete questionnaires on health, socio-demographic characteristics, anthropometrics and physical activity. The sample used during the present study contained 104 382 adults over 18 years (22 649 men and 81 733 women) and their dietary intake referred to 24 h records collected over a 2-year period following inclusion in the cohort.
We chose to use data from these two populations in order to obtain firstly a representative sample of the French population (INCA3) for describing generally the nutrient security index, and secondly a population where we could characterise the behaviour of this score in more deprived sub-populations because of the large number of participants (NutriNet-Santé).
Development of an index assessing the nutrient security of diet
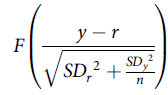
The index assessing the nutrient security of diet (named SecDiet) has been designed to assess the risk of nutrient deficiency due to insufficient intakes of nutrients. In the present study, the SecDiet has been developed for an adult population. It is built on the probabilistic approach(28) and computes, at an individual level, the probability for each nutrient of having an intake sufficiently high to avoid nutrient deficiency using the probability distribution of the standard normal distribution of nutrient requirements, and taking into account the mean intake y, the day-to-day variability of intake SD y 2, the number of days of dietary record n, the inter-individual variability SD r 2 and the nutrient reference value r (Reference Verger, Mariotti and Holmes14,Reference de Gavelle, Huneau and Mariotti29) , as follows:
 $$F\left( {{{y - r} \over {\sqrt {S{D_r}^2 + {{S{D_y}^2} \over n}} }}} \right)$$
where F(x) is the function returning the probability that an observation from the standard normal distribution is lower than x. The probability for a nutrient ranges from 0 to 1, where 1 represents a 100 % probability that the usual intake is adequate.
The nutrient reference value was derived from what we defined as the ‘deficiency threshold’ (DT) corresponding to the minimal intake to avoid nutritional deficiency, which would therefore be the minimal criterion that could be used to set the requirement for this nutrient. We assumed that at an intake equal to the DT, approximately 97·5 % of the population would have an intake sufficient to avoid nutritional deficiency and approximately 2·5 % would be at risk of developing a nutritional deficiency. We then defined the ‘average deficiency threshold’ (aDT) corresponding to the intake with which 50 % of the population would be at risk of having a nutritional deficiency. Assuming a normal distribution of the individual threshold centred at the average DT, the average DT was therefore defined as DT/(1 + 2CV). The CV was assumed to be similar to the CV of the average requirement.
Only nutrients for which a deficiency has been described in adults due to a primary insufficient intake and not secondary to a medical condition were included in the SecDiet. The inclusion of nutrients and the setting of DT were decided after a comprehensive review of the literature, notably concerning the principal nutrient recommendations in public dietary guidelines(Reference Otten, Hellwig and Meyers17,30–33) . Because of the existence of deficiency due to insufficient intakes, we included vitamin A, thiamin, riboflavin, niacin, folate, vitamin B12, vitamin C, iodine, Fe, Se, Zn, Ca and we defined DT for adults based on experimental or epidemiological studies as found reported in French, European and international dietary guidelines(30–35) and meta-analyses studies(Reference Wang, Chen and Fu36–Reference Bischoff-Ferrari, Dawson-Hughes and Baron38). DT are usually much lower than the reference intakes which can be used in nutrient-based indexes, because reference intakes are often based on criteria that are not easily interpretable in terms of health impact, or sometimes even unrelated to biological markers (such as adequate intake based on observed intake), whereas a DT directly corresponds to the risk of an overt deficiency. For some nutrients, the onset of clinical signs of deficiency can be related to a certain amount of nutrient intake (e.g. scurvy may appear for intake of vitamin C below 10 mg/d), and this intake was defined as the DT. In contrast, for some other nutrients (namely, thiamine, riboflavin, niacin, folate), there was not enough literature to derive a DT; therefore, we defined it as the lower reference nutrient intake (which is the intake covering the standard requirements of 2·5 % of the population). The selection of nutrients, their associated deficiency and DT are shown in Table 1 and described in full in online Supplementary Method 1.
Table 1. Nutrients included as components in the SecDiet score and associated deficiency and threshold values

DT, deficiency threshold; aDT, average deficiency threshold; RE, retinol equivalent; NE, niacin equivalent; EAR, estimated average requirement.
* Because of insufficient data to define an intake at which clinical signs of deficiency may appear for these nutrients, the thresholds were defined as the intake covering the requirements of 2·5 % of the population, defined as EAR(1–2CV) (see online Supplementary Table 1).
† These threshold parameters were then further corrected to calibrate the estimated average risk using figures for the national prevalence of goitre for iodine and of anaemia for Fe. For iodine, the recalibrated DT was set at 100 µg and the aDT at 71·3 µg. For Fe, the recalibrated DT was set at 0·70 mg and the aDT at 0·38 (see online Supplementary Method 1).
‡ This value applies to men and non-menstruating women. Requirements for menstruating women were estimated by considering menstrual losses using a Monte–Carlo simulation (see online Supplementary Method 1).
The SecDiet score was then calculated as the sum of the squares of probabilities of nutrient adequacies divided by the number of nutrients included in the calculation. Squaring the probabilities was chosen in order to give more weight to the lowest probabilities among those of the different nutrients included in the score, the aim being to increase its sensitivity to the risk of one individual component over the other that would be expected to be close to the unity. Finally, the SecDiet ranges from 0 to 1, where 1 represents the lowest risk of insufficient nutrient intakes leading to nutrient deficiencies.
Evaluation of the validity of the nutrient security of diet score
Content validity assesses whether the index covers all dimensions of what it is supposed to measure(Reference Bland and Altman39). This was evaluated after a thorough review of the literature on dietary references issued by the main health and food safety agencies(Reference Otten, Hellwig and Meyers17,30–33) . Correlations between score components and the SecDiet were evaluated, as well as between the SecDiet and total EI to determine whether the SecDiet was able to assess certain quality features that would be independent of (energy-related) quantity.
Construct validity determines whether a score correctly measures what it is meant to measure, in this case nutrient security. We evaluated variations of the SecDiet across various socio-demographic sub-groups that are known to be more prone to nutritional deficiency. These sub-groups were the lowest income category(Reference Andrieu, Darmon and Drewnowski40), people with food insufficiency or food insecurity(Reference Dixon, Winkleby and Radimer41,Reference Kirkpatrick and Tarasuk42) and unemployed persons and students(Reference Smed, Tetens and Bøker Lund43,Reference Correa-Rodríguez, Pocovi and Schmidt-RioValle44) . We hypothesised that the SecDiet score for most individuals would be lower in these groups, which might be reflected by a lower group mean and also a downwardly elongated distribution tail in these groups, compared with other groups.
The socio-demographic characteristics studied were professional occupations and monthly household incomes for the INCA3 and NutriNet-Santé populations and perception of financial situation, food insufficiency status and food insecurity status for the INCA3 population only. For the present study, the professional occupation variable was rearranged into three categories: unemployed people, students and other occupations (grouping those with a professional activity and retired individuals). The monthly household income was calculated per consumption unit using the following weighting: 1 consumption unit was attributed for the first adult in the household, 0·5 consumption unit for other persons aged ≥14 years and 0·3 consumption unit for children aged<14 years(45). Perception of financial situation was obtained from a questionnaire designed to determine how a household evaluates its financial well-being. Food security and food insufficiency statuses came from the US Household Food Security Survey Module(46). The food insufficiency status was derived from the preliminary question in the Household Food Security Survey Module survey and evaluates whether a household has had enough to eat during the past 12 months, while the food security status was obtained from the US Household Food Security Survey Module six-item short form.
Comparison with an overall diet quality index, the PANDiet score
The behaviour of the SecDiet score within socio-demographic characteristics was compared with that of a nutrient-based diet quality index, the PANDiet score, in order to determine if the SecDiet is able to capture specific dimensions of nutrient intakes that are related to nutrient security, more than would a classical nutrient-based diet quality index.
The development and the validation of the PANDiet score are fully developed elsewhere(Reference Verger, Mariotti and Holmes14). It is based on the same probabilistic method than the SecDiet but differs in the choice of nutrients, nutrient reference values and computation of the final score. The probability is also calculated for each nutrient, but the nutrient value is mainly based on national nutrient reference intakes for French adults(33) with more nutrients included.
The PANDiet score is based on two sub-scores, the adequacy sub-score, which is the average of probabilities of adequacy for twenty-seven nutrients for which the usual intake should be above a reference value, multiplied by 100, and the moderation sub-score, which is the average of probabilities of adequacy for six nutrients for which the usual intake should not exceed a reference value, multiplied by 100. The PANDiet score is the average of the adequacy sub-score and the moderation sub-score and ranges from 0 to 100 where a higher score indicates a better diet quality. The nutrients included and their associated reference values are presented in online Supplementary Method 2.
Statistical analyses
The weighting schemes proposed in INCA3 were used to account for the complex survey design. Spearman correlation coefficients were used to assess correlations between the SecDiet score and other variables. The NutriNet-Santé population was divided into deciles of SecDiet, and the first decile of SecDiet was further stratified into deciles in order to reveal the characteristics of first ten percentiles of SecDiet, corresponding to the lowest SecDiet score and hence the population the most at risk of nutritional deficiency. Categorical variables are presented as percentages and differences across deciles and across first ten percentiles were determined using χ 2 tests. Descriptive statistics (mean, sd, range, quartiles, fifth and ninety-fifth percentiles) were used to describe the distribution of the SecDiet and the PANDiet in the population and across the socio-demographic characteristics studied and presented using boxplots. Kruskal–Wallis non-parametric tests were performed to assess significant differences between the SecDiet, the PANDiet and socio-demographic variables. Pairwise multiple comparisons within socio-demographic variables categories were assessed using the Dwass–Steel–Critchlow–Fligner test.
All statistical analyses were performed using SAS version 9·4 (SAS Institute Inc.). Weighting schemes were considered using a weight statement when applicable. Significance was set at P < 0·05.
Results
Distribution of the nutrient security of diet score in study populations
In the INCA3 population, components of the SecDiet were correlated with each other and with the overall SecDiet (r 0·17–0·78 with the SecDiet, all P < 0·001). The components with highest correlation coefficients were iodine (r 0·78), riboflavin (r 0·74), folate and Ca (r 0·70) and vitamin A (r = 0·68), when compared with the lowest coefficients observed for thiamin (r 0·17) or niacin (r 0·20). The SecDiet was positively correlated with total EI (r 0·44) and with the PANDiet score (r 0·50) (online Supplementary Table 1).
The distributions of the SecDiet in the INCA3 and NutriNet-Santé populations are presented in Fig. 1 and were similar, with a distribution strongly skewed towards the upper bound of the score (i.e. 1).

Fig. 1. Distribution of the SecDiet score in (a) the Third Individual and National Study on Food Consumption (INCA3) population (n 1774) and (b) the NutriNet-Santé population (n 104 382).
In the INCA3 population, the mean SecDiet score was 0·93 (SD 0·09). The lowest probabilities of adequacy were found for vitamin A (0·89 (SD 0·18)) and iodine (0·90 (SD 0·15)) (Table 2), that is, individual components among the most strongly correlated with the overall score. In the NutriNet-Santé population, the mean SecDiet score was 0·96 (SD 0·06). The lowest probability of adequacy was found for iodine (0·87 (SD 0·20)) (Table 3). In both populations, the SecDiet score was lower in women than in men (0·91 v. 0·94 in INCA3 and 0·95 v. 0·97 in NutriNet-Santé, respectively).
Table 2. SecDiet statistics and probabilities of adequacies for nutrients in the French adult population from the Third Individual and National Study on Food Consumption (INCA3) (n 1774)
(Mean values and standard deviations; medians and interquartile ranges (Q1–Q3))

Table 3. SecDiet statistics and probabilities of adequacies for nutrients in the French adult population from the NutriNet-Santé study (n 104 382)
(Mean values and standard deviations; medians and interquartile ranges (Q1–Q3))

Socio-demographic characteristics of individuals with a relatively low nutrient security of diet score
We characterised the socio-demographic characteristics of the deciles and first ten percentiles of the SecDiet in the NutriNet-Santé population (Table 4). The CV of the SecDiet was very low, except for the first decile (11 %) and first percentile (13 %). More women and individuals who were younger, had a lower level of qualifications or of monthly income were found in lower SecDiet score (all P < 0·001, except for sex across first tenth percentiles where P = 0·465). Compared with the tenth decile, individuals in the first decile were more often single (28·4 v. 14·6 %) or living as an unmarried couple (29·8 v. 19·2 %). Individuals in the first percentile were predominantly single (36·3 %). Individuals with lower SecDiet score were more likely to be unemployed (11·8 % in the first percentile, 9·1 % in the first decile v. 4·2 % in the tenth decile), students (21·9 % in the first percentile, 16·0 % in the first decile v. 4·1 % in the tenth decile) and employees (27·2 % in the first percentile, 25·2 % in the first decile v. 14 % in the tenth decile).
Table 4. Socio-demographic characteristics according to deciles (first, fifth, tenth) and lower percentiles (first, fifth, tenth) of the SecDiet score in the French adult population from the NutriNet-Santé study (n 104 382)
(Mean values and standard deviations; percentages)

* P values are from χ 2 test between deciles of SecDiet.
† P values are from χ² test between first ten percentiles of SecDiet.
Nutrient security of diet score of groups in which a higher risk of nutrient deficiency was expected and comparison with the PANDiet score
The SecDiet score was plotted according to the monthly income per household unit and the professional occupation in the INCA3 and the NutriNet-Santé populations (Fig. 2). In both populations, the SecDiet decreased with lower monthly income. In the INCA3 population, the SecDiet decreased from 0·94 (SD 0·07) for the highest income bracket to 0·91 (SD 0·11) for the lowest income bracket (P = 0·002, online Supplementary Table 2). In the NutriNet-Santé population, the SecDiet decreased from 0·97 (SD 0·05) for the highest income bracket to 0·94 (SD 0·08) for the lowest income bracket (P < 0·001, online Supplementary Table 3). Regarding the professional situation, the SecDiet was lower among the unemployed people (0·91 (SD 0·09)) v. other occupations (0·93 (SD 0·09)) but did not differ significantly for students (0·92 (SD 0·11)) v. other occupations in the INCA3 population (online Supplementary Table 4). In the NutriNet-Santé population, the SecDiet score was lower among the unemployed people (0·94 (SD 0·08)) and students (0·93 (SD 0·08)) compared with other occupations (0·96 (SD 0·06)) (P < 0·001) (online Supplementary Table 5).

Fig. 2. SecDiet score according to monthly income per household unit ((a) and (c)) and professional occupation ((b) and (d)) in the Third Individual and National Study on Food Consumption (INCA3) population (n 1774) and the NutriNet-Santé population (n 104 382), respectively. * Significantly different from the reference (‘>1850€’ or ‘>3700€’, respectively for monthly income per household unit in the INCA3 population or the NutriNet-Santé population, ‘Others occupation’ for professional occupation) assessed by the Dwass–Steel–Critchlow–Fligner (DSCF) test for pairwise multiple comparisons (significance was set at P < 0·05). NA, not available.
The differences between the SecDiet and the PANDiet scores were studied in the INCA3 population by comparing their behaviours according to the perception of financial situation, the food insufficiency and food insecurity statutes (Fig. 3).

Fig. 3. (a) SecDiet and (b) PANDiet scores according to the perception of financial situation; (c) SecDiet and (d) PANDiet scores according to food insufficiency status; (e) SecDiet and (f) PANDiet scores according to food security status in the Third Individual and National Study on Food Consumption (INCA3) population (n 1774). * Significantly different from the reference (‘Financially comfortable’ for perception of financial situation, ‘Food sufficiency’ for food insufficiency status, ‘Food security’ for food security status) assessed by the Dwass–Steel–Critchlow–Fligner (DSCF) test for pairwise multiple comparisons (significance was set at P < 0·05).
Both the SecDiet and the PANDiet scores decreased with lower perception of financial situation. However, the decrease was more important for the SecDiet. The difference of the SecDiet between the ‘Financially comfortable’ status (0·94 (SD 0·08)) and the ‘Can’t manage without debts’ status (0·85 (SD 0·14)) represented a 9·6 % decrease, whereas between the same two statutes, the decrease of the PANDiet was of 2·9 % (online Supplementary Table 6). Furthermore, it was important to note that the distribution of the SecDiet spread downwards in sub-populations with the lowest financial situations compared with the PANDiet score (Fig. 3(a) and (b)). Indeed, the SecDiet CV was 16·5 % in the lowest financial situation class and 8·5 % in the highest financial situation class. The PANDiet and SecDiet scores were both significantly different across food insufficiency status groups (P < 0·001), with higher scores for food sufficiency status compared with qualitative and quantitative food insufficiency statutes (online Supplementary Table 7). The SecDiet score was higher for food security status (0·93 (SD 0·08)) compared with moderate food insecurity (0·89 (SD 0·13)) and severe food insecurity (0·89 (SD 0·10)), which both had similar SecDiet score (P < 0·001). The PANDiet score was only significantly different for moderate food insecurity (63·07 (SD 5·73)) compared with food security (64·53 (SD 5·73)) (P = 0·002) (online Supplementary Table 8).
As highlighted by the boxplot representations, the main difference between the SecDiet and the PANDiet score was the specific spreading of the boxplots towards lower SecDiet scores (i.e., decrease in the fifth percentile) for food insufficiency and food insecurity statutes, which was not observed with the PANDiet.
Discussion
The aim of the present study was to evaluate the validity of a new dietary index that describes the nutrient security of diet, the SecDiet. This index consists in an aggregate probabilistic assessment of the risk of deficiency for twelve micronutrients that are of potentially considerable importance to public health. After an in-depth examination, the SecDiet displayed a good content and construct validity. Unlike an overall nutrient-based diet quality index, the SecDiet is particularly sensitive to situations that are known to increase nutritional insecurity.
We decided to include these twelve micronutrients after a review of the literature regarding the reality and severity of selective deficiencies of all micronutrients(Reference Otten, Hellwig and Meyers17,30,31,Reference Biesalski and Grimm47) . The SecDiet includes the most widespread micronutrient deficiencies, which are Fe, iodine, folate, vitamin A and Zn deficiencies(Reference Bailey, West and Black3). The lower reference values were defined as the minimal intake below which clinical signs of deficiency might appear and were taken from international expert consensus reports. The SecDiet score is therefore appropriate for use in other countries, including low- and middle-income countries, because it is mostly not based on national reference values. However, the parameters were based on reference values for adults so are not readily applicable to other populations such as children or pregnant women. For two nutrients, namely Fe and iodine, we were able to recalibrate the estimation of the risk of deficiency on the national prevalence of anaemia (Hb <130 g/l for men and <120 g/l for women)(48) and goitre(Reference Wémeau49). Indeed, although the reference values employed offer a good reflection of the minimal intake required to prevent deficiency (based on data in the literature) it appears that these thresholds overestimate the risk when compared with the figures regarding the actual prevalence of deficiency. To be adaptable to other populations and settings, worldwide prevalence estimates for anaemia(50) and goitre could be used(Reference de Benoist, Andersson and Egli51), or estimates for the country under study, if these data are available. This approach is interesting because it involves theoretical information that links individual dietary records to the actual average risk estimates observed directly in the population.
We found that the SecDiet score was positively correlated with all its components, but coefficients of correlations revealed that all components did not make the same contribution to this score. These differences indicate that some nutrients have little influence on variations of the SecDiet score, presumably because current intakes in these populations are high compared with the reference threshold used here to estimate the risk of overt deficiency. In contrast, other nutrients were more strongly correlated with the SecDiet score and were also those with the lowest means (vitamin A, riboflavin, folate, iodine and Ca), suggesting a higher risk of developing a clinical deficiency of these nutrients. It appears that the SecDiet score was not independent of EI, a higher EI being associated with a lower risk of developing nutritional deficiency, as had been expected. The SecDiet is therefore not fully and specifically a diet quality index, inasmuch as it is also associated with (energy) quantity. This was to be expected, since the SecDiet is rather an aggregate estimate of the risk of deficiency.
Lower SecDiet scores were found in people with low monthly incomes and low perceptions of their financial situation. It is widely acknowledged that poverty is one of the main causes of undernutrition worldwide, and that low- and middle-income countries have the highest prevalence of micronutrient deficiencies(Reference Bailey, West and Black3). Indeed, low socio-economic status is generally associated with poor diet quality, which can be explained by several factors such as food prices and access, education in nutrition or the time required for cooking(Reference Darmon and Drewnowski52). Several studies have shown that adults with lower socio-economic status have lower plasma ascorbic acid concentrations(Reference Shohaimi, Bingham and Welch53) and lower intakes of micronutrients such as Ca and Fe (Reference Hulshof, Brussaard and Kruizinga54). Here, we have identified a situation of acute nutritional risk in the most deprived part of the general population. The SecDiet score was also lower in unemployed people and students, which is in line with studies reporting lower micronutrient intakes among students(Reference Correa-Rodríguez, Pocovi and Schmidt-RioValle44,Reference Ghiasvand, Khosravi and Mirzaeian55,Reference Šatalić, Colić Barić and Keser56) and lower Ca intakes in households where the family head is unemployed(Reference Winzenberg, Riley and Frendin57). Low-income households are generally constrained to choose discount products and energy-dense foods with low micronutrient contents(Reference Smed, Tetens and Bøker Lund43,Reference Darmon and Drewnowski52) . Likewise, when characterising individuals with a low SecDiet score, we also found more people with lower levels of education and monthly income, as well as more women, younger adults and single or unmarried couples. Single women with children and a low income have been reported to have lower nutrient intakes, which could be secondary to giving nutritional priority to their children(Reference Tarasuk and Beaton58,Reference McIntyre, Glanville and Raine59) .
As expected, the SecDiet score was lower among adults living in households suffering from food insecurity or food insufficiency. Indeed, it has been seen in the USA that, in food-insufficient families, younger adults had lower Ca intakes, and older adults had lower intakes of Fe and Zn when compared with adults in food-sufficient families. Both younger and older adults had lower serum concentrations of vitamin A compared with adults in food-sufficient families(Reference Dixon, Winkleby and Radimer41). A study in Canada found that adults in food insecure households had a higher prevalence of inadequacy for vitamin A, Zn, folate, vitamin B12 and Fe but this was dependent on sex and age categories(Reference Kirkpatrick and Tarasuk42). However, it is not surprising that low SecDiet score is associated with both low socio-economic status and food insufficiency and food insecurity because these characteristics may be correlated with each other. A study in the UK found that participants living in food insecurity tended to have more problems making ends meet and were often students, younger, males and had a low level of education(Reference Yau, White and Hammond60).
In contrast, the PANDiet score did not show the same range of variation than the SecDiet regarding socio-demographic characteristics. If it also decreased with lower socio-economic status, the lower tail of the distribution did not drop as it was observed with the SecDiet. Therefore, the SecDiet appears to be more specific than a broad index of dietary quality to detect situations with higher risk of nutrient deficiency. The two scores were positively, but not entirely, correlated (r +0·50), meaning that the SecDiet score is associated with overall nutrient adequacy but confirming that it describes a situation that is more specific, based on fewer nutrients and another type of hazard (lower threshold).
The SecDiet score nevertheless has certain limitations. Because of a lack of data and scientific evidence, it was necessary to derive some minimal thresholds from estimates of standard requirements by defining the DT as the intake covering requirement for only 2·5 % of the population. This was the case for thiamin, riboflavin, niacin and folate. These minimal intakes could be refined in future when specific studies are available. Regarding the construction of the score, the probabilistic approach is a method that has been recommended and previously validated(13,Reference Verger, Mariotti and Holmes14) for assessing risk of inadequacy based on nutrient requirements and intakes, but we needed to assume a normal distribution around the average DT (which is the intake at which the individual risk of a nutritional deficiency would be 50 %) and to define a CV corresponding to CV used for nutrient requirements. The distribution model and parameters remain theoretical, although neither more nor less than in all generic probabilistic-based nutrient risk assessment methods(Reference Carriquiry12,13) . Similar to those methods, normality of the distribution of the DT is assumed except for Fe. It may also be important to note that this score only provides tools to measure the risk of micronutrient deficiency in the general population due to insufficient intake and not to a medical condition (such as malabsorption issues or being under a treatment interfering with micronutrient metabolism), and therefore does not cover all possible situations leading to micronutrient deficiency. Indeed, the main objective of the SecDiet was to be applied to a given population so as to study the risk of micronutrient deficiency solely attributable to insufficient food intake, independently of a particular health status of certain individuals.
In the present study, dietary supplements consumption was not considered but this may not have changed the observed results since, in France, it has been shown that dietary supplements consumption only slightly improves nutrient adequacy(61). Furthermore, it has been shown in the NutriNet-Santé study that consumers of dietary supplements rather belonged to higher socio-professional category and had lower prevalence of inadequate nutrient intake compared with non-consumers of dietary supplements(Reference Pouchieu, Andreeva and Péneau62). So dietary supplements are generally consumed by those who need it the least. Our results highlighted that low SecDiet score, and therefore higher risk of nutritional deficiency, was observed in individuals with lower socio-economic status, which are less prone to consume dietary supplements.
Further studies should consist in validating the criteria using data that could demonstrate the associations between the SecDiet score and measurements of biomarkers or clinical signs indicative of individual micronutrient deficiencies in a more disadvantaged population. Furthermore, such data could be used to set a cut-off point for discriminating individuals at risk of deficiency. It would also provide an opportunity to recalibrate the score so that it precisely matches the population-based risk of deficiency. However, it is often more difficult to obtain data from the most disadvantaged individuals in nationwide population surveys because they may be homeless, unemployed or not-speaking the national language(Reference Hulshof, Brussaard and Kruizinga54). When assessing nutritional status from dietary surveys, discarding under-reporters has the advantage of avoiding that nutrient insufficiency is over-estimated. The fact that the SecDiet was associated with EI in our samples confirms that underestimate of EI would result in a downward bias of nutrient security. In the application of this method, therefore, care must be taken to minimise under-reporting, especially in people with low energy requirement. The Goldberg/Black cut-offs/methods that we used have limitation, but have been widely used and remain a standard for identifying under-reporters. One limitation of this method is the identification of under-reporters for individuals with high energy requirement(Reference Black19). This type of error is however the one that would have the least implication on the bias of the SecDiet.
Micronutrient deficiency is also referred to as hidden hunger because unlike other types of malnutrition, it is frequently less visible(Reference Bailey, West and Black3,Reference Muthayya, Rah and Sugimoto5) so the SecDiet might offer an effective tool to screen those who are more at risk of micronutrient deficiency in a representative population and identify the socio-economic characteristics that are more predictive of nutritional insecurity. So as to further validate the method, further studies could also interestingly focus on specific populations with an expected higher food and nutrition insecurity, for instance, older adults in assisted living facilities or college campus. Dedicated studies on the latter population would confirm and better characterise the nutritional risk that we have identified in the large general samples in the present study. Lastly, this score could also be very useful when studying different diet models or simulating possible future diet changes. Indeed, sustainable diets have been advocated to ensure human and planetary health(Reference Springmann, Clark and Mason-D’Croz63,Reference Willett, Rockström and Loken64) , but adherence to them requires substantial dietary changes that reduce the intake of certain nutrients, particularly those from animal-based foods. However, the degree to which this might create a real short-term risk for health that could partly offset the benefits for long-term health remains uncertain. It is therefore important to characterise the true acute risk in this setting and determine detailed characteristics of the diet that modulate this risk.
In conclusion, we propose here a new index based on the probabilistic risk of micronutrient deficiency. While the present study used data from French populations, the SecDiet could be applied in other countries because it is mostly not based on national dietary requirements. We were able to show that the SecDiet score was indeed associated with low socio-economic status and to identify populations with an expected higher risk of nutrient insecurity. The SecDiet would therefore be a useful tool to study the risk of micronutrient deficiency in a vast representative population or in more specific sub-populations in which nutritional insecurity is suspected, and it might also be used as a safeguard parameter when studying prospective dietary transitions.
Acknowledgements
The authors sincerely thank all the volunteers of the NutriNet-Santé cohort for their continuous participation in the study. The authors also thank Younes Esseddik, Thi Hong Van Duong, Régis Gatibelza, Jagatjit Mohinder and Aladi Timera (computer scientists); Fabien Szabo de Elenyi, Nathalie Arnault, Julien Allegre and Laurent Bourhis (datamanager/statisticians); Cédric Agaesse (dietitian); Sandrine Kamdem (physicians) and Nathalie Druesne-Pecollo (operational coordinator) for their technical contribution to the NutriNet-Santé study.
M. S.’s PhD fellowship is currently being funded by a research contract with Terres Univia, the French Interbranch organisation for plant oils and proteins. F. M. is the scientific leader of this contract.
NutriNet-Santé was supported by the following public institutions: Ministère de la Santé, Santé Publique France, Institut National de la Santé et de la Recherche Médicale (INSERM), Institut National de la Recherche Agronomique (INRA), Conservatoire National des Arts et Métiers (CNAM) and Université Sorbonne Paris Nord.
M. S., J.-F. H. and F. M. designed the research; M. S. and E. K-G. conducted the research, analysed the data and performed statistical analyses; H. F., M. T., S. H., J.-F. H. and F. M. provided methodological tools and support; M. S. and F. M. interpreted the results; M. S. wrote the first draft of the manuscript and all authors provided critical comments on the manuscript. M. S. and F. M. have primary responsibility for the final content and all authors read and approved the final manuscript.
The authors declared that there are no conflicts of interest.
Supplementary material
For supplementary material referred to in this article, please visit https://doi.org/10.1017/S0007114520005115


