


Vitamin D is a seco-steroid hormone that regulates several biological functions in the body, in addition to its well-established role in Ca homoeostasis and bone metabolism(Reference Chang and Lee1). Whether endogenously synthesised from its precursor (7-dehydrocholesterol) in the skin or obtained from the diet, vitamin D is first hydroxylated by 25-hydroxylase and converted into 25-hydroxyvitamin D (25(OH)D). The subsequent hydroxylation by 1α-hydroxylase converts this into the active hormone 1,25-dihydroxyvitamin D (1,25(OH)2D). 25(OH)D is the major circulatory metabolite and is used as a biomarker for vitamin D status(Reference Chang and Lee1). Because of its hydrophobic nature, all the different metabolites of vitamin D circulate in the blood bound to proteins, mainly vitamin D binding protein (DBP) and albumin. In particular, >99 % of serum 25(OH)D is bound to proteins, approximately 85 % to DBP and approximately 15 % to albumin(Reference Chun, Shieh and Gottlieb2,Reference Bikle and Schwartz3) .
Vitamin D deficiency (VDD) is a global public health problem(Reference van Schoor and Lips4), with prevalence levels among adolescents reported as high as 85–98 % in India(Reference Garg, Marwaha and Khadgawat5,Reference Kapil, Pandey and Goswami6) , and about 97 % in Korea(Reference Byun, Heo and Cho7). Studies among adolescents in the Gulf region of the Middle East have also reported a very high prevalence of VDD(Reference Lips, Cashman and Lamberg-Allardt8), including 96 % in Saudi Arabia(Reference AlBuhairan, Tamim and Al Dubayee9). In Kuwait, 81 % of adolescents were reported to be vitamin D deficient, with approximately 40 % of adolescents having severe VDD(Reference Al-Taiar, Rahman and Al-Sabah10).
Several factors contribute to this high prevalence of VDD. These include, but are not limited to, sun avoidance behaviour due to high temperatures, cultural practices like clothing that covers most of the body (particularly in women) and the use of sunscreen. Exposure to environmental Pb has been suggested as one of the potential risk factors of VDD. A dramatic decrease in serum 25(OH)D levels in jewellery workers(Reference Mazumdar, Goswami and Ali11) and in serum 1,25(OH)2D levels in battery manufacture workers(Reference Dongre, Suryakar and Patil12), who have increased occupational exposure to Pb, has been reported. Studies in children with high Pb exposure demonstrated a significant negative association between blood Pb levels (BPbL) and 1,25(OH)2D concentration(Reference Sorrell and Rosen13–Reference Chang, Liu and Shi16), reporting that children whose BPbL were in the range of 33–55 μg/dl have a significant reduction in serum 1,25(OH)2D concentration. The decrease in serum 1,25(OH)2D was even more pronounced in children with BPbL of >62 μg/dl, suggesting a dose-dependent effect of Pb on vitamin D status(Reference Mahaffey, Rosen and Chesney15).
Pb is a toxic heavy metal that is ubiquitously present in our environment and is still being used in various industries(17,Reference Kim, Jang and Chae18) . Pb poisoning is a public health concern in both developing and developed countries(19). Like VDD, the prevalence of elevated BPbL is also high in the Middle East in both adult and paediatric populations(Reference Shaik, Sultana and Alsaeed20–Reference Al-Mahroos and Al-Saleh22). In Kuwait, more than 50 % of newborns were reported to have BPbL higher than 10 µg/dl(Reference Rahman, Al-Rashidi and Khan23). Our recent data show that over 50 % of adolescents have BPbL ≥ 5 µg/dl (manuscript submitted), the current CDC limit of concern.
Under normal physiological conditions, approximately 0·03 % of total 25(OH)D and 0·4 % of total 1,25(OH)2D are in the unbound form and it is this free (bioavailable) form of the vitamin that is taken up by most tissues(Reference Bikle and Schwartz3). As DBP has a high affinity for 25(OH)D, a negative correlation has been reported between free 25(H)D and DBP(Reference Schwartz, Lai and Lizaola24). Thus, in conditions where DBP levels are increased, a smaller amount of 25(OH)D will be available for tissue uptake(Reference Bikle, Gee and Halloran25). DBP is a positive acute phase protein, the expression of which in the liver could be enhanced by proinflammatory cytokines like IL-6(Reference Lisowska-Myjak, Jóźwiak-Kisielewska and Łukaszkiewicz26). Pb is a prooxidant metal and is known to cause inflammation and increases the production of proinflammatory cytokines like IL-1β, TNF-α and interferon-γ (Reference Liu, Chen and Zhang27,Reference Chibowska, Baranowska-Bosiacka and Falkowska28) . We therefore hypothesise that high BPbL will increase serum levels of DBP with a subsequent decrease in free 25(OH)D levels. However, to our knowledge, such associations between BPbL and serum DBP and free 25(OH)D have not been reported. Furthermore, a negative association between BPbL and vitamin D metabolites (25(OH)D and 1,25(OH)2D) in occupationally exposed populations has been reported, but data on this association in healthy populations are scarce.
The adolescent population in Kuwait comprises approximately one-quarter of the total population, and both VDD and elevated BPbL in this population are highly prevalent. The objectives of this study were thus to investigate, in a nationally representative sample of middle-school children, the association between BPbL and total 25(OH)D, free 25(OH)D and DBP. In this study, we tested the hypothesis that high BPbL is positively associated with DBP and negatively associated with total and free 25(OH)D.
Materials and methods
Study design and protocol
This was a cross-sectional study conducted in public middle schools randomly selected from all the six Governorates of Kuwait. Study subjects, in the age range of 11–16 years, were selected from twelve schools (six each for boys and girls) using stratified multi-stage cluster random sampling. The sample allocation in each governorate was based on the relative size of that governorate as judged by the total number of students in the governorate. The study was approved by The Ethics Committee at the Ministry of Health, Kuwait (No: 2015/248) as well as The Ethics Committee of the Health Sciences Centre, Kuwait University (No: DR/EC/2338). The study was conducted in accordance with the declaration of Helsinki ethical principles for medical research involving human subjects. An informed consent form was sent to the parents including permission to draw a blood sample from their child and a self-administered parental questionnaire with questions on various socio-demographic parameters. Informed consent forms and questionnaire were sent to 1583 households, of which 1422 returned the forms with written approval. Trained dedicated data collectors carried out face-to-face interviews with the students using a structured questionnaire. Details on the questionnaire development and validation have been previously published(Reference Al-Taiar, Rahman and Al-Sabah10,Reference Rahman, Al-Taiar and Shaban29) . Upon verbal assent, a venous blood sample (5 ml) was drawn from 1416 students (six subjects declined to give blood sample) by a highly trained paediatric nurse.
Justification of sample size
For this cross-sectional study, the estimated sample for the main effect (association between BPbL and 25(OH)D) was 1100 students, which was large enough to yield a study power of 90 % to detect an increase of 0·009 in the coefficient of determination of the reduced model (R 2 = 0·039) at a significance level of 5 %, while fitting a full model with nine predictors and with an assumed coefficient of determination as 0·048. To account for the missing data, we inflated our sample size to 1250 adolescents. Plasma 25(OH)D data were available for 1416 participants, whereas BPbL data were available for 1388 subjects. DBP was analysed in a subsample of 800 subjects randomly selected by a computer-generated programme, with similar representation from each sex and age group, and data were available for 703 subjects.
Blood collection and analyses
Plasma was separated for DBP and 25(OH)D analyses and stored at –80°C until analysis. Plasma DBP was determined utilising a commercial ELISA kit from Immunodiagnostik (Cat. no. K2314; Immunodiagnostik AG) as per the manufacturer’s instructions. The assay has an intra-assay CV of 5·0 % at low concentration and 3·2 % at high concentration. The inter-assay CV is 12·7 %. The detection limit is 1·23 ng/ml. Pb in whole blood samples (0·5 ml), digested in perchloric acid/nitric acid (1:5) solution, was analysed with Inductively Coupled Plasma MS. Double-deionised water was used in all sample preparation steps to avoid contamination. For quality control check, lyophilised whole blood samples of known mineral content (Clin-Check-Control, Cat. no. 884042; Recipe) were included in the analyses. Samples for 25(OH)D analysis were protected from light throughout handling and processing. Plasma 25(OH)D was measured in a CAP-accredited laboratory by LC-tandem MS (LC-MS/MS), as described previously(Reference Al-Harbi, Khan and Rahman30) using the commercially available kit from Chromsystems (Cat. no. 2000/1000/F; Chromsystems Instruments & Chemicals GmbH). Precision and accuracy of analysis were monitored by including control samples (MassCheck controls). For defining vitamin D status categories, we used the 25(OH)D cut-off values of the Endocrine Society and the Society for Adolescent Health and Medicine as follows: VDD <50 nmol/l (20 ng/ml); vitamin D insufficiency 50–75 nmol/l (20–30 ng/ml) and vitamin D sufficiency ≥ 75 nmol/l (30 ng/ml). The following formula, described by Tsuprykov et al. (Reference Tsuprykov, Chen and Hocher31), was used to calculate free 25(OH)D:
Free 25(OH)D = total 25(OH)D/ 1 + (6 × 10⁵ × albumin) +(7 × 10⁸ × DBP).
Statistical analyses
Data were double-entered into a database using Epidata Entry. Data for BPbL, 25(OH)D and BPB were not normally distributed. These data are presented as median and interquartile range (IQR). Mean differences in these variables were estimated with Mann–Whitney U test, Kruskal–Wallis test or median test, as appropriate. BPbL was divided into quartiles and also based on the cut-off points of ≥5 µg/dl. Free 25(OH) was log-transformed for normalisation. Mean differences of free 25(OH)D across Pb categories were estimated by t test for independent samples and one-way ANOVA. Linear regression was used to assess the association of PBbL with total 25(OH)D and free 25(OH)D, using BPbL either as continuous variable, as quartiles or as categorised by the cut-off point of 5 µg/dl. We also categorised total 25(OH)D levels into two categories (insufficient/sufficient (combined) and deficient groups) and used binary logistic regression to assess the association between BPbL categories and VDD. A P < 0·05 was used for statistical significance. Data were analysed with SPSS version 26.
Results
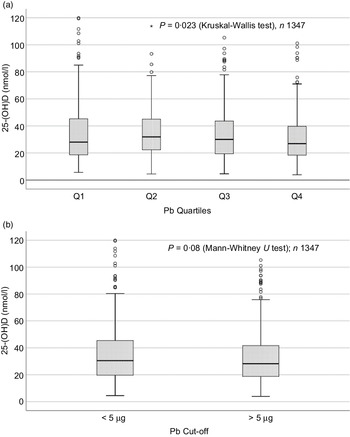
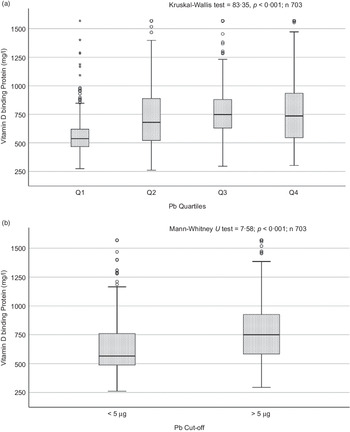
Sociodemographic and nutritional characteristics of the study participants are presented in Table 1. Pb and 25(OH)D data were available for 1347 subjects. Median 25(OH)D level was 29·7 (IQR 19·2–44·2) nmol/l, with 81·2% subjects having deficient (<50 nmol/l) 25(OH)D levels. Median BPbL was 5·1 (IQR 3·6–7·1) µg/dl (4·9 (IQR 3·8–6·5) µg/dl in males and 5·4 (3·3–7·6) µg/dl in females; P = 0·001), and 51% of the subject has BPbL ≥ 5 µg/dl (the CDC cut-off level of toxicity). There was a non-significant negative correlation between BPbL and plasma total 25(OH)D levels (β = –0·05; P = 0·09). Distribution of total 25(OH)D levels across different quartiles and cut-off points of BPbL is shown in Fig. 1. Median 25(OH)D levels were 28·0 (IQR 18·6–45·5), 31·9 (IQR 22·3–45·2), 30·0 (IQR 19·3–43·6) and 26·9 (IQR 18·3–40·1) nmol/l in Q1, Q2, Q3 and Q4, respectively (P = 0·02). Similarly, median 25(OH)D levels in subject with BPbL < 5 µg/dl was 30·5 (IQR 19·7–45·3) nmol/l and 28·2 (IQR 18·8–41·9) nmol/l in subject with BPbL ≥ 5 µg/dl (P = 0·08). As data on DBP were available for 703 subjects, free 25(OH)D was calculated for the same number of subjects. Distribution of free 25(OH)D levels across different quartiles and cut-off points of BPbL is shown in Fig. 2. Geometric mean free 25(OH)D levels were 3·97 (sd 2·01), 3·52 (sd 1·89), 3·27 (sd 1·95) and 3·05 (sd 1·95) pmol/l in Q1, Q2, Q3 and Q4, respectively (P = 0·002). Geometric mean levels of free 25(OH)D in subject with BPbL < 5 µg/dl were 3·78 (sd 1·97) pmol/l and 3·15 (sd 1·94) pmol/l in subject with BPbL ≥ 5 µg/dl (P ≤ 0·001). Figure 3 shows the distribution of DBP across different quartiles and cut-off points of BPbL. Median DBP were 584 (IQR 466–620), 724 (IQR 521–889), 782 (IQR 627–881) and 779 (IQR 545–937) mg/l in Q1, Q2, Q3 and Q4, respectively (P < 0·001). Median DBP levels in subject with BPbL < 5 µg/dl was 566 (IQR 487–760) mg/l and 784 (IQR 584–926) mg/l in subject with BPbL ≥ 5 µg/dl (P < 0·001). In the univariable linear regression analysis, significant positive association was observed between DBP and Pb (β = 0·81 (95% CI 0·14, 0·22); P < 0·001; R 2 = 0·087) (Fig. 4) and a negative association between DBP and free 25(OH)D (Fig. 5) (β = –0·005 (95% CI –0·006, –0·004); P < 0·001). No significant association was found between BPbL, used as continuous variable, and plasma total 25(OH)D, either in the unadjusted model or when adjusted for the known factors that are associated with plasma vitamin D (Table 2). However, when BPbL were used as quartiles, significant negative association was found between BPbL quartiles and total 25(OH)D, and this negative association remained significant when adjusted for the known factors associated with total 25(OH)D in this cohort (Table 2). When BPbL was used as a cut-off of <5 µg/dl or ≥5 µg/dl, the negative association was statistically significant in the univariable model. However, in the adjusted model, this association did not remain significant (Table 2). On the other hand, the negative association between BPbL and free 2(OH)D was significant whether BPbL was used as continuous variable, as quartiles or cut-off points in univariable as well as in multivariable models with adjustment for different potential confounding variables (Table 2). In multinomial regression, the odds of being vitamin D insufficient was significantly higher in the Q2 (compared with Q1) of BPbL (OR = 2·96 (95% CI 1·20, 7·31)). On the other hand, the odds of being vitamin D deficient were significantly higher in both Q2 and Q4 (compared with Q1) of BPbL (OR = 2·53 (95% CI 1·09, 5·84) and (2·71 (95% CI 1·17, 6·24), respectively, for Q2 and Q4) (Table 3). The distribution of BPbL across the different categories of vitamin D status is shown in Fig. 6(a). Although the median BPbL in the three categories of vitamin D status was not significantly different (P = 0·09), the distribution of BPbL in the vitamin D-deficient group was significantly different from the sufficient group (Mann–Whitney U test P = 0·048). The distribution of BPbL across the tertiles of free 25(OH)D (Fig. 6(b)) was significantly different (P = 0·008).
Table 1. Sociodemographic characteristics and nutritional status of the study participants
(Mean values and standard deviation; numbers and percentages; median and interquartile ranges (IQR))
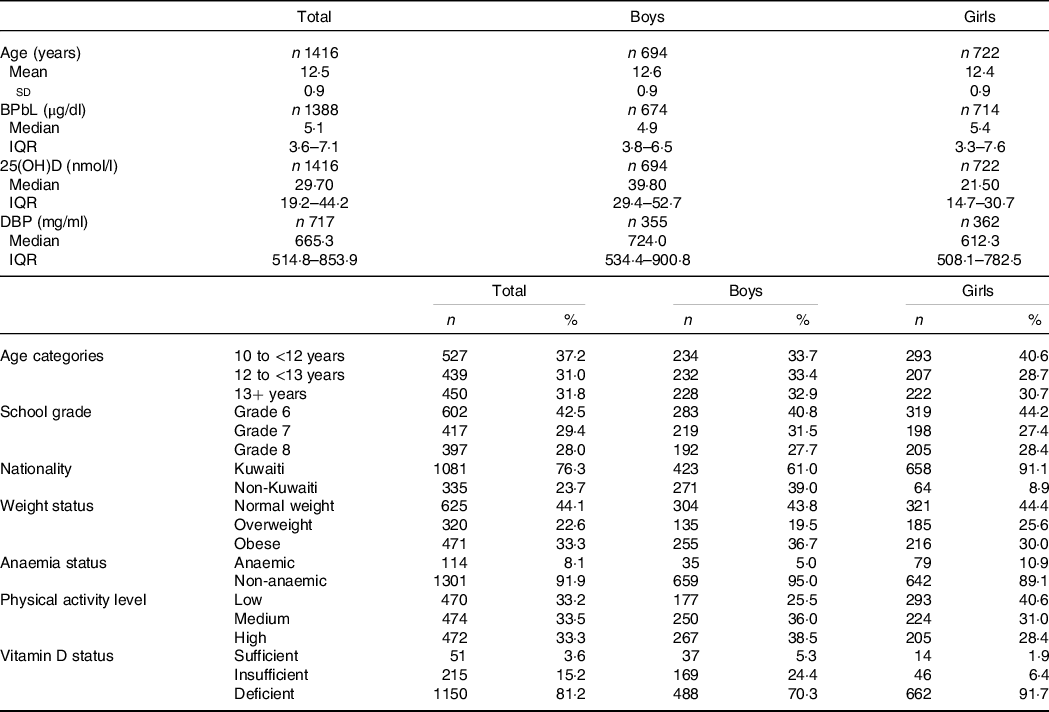

Fig. 1. Box plot showing the distribution of plasma total 25-hydroxyvitamin D (25(OH)D) levels across quartiles of blood lead levels (a), and lead levels categorised based on the CDC cut-off of 5 ug/dl (b). Data were analysed by Kruskal–Wallis test in A and by Mann–Whitney U test in B.
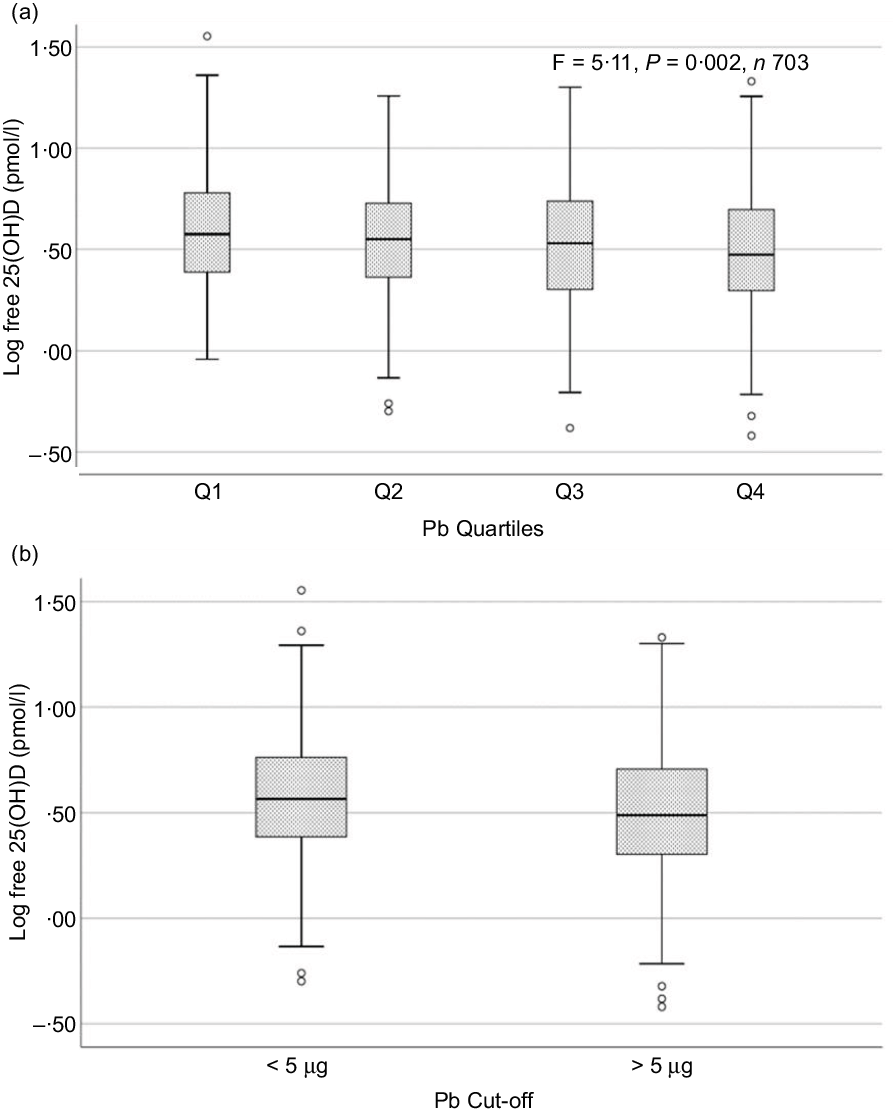
Fig. 2. Box plot showing the distribution of plasma free 25-hydroxyvitamin D (25(OH)D) levels across quartiles of blood lead levels (a), and lead levels categorised based on the CDC cut-off of 5 ug/dl (b). Free 25(OH)D levels were log-transformed for normalisation. Data were analysed by one-way ANOVA in A and by t test for independent samples in B.
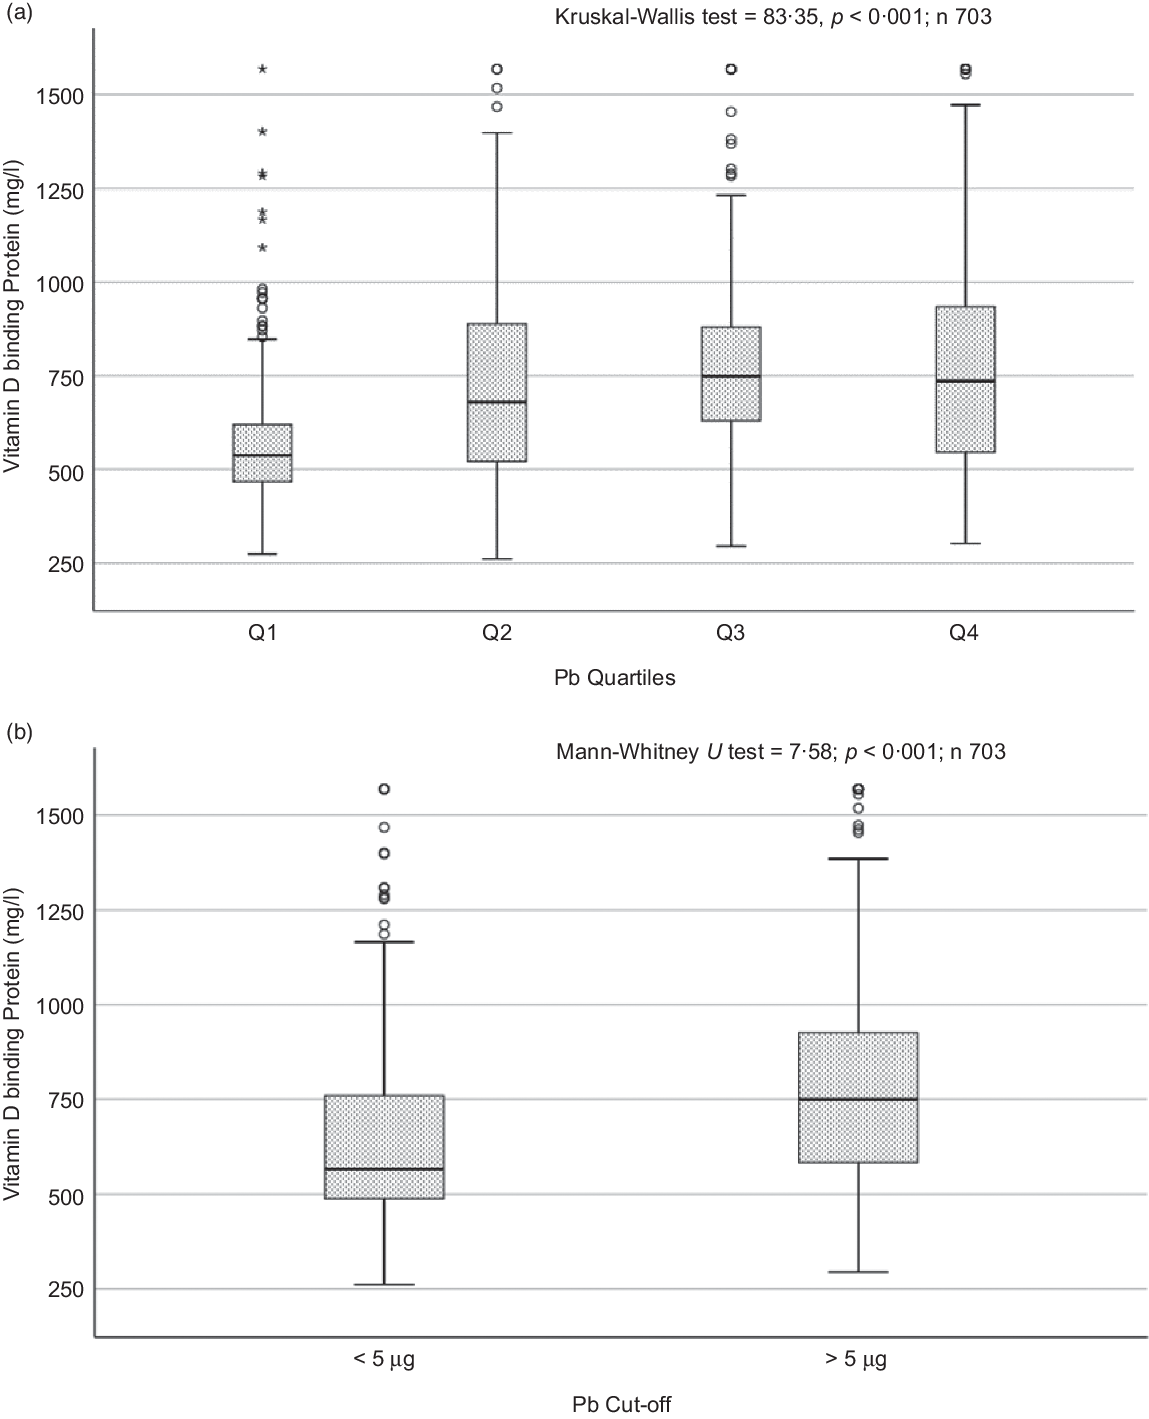
Fig. 3. Box plot showing the distribution of vitamin D binding protein (DBP) across quartiles of blood lead levels (a), and lead levels categorised based on the CDC cut-off of 5 ug/dl (b). Data were analysed by Kruskal–Wallis test in A and by Mann–Whitney U test in B.
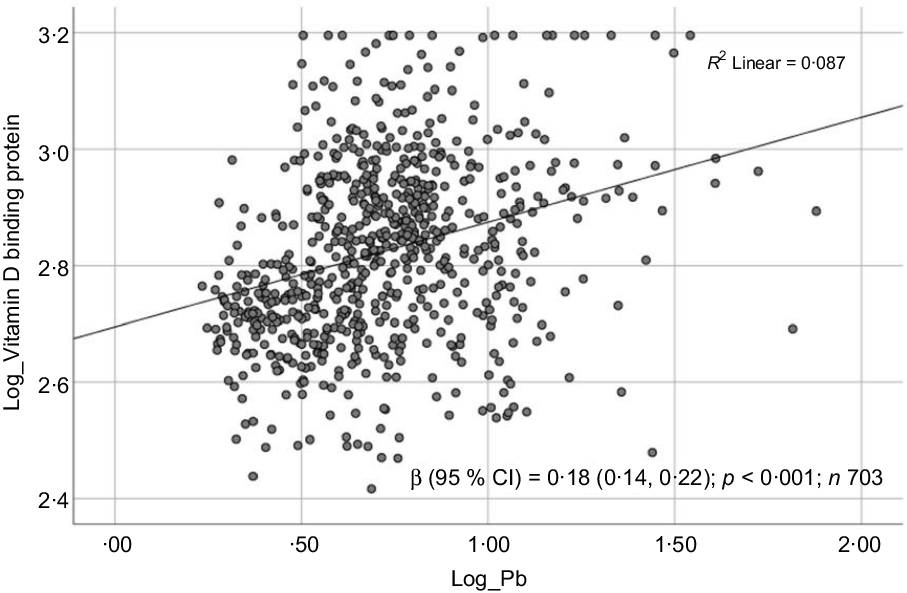
Fig. 4. Scatter plot showing the association between log-transformed vitamin D binding protein (DBP) and log-transformed blood lead level (BPbL). The coefficient (β) is in log units.
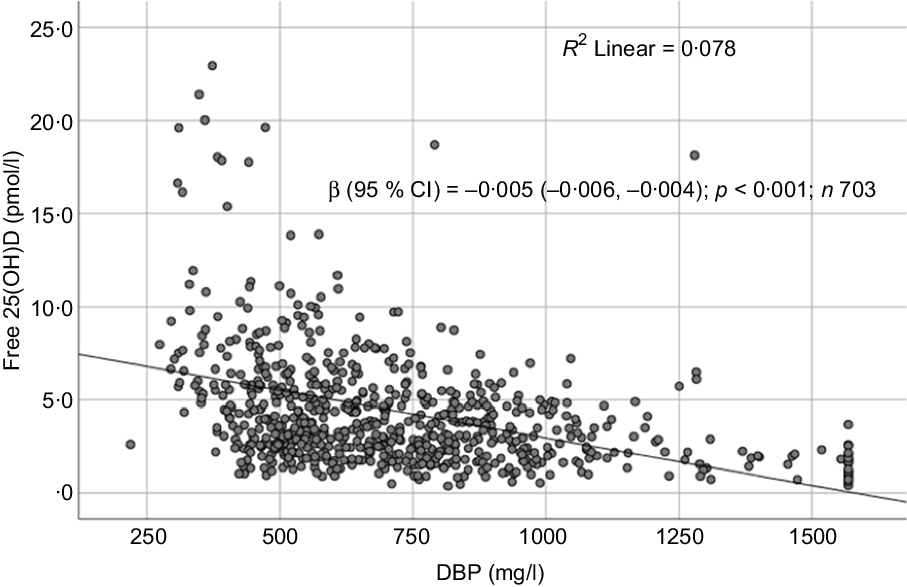
Fig. 5. Scatter plot showing the association between free 25-hydroxyvitamin D (25(OH)D) and vitamin D binding protein (DBP).
Table 2. Association between Pb and vitamin D in linear regression analysis*
(Odd ratio and 95 % confidence intervals)
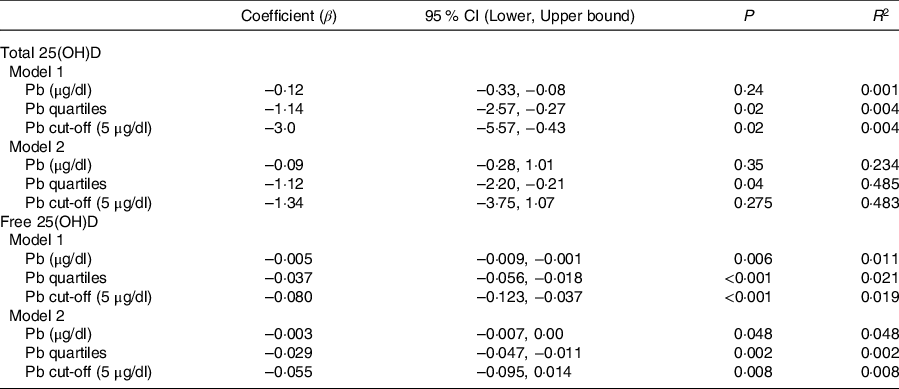
* Model 1 is unadjusted; model 2 is adjusted for sex, age categories, governorate, father education, passive smoking, taking supplements, consumption of sugary drinks, number of times walking to school per week and BMI categories. Free 25-hydroxyvitamin D ((25(OH)D) was log-transformed for regression analysis.
Table 3. Odds of vitamin D insufficiency and deficiency across quartiles of blood lead level (BPbL)*
(Odds ratio and 95 % confidence intervals)
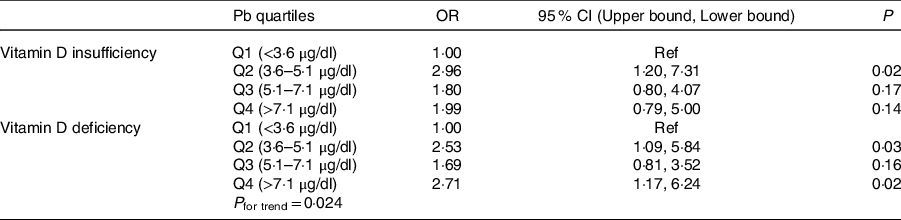
* In multinomial logistic regression, 25(OH)D was categorised into sufficient, insufficient and deficient categories and used as independent variable against. Vitamin D sufficiency was used as the reference category.
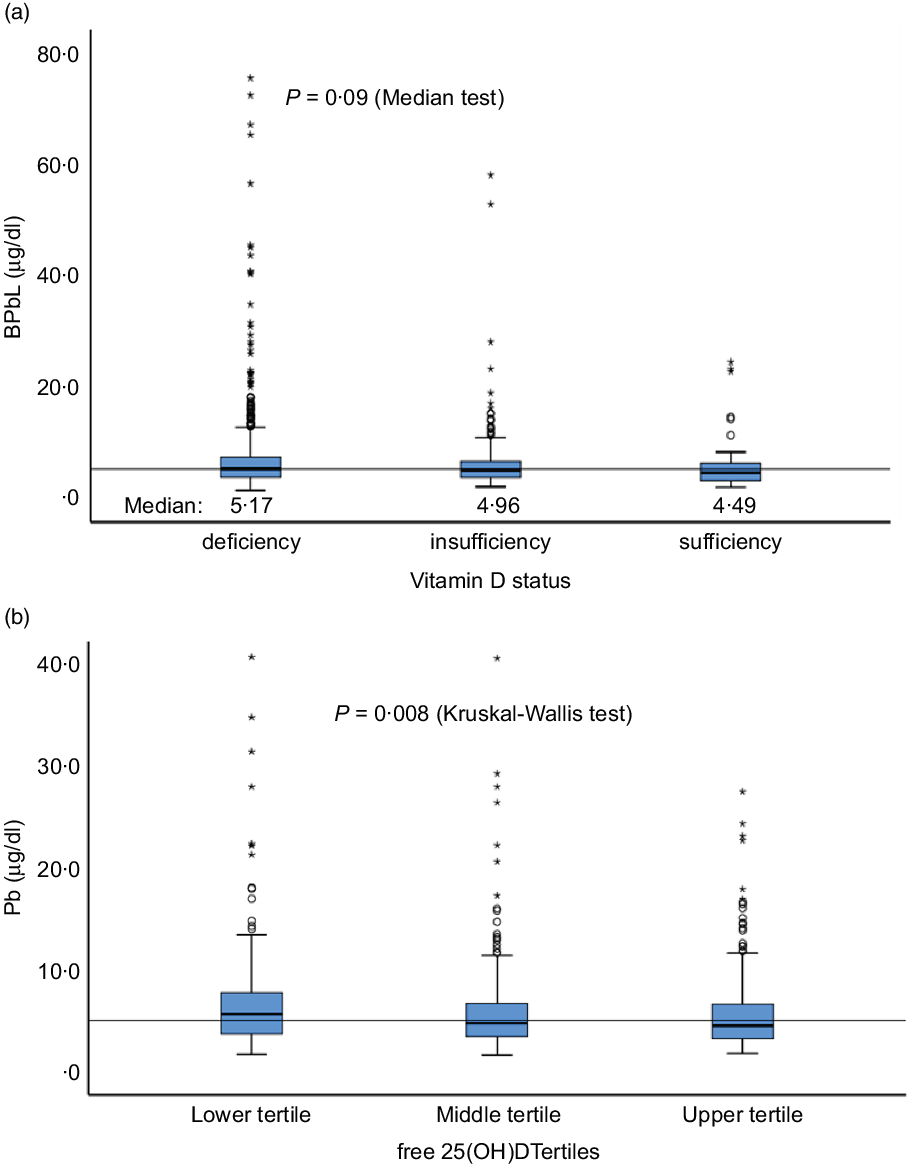
Fig. 6. Distribution of BPbL among various categories of vitamin D status. (a) Vitamin D status categories based on total 25(OH)D levels. (b) Tertiles of free 25(OH)D. Horizontal line sows the overall median value of BPbL (5·1 µg/dl). n 1100 (deficient), 199 (insufficient) and 48 (sufficient). In (a), Mann–Whitney U test between sufficient and deficient groups is significant (P = 0·048). In (b), lower v. upper tertile, P = 0·003, lower v. middle tertile, P = 0·026; middle v. upper tertile, P = 0·44.
Discussion
The main findings of this study can be summarised as follows: (1) high BPbL are associated with low levels of total and free 25(OH)D, (2) high BPbL are associated with high levels of DBP and (3) the negative association of BPbL with free 25(OH)D is more robust compared with its association with total 25(OH)D. The negative association between vitamin D metabolites and BPbL has been supported by data from animal studies in which Pb ingestion decreased serum concentration of 1,25(OH)2D and blocked vitamin D-dependent intestinal Ca transport in rats(Reference Smith, DeLuca and Tanaka32). High BPbL has been suggested to cause disruption of the renal hydroxylation of 25(OH)D by 1-α-hydroxylase to produce the active form 1,25(OH)2D(Reference Schwalfenberg and Genuis33). Similarly, exposure of rat pups to Pb resulted in significant reduction in serum 25(OH)D and 1,25(OH)2D with concomitant decrease in the expression of hepatic 25-hysroxylase and renal 1-α-hydroxylase(Reference Rahman, Al-Awadi and Khan34). The relationship between vitamin D, Ca and Pb is complex(Reference Fullmer35). Some studies reported that elevated BPbL are associated with increased 1,25(OH)2D, as a compensatory response to lower Ca absorption(Reference Kristal-Boneh, Froom and Yerushalmi36). Other studies suggested that vitamin D facilitates Pb absorption especially in suboptimal status of Ca and other minerals, which increase the risk of adverse clinical outcomes(Reference Smith, DeLuca and Tanaka32,Reference Schwalfenberg and Genuis33,Reference Edelstein, Fullmer and Wasserman37) . In rats, diet-induced VDD increased Pb absorption and vitamin D repletion decreased Pb body retention, suggesting possible relation between low vitamin D and increased Pb absorption(Reference Barton, Conrad and Harrison38). Our data do not support this later notion, as lower vitamin D levels were associated with high BPbL. Several other studies have reported similar lower BPbL levels in subjects with sufficient vitamin D levels(Reference Chang, Liu and Shi16,Reference Schwalfenberg and Genuis33,Reference Jackson, Cromer and Panneerselvamm39,Reference Arbuckle, Liang and Morisset40) .
The negative association between BPbL and total 25(OH)D in this study was not statistically significant when BPbL was used as a continuous variable. Similar to our results, no association was found between BPbL and vitamin D among Mexican adolescents who had a mean BPbL of 4·6 µg/dl(Reference Zamoiski, Guallar and García-Vargas41). On the other hand, negative association was reported between vitamin D metabolites and BPbL in several studies in which BPbL were in the range of 12 to >60 µg/dl(Reference Mazumdar, Goswami and Ali11–Reference Mahaffey, Rosen and Chesney15). In comparison with these studies which reported significant negative association, median BPbL in our study were lower (5·1 µg/dl), which may explain the lack of statistical significance in association when BPbL was used as a continuous variable. In our sample, <3 % of subjects had BPbL of >20 µg/dl. This suggests a dose-dependent negative association between BPbL and vitamin D metabolites. This notion is further supported by the fact that when we used BPbL as quartiles, the negative association between BPbL and total 25(OH)D became significant, even in the model adjusted for the known confounding variables. Differences in the age of the study participants, duration of exposure and the measured vitamin D metabolite (whether 25(OH)D or 1,25(OH)2D) could also be a factor in the strength of negative association observed in our study compared with the previous studies. Most of the previous studies are based on either younger children or older adults, as compared with our study which was based on subjects in the middle adolescence.
In this study, children who had median BPbL in the range of 3·6–5·1 µg/dl (Q2) had almost three-fold increased odds of having vitamin D insufficiency compared with those whose BPbL was <3·6 µg/dl (Q1). Similarly, the odds of VDD were more than two-fold higher in the upper quartiles of BPbL compared with the lowest quartile (OR = 2·53 in Q2 and 2·71 in Q4). Similar to our results, in a Chinese population study, VDD and vitamin D insufficiency were significantly higher among children (age range 6 months to 14 years) with BPbL ≥ 10 µg/dl, while children who had BPbL <5 µg/dl were significantly more likely to have sufficient vitamin D levels(Reference Chang, Liu and Shi16).
A small fraction of total plasma 25(OH)D (about 0·03 %) is in the unbound form, which is bioavailable for uptake by most tissues. Thus, any factor that affects the ratio of free:bound 25(OH)D will have significant physiological consequences. DBP is a multi-functional, moderately abundant protein in the serum of vertebrates and is highly expressed in the liver(Reference White and Cooke42). The level of free 25(OH)D depends on the concentration of DBP. In conditions in which DBP levels are elevated, more 25(OH)D will be protein bound and less available for tissue uptake(Reference Bikle, Gee and Halloran25). DBP levels may be affected by Pb in two ways. First, DBP is considered as a positive acute phase protein, whose level can be increased in inflammatory conditions. Chronic low-grade inflammation caused by Pb may elevate DBP levels and thus could result in lower levels of free 25(OH)D(Reference Liu, Chen and Zhang27,Reference Chibowska, Baranowska-Bosiacka and Falkowska28) . This hypothesis is supported by our findings of a positive association with DBP and a negative association with free 25(OH)D. Second, DBP is produced in the liver and is filtered out of the kidneys and reabsorbed in the renal tubules(Reference White and Cooke42). Due to the hepatotoxicity and nephrotoxicity caused by high levels of Pb(43,Reference Rastogi44) , the production of DBP by the liver and the capacity of the kidneys to reabsorb DBP might be compromised, resulting in low blood DBP levels(Reference Iruzubieta, Terán and Crespo45), and thus lower total 25(OH) levels. DBP is also important for the renal hydroxylation of 25(OH)D to 1,25(OH)2D(Reference White and Cooke42). However, as the median BPbL were relatively low in our study, this mechanism does not seem to be relevant in this population.
The negative association between BPbL and free 25(OH)D was more robust than the negative association between BPbL and total 25(OH)D. This suggests that the association between BPbL and total 25(OH)D may be confounded by DBP and therefore studies that did not show an association between BPbL and total vitamin D metabolites, whether total 25(OH)D or 1,25(OH)2D, may be interpreted with caution, and DBP levels must be taken into account in future studies.
In the linear regression analysis, using BPbL as quartiles, the effect size on total 25(OH)D levels appears to be small, although significant (β = –1·12; P = 0·04). Similarly, the difference in mean 25(OH)D levels between BPbL in Q1 and Q4 is small (35·5 (26·0) v. 31·4 (19·1); P = 0·02). Although statistically significant, this small effect size appears unlikely to be important physiologically at the individual level. However, in terms of classification as vitamin D insufficient or deficient, the difference between those who have BPbL in the lowest quartile (Q1) and those in the upper quartiles (Q2 and Q4) is more substantial, as the odds of being vitamin D insufficient or deficient are more than two-fold higher. Thus, from the public health point of view and population intervention, the effect size becomes quite significant.
This study has several strengths. First, to our knowledge, this is the first study reporting a positive association between BPbL and DBP, and a robust negative association between BPbL and free 25(OH)D. Second, we employed a very sensitive method of Pb estimation with strict quality control measures. Our method recovered 96·8 % (S1) and 96 % (S2) of Pb in the samples with known of Pb content (Seronorm). We also employed the gold standard method for 25(OH)D estimation (LC-MS/MS). Third, our study is based on a homogenous group of middle-school children with a narrow age range, thus eliminating any age-dependent effects. Fourth, this is one of the very few studies on a general population of healthy children. Most other studies on this topic are based on high-exposure groups and occupationally exposed populations. Fifth, our data are based on a nationally representative sample.
A limitation in this study is that we did not directly measure free 25(OH)D and our results are based on calculated free 25(OH)D values. It has been reported that calculated free 25(OH)D levels are generally higher than directly measured concentrations, particularly in subjects with some physiological conditions (like late pregnancy) and certain pathological conditions such as liver disease or cystic fibrosis(Reference Schwartz, Lai and Lizaola24). The ELISA that we used for measuring DBP utilised polyclonal antibody. In healthy younger individuals, free 25(OH)D using DBP measured with polyclonal antibodies correlates reasonably well with the directly measured free 25(OH)D, using either centrifugal ultrafiltration or the ELISA assay for free 25(OH)D(Reference Chun, Shieh and Gottlieb2). As such, it is unlikely that the negative association between BPbL and free (OH)D that we report here was compromised. Another potential limitation in this study is the lack of data on inflammatory markers like hsCRP. Such information could have strengthened our hypothesis of increased DBP levels due to the proinflammatory toxin, Pb. Although we analysed hsCRP levels in a small sub sample (n 180), the sample size was too small to produce statistically meaningful results. For logistical reasons, we could not analyse hsCRP in more samples.
In conclusion, our data demonstrate that BPbL is positively correlated with DBP and negatively correlated with total and free (unbound) 25(OH)D in healthy children. The negative correlation of BPbL with free 25(OH)D was more robust than its correlation with total 25(OH)D. These findings have few public health implications. First, the high prevalence of Pb toxicity may be a contributing factor in the very high prevalence of VDD in this population, and thus eliminating sources of Pb exposure may also improve vitamin D status, in addition to reducing other health risks associated with Pb toxicity. Additionally, countries having a high prevalence of both VDD and high BPbL among adolescents, such as Kuwait, should consider establishing clinical protocols to investigate Pb levels in those diagnosed with VDD, and to assess vitamin D levels in those diagnosed with high Pb levels. Given the high prevalence of both conditions, Kuwait should also assess the cost-effectiveness of screening adolescents for both conditions. Second, total plasma 25(OH)D may not be a sensitive biological marker for vitamin D status. Free (unbound) 25(OH) may be a better indicator of functional vitamin D status, particularly in situations with increased DBP level. However, methodological difficulties in measuring free 25(OH)D and the lack of a high-throughput assay at present hinder its use as a marker for vitamin D status. Further studies are needed to refine and develop a high-throughput assays for measuring free 25(OH)D. Age- and sex-specific cut-offs of free 25(OH)D for classifying vitamin D status also need to be worked out.
Acknowledgements
We thank the Ministry of Education Kuwait and the management of participating schools for facilitating this study. We thank Ms. Smitha for her excellent technical assistance, and the department of Anatomy for facilitating Pb analysis. We also thank Dr. Joseph Longenecker for revising and editing the manuscript.
Not applicable.
The study was approved by The Ethics Committee at the Ministry of Health, Kuwait (No: 2015/248) as well as The Ethics Committee of the Health Sciences Centre, Kuwait University (No: DR/EC/2338).
A. R. designed the study, contributed in data collection and analysis, wrote the manuscript, also responsible for the overall supervision of the project. R. S. designed the study, contributed in data collection and reviewed the manuscript. R. J. contributed in Pb measurement and data analysis. M. R. contributed in Pb measurement and revised the manuscript.
The authors declare that they have no competing interests.


 Open access