


Globally, the high prevalence of overweight and obesity among children and adults presents a major public health burden(Reference Ng, Fleming and Robinson1). Excess body weight (BW) is linked to a range of detrimental health and psychological outcomes(Reference Wang, McPherson and Marsh2) and while the causes are complex and multifactorial, an unhealthy dietary pattern high in energy intake is a major contributing factor(Reference Bleich, Cutler and Murray3,Reference Swinburn, Sacks and Ravussin4) . Although the key factor driving obesity is the consumption of energy intake in excess of requirements, there is emerging evidence that the consumption of dietary Na in excess of requirements in the form of salt is implicated in excess weight gain among children(Reference Grimes, Riddell and Campbell5–Reference Zhu, Pollock and Kotak7) and adults(Reference Larsen, Ängquist and Sørensen8–Reference Yoon and Oh12). Firstly, the addition of sodium chloride (salt) increases the palatability of many foods and encourages greater energy intake(Reference Bolhuis, Lakemond and de Wijk13). Secondly, population-based studies in children have indicated that a diet high in Na may encourage the consumption of energy-rich sugar-sweetened beverages (SSB)(Reference Grimes, Riddel and Campbell14–Reference He, Marrero and MacGregor16), probably via the effects of Na on thirst and resultant fluid intake(Reference He, Markandu and Sagnella17,Reference Karppanen and Mervaala18) . Although the underlying mechanisms which may link Na intake to adiposity remain to be elucidated given the ubiquity of Na in the food supply(Reference Brown, Tzoulaki and Candeias19), it is important to understand if there are additional health concerns of a high-Na diet, which go beyond the traditional concerns of blood pressure(Reference He, Li and Macgregor20) and cardiovascular health(Reference Strazzullo, D’Elia and Kandala21). This information can be used to inform obesity prevention strategies. To date, the emerging literature surrounding Na intake and adiposity outcomes in children and adults has not been systematically reviewed. The collation of this information can be used by health care providers and policy makers.
To provide insight beyond cross-sectional associations of increased Na intake and obesity(Reference Moosavian, Haghighatdoost and Surkan22), three levels of evidence are included: cross-sectional, longitudinal studies and randomised controlled trials (RCT). The primary aim of this systematic review and meta-analysis was to examine the relationship between dietary Na intake and measures of adiposity in children and adults. The primary outcome for RCT was change in BW following a reduced-Na diet; for observational studies, it was BMI and weight category (i.e. ‘healthy weight’ v. ‘overweight/obese’). Secondary outcomes for adiposity measures in observational studies included BW, abdominal obesity and body composition. Across these three levels of evidence, it was hypothesised that cross-sectionally Na intake would be positively associated with measures of adiposity, longitudinally Na intake would predict increased measures of adiposity and within RCT a reduced-Na diet would result in a reduction in BW. Because SSB consumption has previously been identified as a potential dietary factor that may mediate the relationship between higher Na intakes and adiposity outcomes(Reference Grimes, Riddel and Campbell14,Reference He, Marrero and MacGregor16,Reference Karppanen and Mervaala18) , a secondary aim of this review was to examine the relationship between Na intake and SSB consumption. Findings from this aim can aid in the interpretation of potential pathways linking Na intake with adiposity outcomes.
Methods
The protocol for this research has been published(Reference Grimes, Bolhuis and He23) and registered with the International Prospective Register of Systematic Reviews (PROSPERO) (registration number CRD42015016440). The conduct and reporting of this review adhere to the Preferred Reporting Items for Systematic Review and Meta-Analysis (PRIMSA) guidelines(Reference Moher, Liberati and Tetzlaff24). No ethical approval was required for this research.
Search strategy
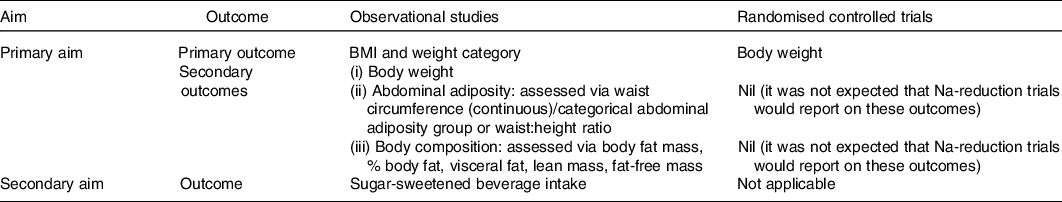
An electronic search was conducted in October 2015 using Medline Complete (EBSCO Host), CINAHL (EBSCO Host), Scopus, Embase and Cochrane central register of controlled trials (CENTRAL)(Reference Grimes, Bolhuis and He23). We searched for articles which included a measure of dietary Na/salt intake, for example, ‘sodium intake’ OR ‘salt intake’ OR ‘sodium, dietary’ and an adiposity related outcome, for example, ‘bmi’ OR ‘obes*’ OR ‘waist circumference’ OR ‘body fat’ OR ‘sugar-sweetened beverage’ (online Supplementary Table S1). An additional search strategy was developed to capture Na reduction RCT. In this search, no outcome concept was specified and the exposure concept was expanded, for example, ‘sodium redc*’ OR ‘salt restrict*’ (online Supplementary Table S2). Both searches were re-run and included articles published up until 18 July 2019. Table 1 shows the different outcomes that were examined for each aim of the study. For observational studies, we selected BMI and weight category as the primary outcome to reflect overall body size. Secondary outcomes included (i) BW, (ii) abdominal adiposity, for which we preferentially extracted either waist circumference (WC) or categorical abdominal adiposity group over waist:height ratio as these measures are more commonly cited in the literature and a better predictor of chronic disease risk and (iii) body composition, based on existing evidence in animals indicating Na intake may affect the development of adipose cells, we were primarily interested in markers of body fat (e.g. percentage body fat, fat mass and visceral fat), however to capture the full picture of Na’s potential role on body composition reported, lean mass and fat free mass measures were also extracted. For RCT, BW was selected as the primary outcome to reflect change in weight gain this is because within an RCT height is not a confounder for an individual’s body size.
Table 1. Outcomes by study design included in review
Eligibility criteria
The expertise of the research team was used to develop the inclusion and exclusion criteria. Only peer-reviewed original research articles published in English and conducted in humans aged 1+ years were included. We included cross-sectional studies and longitudinal studies (≥1 year duration) which reported on the relationship between Na intake and either a measure of adiposity or SSB consumption. As the research question relates to the effect of Na intake on adiposity outcomes, we only included cross-sectional studies that reported associations with Na intake as the independent variable and a measure of adiposity as the dependent variable. This meant that studies which reported findings as linear regression using models with adiposity outcomes as the independent variable and Na intake as the dependent variable were excluded; in addition, studies that presented Na intake by weight category with ANOVA analysis were excluded. We included RCT which measured BW and included a Na reduction arm ≥3 months with a control group, that is, ‘usual care/regular diet’. Those with a Na reduction arm <3 months were excluded due to the short-term effects of Na reduction on extracellular fluid loss and change in BW. RCT which included weight loss promoting strategies within the Na reduction arm (i.e. reduced energy intake, low-fat diet and physical activity) or were designed to achieve weight loss were excluded as it would not be possible to discern the effects of Na on BW alone. For RCT with multiple intervention arms (e.g. weight loss group, Na reduction only group and combined treatment group), we only extracted data for the Na reduction group and control group. RCT in which participants were taking antihypertensive medications within a salt reduction intervention were included; however, studies in which diuretic therapy commenced during the intervention were excluded. On reviewing the results of our search, RCT of salt restriction studies which incorporated testing drug therapy known to affect appetite (e.g. paricalcitol) were excluded.
We included both dietary (e.g. 24-h dietary recalls, food records and FFQ) and urinary measures (e.g. 24-h urine, overnight urine and spot urine) for Na intake; however, studies which did not extrapolate a spot urine measure of Na concentration to an estimate of daily intake were excluded. For all study types where more than one measure of Na intake was reported (e.g. urine and dietary) data from urinary measures were preferentially extracted in this order 24-h urine collection, spot urine and overnight urine. Studies that used a crude measure of Na intake, for example, salty snack consumption, were excluded. Other exclusion criteria were (1) studies which included participants with renal disease, cancer, type 1 diabetes or heart failure, who had undergone bariatric surgery or who were pregnant and (2) studies in which data could not be accurately extracted from figures. Finally, in studies that used the same study population, we included the study with the largest sample size or if the sample size was the same across studies, which reported on the most comprehensive range of adiposity outcomes and/or adjusted for the most covariates. In observational studies which reported relevant cross-sectional and longitudinal data, data were preferentially extracted from the longitudinal analysis.
Data extraction
For 80 % of studies, data were extracted in duplicate (C. G. extracted data for every study, duplicate extraction was performed by either A. B., D. K., K. L. or C. S., the other 20 % of studies were extracted by one reviewer (C. G.) and data were reviewed and confirmed by a second reviewer (K. B.)). Any discrepancies were resolved via discussion and where necessary with a third reviewer (C. N.). We extracted the following data: (1) general characteristics of the study, (2) participant demographic characteristics, (3) Na intake and assessment method, (4) definition of overweight and obesity and (5) confounder adjustment. Summary tables of individual study characteristics (online Supplementary Tables S3, S9, S11 and S13) and findings organised by outcome (online Supplementary Tables S5–S9, S15–S19) are provided in online Supplementary Tables. For observational studies, data for all different measures of adiposity reported were extracted; for children, BMI z-score was preferentially extracted over BMI. For continuous data in order of preference, the following was extracted: (i) means (sd, se or 95 % CI) of adiposity measures across ntiles of Na intake and/or regression β-coefficients (95 % CI or se) representing the difference in adiposity measure associated with a unit difference in Na intake and (ii) correlation coefficients. For categorical data, OR (95 % CI or se) for the risk of adiposity outcome across ntiles of Na intake and/or OR (95 % CI or se) for the risk of adiposity outcome associated with a unit difference in Na intake were extracted. In all cases, the most adjusted model was preferentially extracted and used in meta-analyses. However, due to the possible confounding effects of energy and SSB intake, where possible we extracted data from models with and without additional energy adjustment (i.e. ‘adjusted base model (e.g. sex, age, socio-economic status) + energy intake’ v. ‘adjusted base model’). For RCT, we extracted baseline and post-Na intake and information on outcome data (i.e. mean change in BW from baseline to end of intervention and an associated measure of variance, e.g. sd, se or 95 % CI for control and intervention groups).
Quality assessment
A modified version of the Newcastle–Ottawa Scale (NOS) for cohort studies was used to assess the study quality of cross-sectional and longitudinal studies(Reference Wells, Shea and O’Connell25). This tool assigns stars (0–7) to indicate higher quality based on three criteria (i.e. selection of study groups, comparability and outcome assessment). We modified the tool to suit the context of studies included in this review. For example, within the ‘selection of study groups criteria’ it was not relevant to include NOS categories of ‘selection of the non-exposed cohort’, and ‘demonstration that outcome of interest was not present at the start of the study’ as such these were removed and the methodology used to determine Na intake was considered, for example, ‘assessment of the exposure’ whereby 24-h urine collection was considered of higher quality and scored more stars compared with a spot urine collection or FFQ. We also altered the options for ‘Assessment of outcome’ to be relevant to the study review, for example, more stars were assigned for an objectively measured adiposity outcome compared with a self-report measure. Some studies which presented results for more than one adiposity outcome varied in the number/types of covariates adjusted for across outcomes. For our scoring, we based the criteria ‘comparability’ on those covariates which were adjusted for in the model related to our primary outcome, that is, BMI/weight category. Studies with total scores of ≥5*, 3–4* and ≤2* were defined as high-, moderate- and low-quality studies, respectively. The final scoring system used across the three NOS criteria for adiposity outcomes for cross-sectional studies can be found in online Supplementary Table S4 and for longitudinal studies in online Supplementary Table S10. The final scoring system used for SSB as an outcome for both cross-sectional and longitudinal studies can be found in online Supplementary Table S20. For RCT, a modified version of the Cochrane’s Collaboration risk of bias tool was used(Reference Higgins, Altman and Gotzsche26). The domain ‘selective outcome reporting’ was omitted as it was deemed inapplicable as our primary outcome BW was not listed as an outcome in any of the assessed trials.
Data synthesis and analysis
The findings of all included studies are presented in online Supplementary summary tables organised by study type. A meta-analysis was performed if ≥3 studies reported on an adiposity outcome in a consistent manner that allowed for pooled analysis. Findings from studies not included in meta-analyses were presented as a qualitative summary.
Observational studies
Due to variation in data presented across cross-sectional studies, there were four types of meta-analyses that were performed. Continuous data: (i) pooled mean difference in adiposity outcome between the lowest and highest ntile of salt intake. Mean difference (D) was calculated as $ = {\rm{upper\;{\it n}tile}}\;\mu\; - {\rm{lower\;{\it n}tile\;}}\mu $
and se
$ = {\rm{upper\;{\it n}tile}}\;\mu\; - {\rm{lower\;{\it n}tile\;}}\mu $
and se $_{\it{D}}} = \sqrt {{\rm{varianc}}{{\rm{e}}_{\it{D}}}} \;,\;{\rm{where}}\;{\rm{varianc}}{{\rm{e}}_{\it{D}}} = {{\;\frac{{{\rm{SD}}}{1^2}}}\over{{n1}}}}\; + \;{\frac{{{\rm{SD}}{2^2}}}\over{{n2}}$
(Reference Borenstein, Hedges and Higgins27). For individual studies where the sd of means was not available, these were calculated from reported se, 95 % CI or P value using standard formulas(Reference Higgins and Green28). (ii) Pooled β-coefficient representing difference in adiposity outcome associated with an additional 393 mg/d of Na (equivalent 1 g/d of salt). Where necessary results from individual studies were standardised to reflect a unit difference in Na intake of 393 mg/d (1 g/d salt equivalent). Studies which only reported standardised regression coefficients were excluded from the pooled analyses. Categorical data: (i) pooled OR for risk of adiposity outcome (i.e. either overweight/obesity or abdominal obesity) comparing participants between the lowest and highest ntile for Na intake and (ii) pooled OR for risk of adiposity outcome associated with an additional 393 mg/d of Na (1 g/d salt). For meta-analyses, all reported OR (se) were converted to log scale(Reference Higgins and Green28). Due to a low number of retrieved studies and large variation in reporting, it was not possible to pool estimates for longitudinal studies. For the secondary aim related to SSB, only studies in children were retrieved and pooled analysis was conducted using the β-coefficient (se) associated with an additional 393 mg/d of Na (1 g/d salt).
$_{\it{D}}} = \sqrt {{\rm{varianc}}{{\rm{e}}_{\it{D}}}} \;,\;{\rm{where}}\;{\rm{varianc}}{{\rm{e}}_{\it{D}}} = {{\;\frac{{{\rm{SD}}}{1^2}}}\over{{n1}}}}\; + \;{\frac{{{\rm{SD}}{2^2}}}\over{{n2}}$
(Reference Borenstein, Hedges and Higgins27). For individual studies where the sd of means was not available, these were calculated from reported se, 95 % CI or P value using standard formulas(Reference Higgins and Green28). (ii) Pooled β-coefficient representing difference in adiposity outcome associated with an additional 393 mg/d of Na (equivalent 1 g/d of salt). Where necessary results from individual studies were standardised to reflect a unit difference in Na intake of 393 mg/d (1 g/d salt equivalent). Studies which only reported standardised regression coefficients were excluded from the pooled analyses. Categorical data: (i) pooled OR for risk of adiposity outcome (i.e. either overweight/obesity or abdominal obesity) comparing participants between the lowest and highest ntile for Na intake and (ii) pooled OR for risk of adiposity outcome associated with an additional 393 mg/d of Na (1 g/d salt). For meta-analyses, all reported OR (se) were converted to log scale(Reference Higgins and Green28). Due to a low number of retrieved studies and large variation in reporting, it was not possible to pool estimates for longitudinal studies. For the secondary aim related to SSB, only studies in children were retrieved and pooled analysis was conducted using the β-coefficient (se) associated with an additional 393 mg/d of Na (1 g/d salt).
Randomised controlled trials
For RCT, the pooled outcome was net change in BW (D) with their standard errors (kg) between reduced-Na group and control group (i.e. difference in change from baseline between intervention and control group). For most studies which did not report the se of D, this was calculated from the reported between groups P value or 95 % CI(Reference Appel, Espeland and Easter29–Reference Staessen, Broughton and Fletcher35) using standard formulas(Reference Higgins and Green28). For six studies(Reference Beard, Cooke and Gray36–Reference Nouvenne, Meschi and Prati40), we used information on within group change in BW and its associated sd and the formula: D = experimental within group difference for body weight − control within group difference for body weight and sE
D $ = \sqrt {{\rm{varianc}}{{\rm{e}}_D}} \;{\rm{where}}\;{\rm{varianc}}{{\rm{e}}_D} = {\rm{ }}{{{\rm{SD}}{1^2}} \over {n1}} + {\rm{ }}{{{\rm{SD}}{2^2}} \over {n2}}$
(Reference Borenstein, Hedges and Higgins27). For three of these studies(Reference Beard, Cooke and Gray36–Reference Gilleran, O’Leary and Bartlett38), the input values of within group mean difference and its associated sd were first calculated using the formula within group mean difference (diff) = post body weight − baseline body weight and sd
diff
$ = \sqrt {{\rm{varianc}}{{\rm{e}}_D}} \;{\rm{where}}\;{\rm{varianc}}{{\rm{e}}_D} = {\rm{ }}{{{\rm{SD}}{1^2}} \over {n1}} + {\rm{ }}{{{\rm{SD}}{2^2}} \over {n2}}$
(Reference Borenstein, Hedges and Higgins27). For three of these studies(Reference Beard, Cooke and Gray36–Reference Gilleran, O’Leary and Bartlett38), the input values of within group mean difference and its associated sd were first calculated using the formula within group mean difference (diff) = post body weight − baseline body weight and sd
diff $ = {\rm{ }}\sqrt {{\rm{SD}}_1^2 + {\rm{SD}}_2^2 - 2 \times r \times {\rm{S}}{{\rm{D}}^1}\; \times {\rm{S}}{{\rm{D}}^2}} $
, assuming a correlation coefficient r 0·6 for repeated measures of BW. Where BW measures were available at multiple time points, we used data from the latest time point available. For RCT which included a measure of BW but did not report required information on change in BW between groups and were published in the last 10 years (i.e. 2007 onwards) (n 10), we contacted the authors via email (maximum three times) requesting this information(Reference Nouvenne, Meschi and Prati40–Reference Zhou, Webster and Fu49). Two provided relevant data(Reference He, Wu and Feng39,Reference Nouvenne, Meschi and Prati40) .
$ = {\rm{ }}\sqrt {{\rm{SD}}_1^2 + {\rm{SD}}_2^2 - 2 \times r \times {\rm{S}}{{\rm{D}}^1}\; \times {\rm{S}}{{\rm{D}}^2}} $
, assuming a correlation coefficient r 0·6 for repeated measures of BW. Where BW measures were available at multiple time points, we used data from the latest time point available. For RCT which included a measure of BW but did not report required information on change in BW between groups and were published in the last 10 years (i.e. 2007 onwards) (n 10), we contacted the authors via email (maximum three times) requesting this information(Reference Nouvenne, Meschi and Prati40–Reference Zhou, Webster and Fu49). Two provided relevant data(Reference He, Wu and Feng39,Reference Nouvenne, Meschi and Prati40) .
All meta-analyses were performed using inverse variance-weighted random effects. Forest plots were used to display results from meta-analyses. Total sample size estimates were preferentially used in meta-analysis; however, if only stratified sub-group estimates were reported (e.g. male and female) these were utilised. Statistical heterogeneity was assessed using the Cochran’s Q statistic, indicated by a P value of <0·10 and the I 2 statistic with 95 % CI(Reference Ioannidis, Patsopoulos and Evangelou50); values of 30–50, 50–75 and 75–100 % indicated moderate, substantial and considerable heterogeneity(Reference Higgins and Green28). Where sufficient study numbers allowed (≥3 studies in each sub-group), potential sources of heterogeneity were explored using sub-group analyses (i) Na intake assessment method (e.g. self-reported v. urinary measures), (ii) study quality and (iii) sex. To explore the potential confounding effect of energy intake on the association between Na intake and adiposity outcomes, sensitivity analyses of separate meta-analyses were completed in the subsets of studies that adjusted for energy intake. This was completed in cases where there were ≥3 effect sizes which could be combined. Publication bias was only assessed for meta-analyses that included ≥10 studies(Reference Higgins and Green28). This was completed using funnel plots and Egger’s test for asymmetry(Reference Higgins and Green28). STATA/SE software (StataCorp LP) 15.0 was used to perform all statistical analyses.
Results
The screening process for observational studies is displayed in Fig. 1. Ultimately, there were eighty-one studies included in the systematic review, seventy-five cross-sectional and six longitudinal. Thirty-six cross-sectional studies were included in meta-analysis. The screening process for RCT is displayed in Fig. 2. Sixteen studies were included in the systematic review and fifteen of these in meta-analysis. Overall, across both search strategies, a greater number of studies in adults were retrieved as opposed to in children. Results are presented for adults, followed by children. For each population group, findings are presented across each of the three study designs (cross-sectional, longitudinal and, RCT). This is completed for the primary aim related to adiposity measures and then repeated for the secondary aim related to SSB consumption.

Fig. 1. Flow chart showing search strategy and study selection for observational studies. * Studies with insufficient data included those in which relevant data for sodium and adiposity outcomes were not presented. † Inaccurate measure of sodium included studies which used a measure of discretionary salt use only, a crude measure at the family or household level, sodium from snack or salty foods only or no information was provided on method for sodium intake assessment. ‡ Two studies included both adults and children(Reference Ma, He and Macgregor9,Reference Yoon and Oh12) .
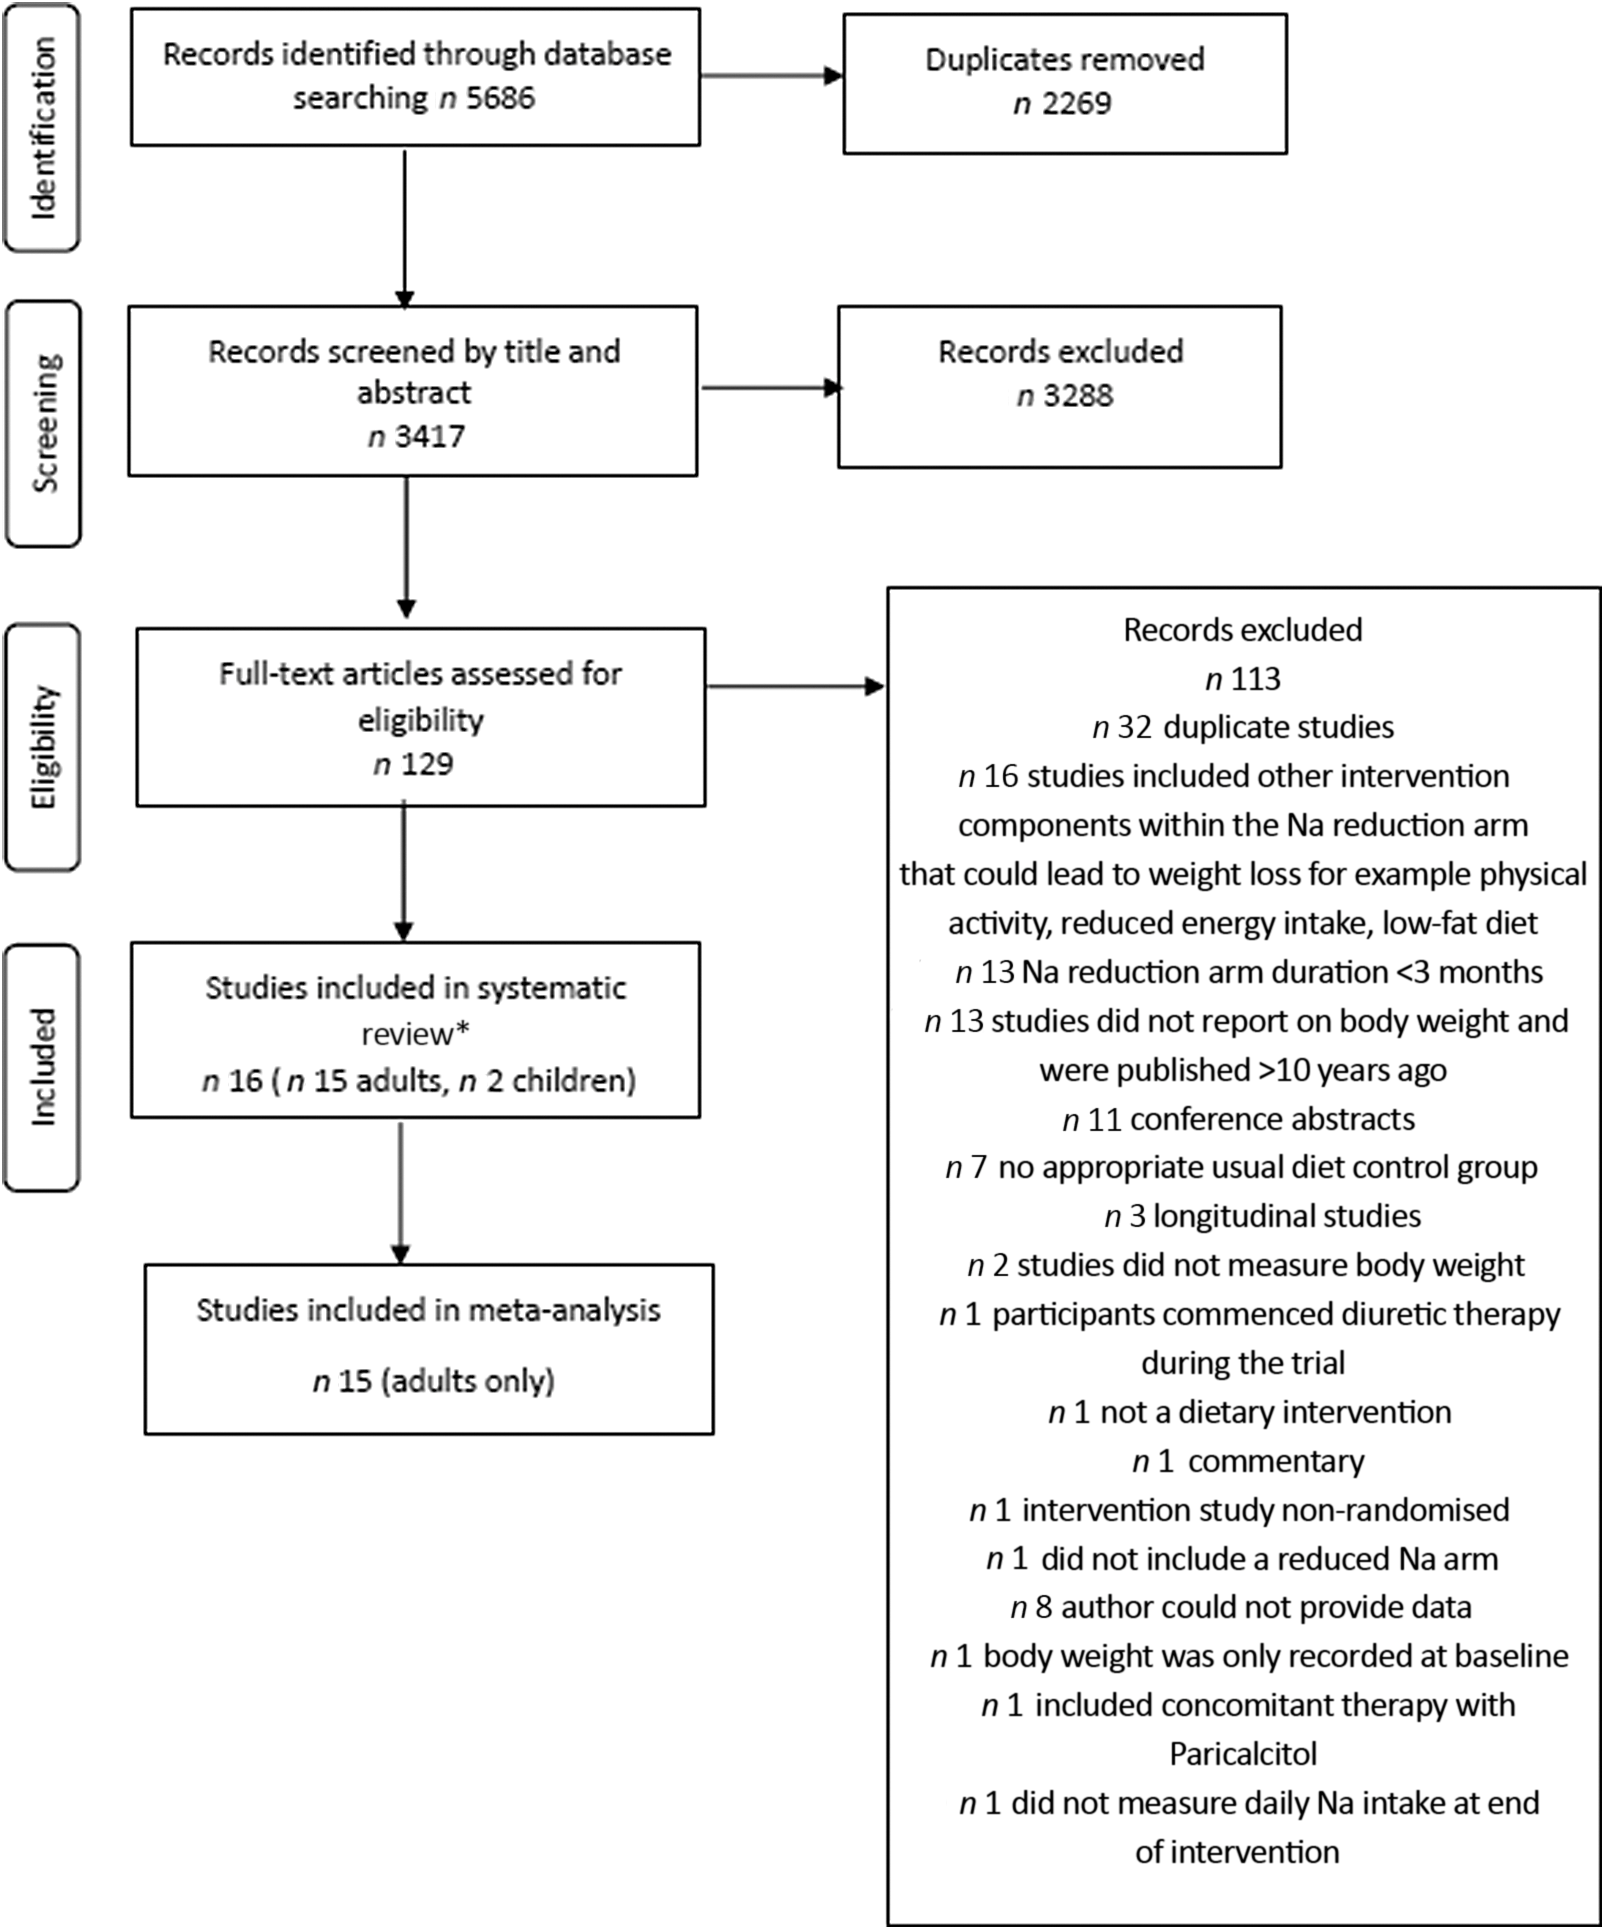
Fig. 2. Flow chart showing search strategy and study selection for randomised controlled trials. * Two studies included both adults and children(Reference He, Wu and Feng39).
Adults: cross-sectional studies (adiposity outcomes)
Fifty-nine cross-sectional studies reported on the association between Na intake and a measure of adiposity (online Supplementary Table S3)(Reference Ma, He and Macgregor9–Reference Yoon and Oh12,Reference Staessen, Broughton and Fletcher35,Reference Aballay, Osella and De La Quintana51–Reference Zhou, Stamler and Chan104) ; thirty-three of these were included in meta-analyses(Reference Ma, He and Macgregor9–Reference Yi and Kansagra11,Reference Baudrand, Campino and Carvajal53,Reference Elfassy, Mossavar-Rahmani and Van Horn59,Reference Eufinger, Votaw and Faber60,Reference Ge, Guo and Chen62,Reference Han, Hu and Tang63,Reference Hoffmann and Cubeddu65–Reference Hulthén, Aurell and Klingberg67,Reference Lee, Cho and Bae69–Reference Madhavan and Alderman71,Reference Nam, Kim and Choi73,Reference Oh, Han and Han75,Reference Ohta, Kimura and Kitaoka76,Reference Perin, Cornélio and Rodrigues79,Reference Petermann-Rocha, Sillars and Brown80,Reference Radhika, Sathya and Sudha83,Reference Rhee, Kim and Kim85,Reference Sharma, McFann and Chonchol88,Reference Song, Cho and Lee91,Reference Vega-Vega, Fonseca-Correa and Mendoza-De la Garza93,Reference Verhave, Hillege and Burgerhof95,Reference Watanabe, Konta and Ichikawa97–Reference Zhou, Stamler and Chan104) . Reasons for exclusion from meta-analyses included: findings were only presented as correlation coefficients (n 16)(Reference Staessen, Broughton and Fletcher35,Reference Buranakitjaroen and Phoojaroenchanachai54–Reference Cheung, Ho and Cheung56,Reference Ferdaus, Kohno and Hamano61,Reference Jiet and Soma68,Reference Pan, Tseng and You77,Reference Perin, Cornelio and Oliveira78,Reference Polonia, Maldonado and Ramos81,Reference Polonia, Martins and Pinto82,Reference Rashidah, Yeo and Noor Ani84,Reference Ribi, Zakotnik and Vertnik86,Reference Sanchez-Castillo, Warrender and Whitehead87,Reference Shim, Ryu and Hwang90,Reference Strazzullo, Trevisan and Farinaro92,Reference Villani, Clifton and Keogh96) or as standardised regression coefficients (n 4)(Reference Choi and Heo57,Reference Hashimoto, Takase and Okado64,Reference Shay, Van Horn and Stamler89,Reference Venezia, Barba and Russo94) , the exposure variable was presented as Na density (n 2)(Reference Yoon and Oh12,Reference Murakami, Livingstone and Sasaki72) or 24-h urinary Na excretion was reported as Na concentration (mmol/l)(Reference Navia, Aparicio and Perea74) or on a logarithmic scale(Reference Afşar and Kirkpantur52,Reference Crouch, Ware and Gafane-Matemane58) . Of the studies included in meta-analyses, fourteen were from Asia(Reference Ge, Guo and Chen62,Reference Han, Hu and Tang63,Reference Huh, Lim and Lee66,Reference Lee, Cho and Bae69,Reference Lee, Kim and Kim70,Reference Nam, Kim and Choi73,Reference Oh, Han and Han75,Reference Ohta, Kimura and Kitaoka76,Reference Radhika, Sathya and Sudha83,Reference Rhee, Kim and Kim85,Reference Song, Cho and Lee91,Reference Watanabe, Konta and Ichikawa97,Reference Yan, Guo and Wang100,Reference Yokokawa, Yuasa and Nedsuwan101) , eight from the USA(Reference Yi, Firestone and Beasley10,Reference Yi and Kansagra11,Reference Elfassy, Mossavar-Rahmani and Van Horn59,Reference Eufinger, Votaw and Faber60,Reference Madhavan and Alderman71,Reference Sharma, McFann and Chonchol88,Reference Zhang, Wang and Li102,Reference Zhao, Cogswell and Yang103) , five from South and Central America(Reference Baudrand, Campino and Carvajal53,Reference Hoffmann and Cubeddu65,Reference Perin, Cornélio and Rodrigues79,Reference Petermann-Rocha, Sillars and Brown80,Reference Vega-Vega, Fonseca-Correa and Mendoza-De la Garza93) , four from Europe(Reference Ma, He and Macgregor9,Reference Hulthén, Aurell and Klingberg67,Reference Verhave, Hillege and Burgerhof95,Reference Welsh, Welsh and Jhund99) , one from Samoa(Reference Webster, Su’a and Ieremia98) and one included data collected across four countries (e.g. Japan, USA, UK and China)(Reference Zhou, Stamler and Chan104). Most studies included female and male participants; however, two studies were restricted to males(Reference Eufinger, Votaw and Faber60,Reference Hulthén, Aurell and Klingberg67) . The measure of Na intake varied across studies, seventeen studies used 24-h urine collections, either 1 d(Reference Ma, He and Macgregor9,Reference Yi and Kansagra11,Reference Baudrand, Campino and Carvajal53,Reference Elfassy, Mossavar-Rahmani and Van Horn59,Reference Ge, Guo and Chen62,Reference Hulthén, Aurell and Klingberg67,Reference Madhavan and Alderman71,Reference Perin, Cornélio and Rodrigues79,Reference Rhee, Kim and Kim85,Reference Vega-Vega, Fonseca-Correa and Mendoza-De la Garza93,Reference Webster, Su’a and Ieremia98,Reference Yan, Guo and Wang100) or 2 d(Reference Hoffmann and Cubeddu65,Reference Nam, Kim and Choi73,Reference Verhave, Hillege and Burgerhof95,Reference Zhao, Cogswell and Yang103,Reference Zhou, Stamler and Chan104) , nine studies used spot urine collections(Reference Han, Hu and Tang63,Reference Huh, Lim and Lee66,Reference Lee, Cho and Bae69,Reference Lee, Kim and Kim70,Reference Oh, Han and Han75,Reference Ohta, Kimura and Kitaoka76,Reference Petermann-Rocha, Sillars and Brown80,Reference Watanabe, Konta and Ichikawa97,Reference Zhang, Wang and Li102) , one study used overnight urine collections(Reference Yokokawa, Yuasa and Nedsuwan101), four studies used 24-h dietary recalls(Reference Yi and Kansagra11,Reference Sharma, McFann and Chonchol88,Reference Song, Cho and Lee91,Reference Zhang, Wang and Li102) and three studies used FFQ(Reference Aballay, Osella and De La Quintana51,Reference Eufinger, Votaw and Faber60,Reference Radhika, Sathya and Sudha83) . Most of these studies (24/33) reported on more than one adiposity outcome (online Supplementary Table S3). Outcomes which were included in separate meta-analyses were BMI (n 31)(Reference Ma, He and Macgregor9–Reference Yi and Kansagra11,Reference Baudrand, Campino and Carvajal53,Reference Elfassy, Mossavar-Rahmani and Van Horn59,Reference Eufinger, Votaw and Faber60,Reference Han, Hu and Tang63,Reference Hoffmann and Cubeddu65–Reference Hulthén, Aurell and Klingberg67,Reference Lee, Cho and Bae69–Reference Madhavan and Alderman71,Reference Nam, Kim and Choi73,Reference Oh, Han and Han75,Reference Ohta, Kimura and Kitaoka76,Reference Perin, Cornélio and Rodrigues79,Reference Petermann-Rocha, Sillars and Brown80,Reference Radhika, Sathya and Sudha83,Reference Rhee, Kim and Kim85,Reference Sharma, McFann and Chonchol88,Reference Vega-Vega, Fonseca-Correa and Mendoza-De la Garza93,Reference Verhave, Hillege and Burgerhof95,Reference Watanabe, Konta and Ichikawa97–Reference Zhou, Stamler and Chan104) , weight category (n 8)(Reference Ma, He and Macgregor9,Reference Yi and Kansagra11,Reference Han, Hu and Tang63,Reference Nam, Kim and Choi73,Reference Song, Cho and Lee91,Reference Watanabe, Konta and Ichikawa97,Reference Zhao, Cogswell and Yang103,Reference Zhou, Stamler and Chan104) , BW (n 7)(Reference Eufinger, Votaw and Faber60,Reference Hoffmann and Cubeddu65,Reference Hulthén, Aurell and Klingberg67,Reference Madhavan and Alderman71,Reference Nam, Kim and Choi73,Reference Vega-Vega, Fonseca-Correa and Mendoza-De la Garza93,Reference Yokokawa, Yuasa and Nedsuwan101) , WC (n 9)(Reference Ma, He and Macgregor9,Reference Hoffmann and Cubeddu65,Reference Huh, Lim and Lee66,Reference Lee, Kim and Kim70,Reference Nam, Kim and Choi73,Reference Oh, Han and Han75,Reference Petermann-Rocha, Sillars and Brown80,Reference Radhika, Sathya and Sudha83,Reference Yan, Guo and Wang100) and abdominal obesity (n 5)(Reference Ge, Guo and Chen62,Reference Huh, Lim and Lee66,Reference Nam, Kim and Choi73,Reference Zhang, Wang and Li102,Reference Zhao, Cogswell and Yang103) . Only nine studies adjusted for energy intake(Reference Ma, He and Macgregor9,Reference Yi, Firestone and Beasley10,Reference Elfassy, Mossavar-Rahmani and Van Horn59,Reference Huh, Lim and Lee66,Reference Nam, Kim and Choi73,Reference Song, Cho and Lee91,Reference Zhang, Wang and Li102–Reference Zhou, Stamler and Chan104) and three studies adjusted for SSB intake(Reference Ma, He and Macgregor9,Reference Yi and Kansagra11,Reference Zhao, Cogswell and Yang103) .
Quality assessment
Based on the NOS, studies included in the meta-analyses were deemed as either low (n 10, 30 %), moderate (n 13, 40 %) or high quality (n 10, 30 %) (online Supplementary Table S4). Studies which were included in the systematic review were deemed as either low (n 5, 19 %), moderate (n 16, 62 %) or high quality (n 5, 19 %).
Primary adiposity outcome: BMI
Fifty-one studies reported on the relationship between Na intake and BMI (online Supplementary Tables S3 and S5); thirty-one of which were included in meta-analyses.
Meta-analyses findings: BMI
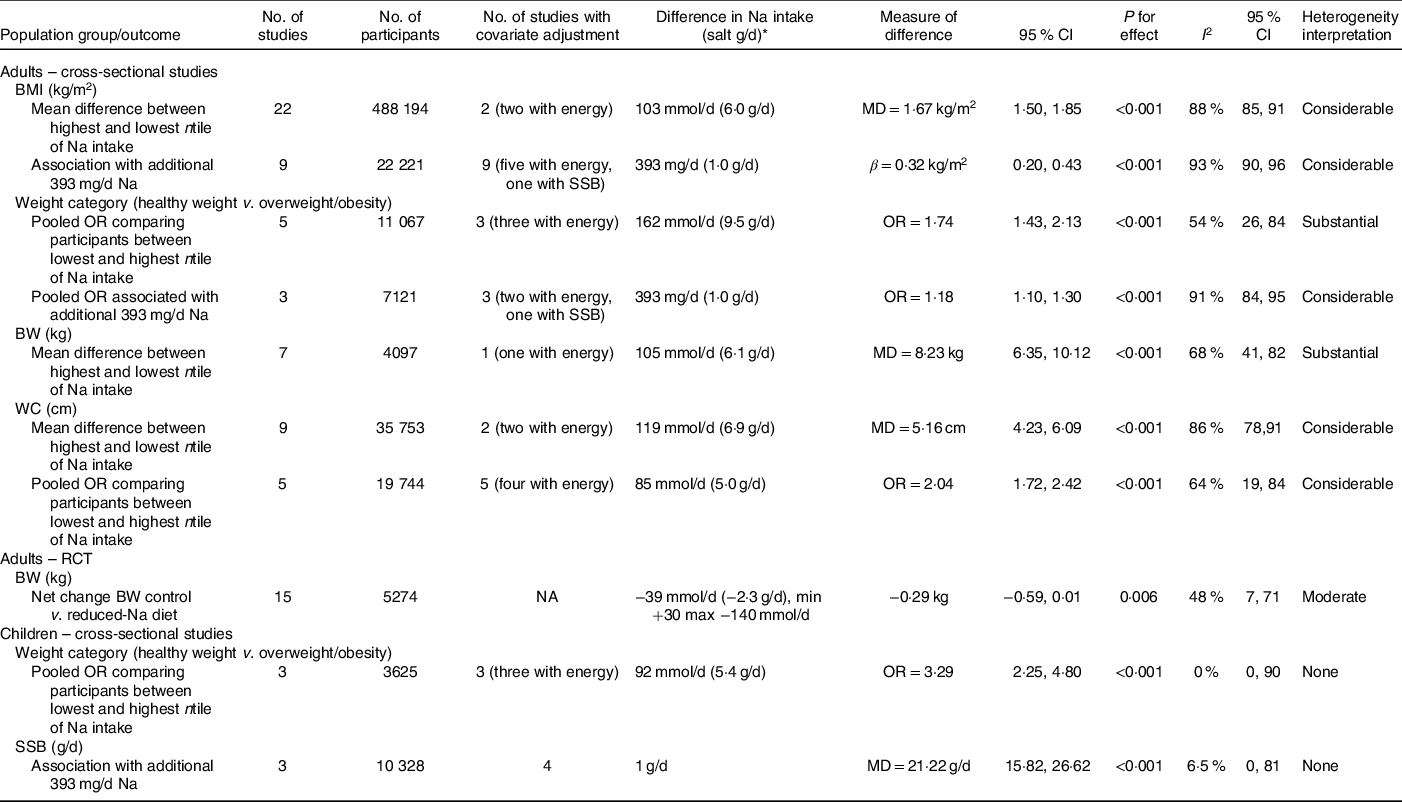
Studies (n 22) which reported mean BMI across ntiles of Na intake were combined in one meta-analysis(Reference Ma, He and Macgregor9,Reference Baudrand, Campino and Carvajal53,Reference Eufinger, Votaw and Faber60,Reference Han, Hu and Tang63,Reference Hoffmann and Cubeddu65–Reference Hulthén, Aurell and Klingberg67,Reference Lee, Kim and Kim70,Reference Madhavan and Alderman71,Reference Nam, Kim and Choi73,Reference Oh, Han and Han75,Reference Perin, Cornélio and Rodrigues79,Reference Petermann-Rocha, Sillars and Brown80,Reference Radhika, Sathya and Sudha83,Reference Rhee, Kim and Kim85,Reference Sharma, McFann and Chonchol88,Reference Vega-Vega, Fonseca-Correa and Mendoza-De la Garza93,Reference Verhave, Hillege and Burgerhof95,Reference Watanabe, Konta and Ichikawa97,Reference Welsh, Welsh and Jhund99–Reference Yokokawa, Yuasa and Nedsuwan101) . Findings from this pooled analysis (thirty effect sizes; 488 194 participants) showed BMI was greater among adults in the highest ntile of Na intake v. those in the lowest ntile of Na intake (BMI mean difference: 1·67 kg/m2; 95 % CI 1·50, 1·85; P < 0·001) (Table 2, online Supplementary Fig. S1). The difference in Na intake between ntile cut-points varied across studies (online Supplementary Table S5, e.g. ranged from 31 mmol/d (salt 1·8 g/d) to 237 mmol/d (salt 13·8 g)). The average difference between the highest and lowest ntile was 103 mmol/d of Na (salt 6·0 g/d). The funnel plot suggested publication bias, that is, smaller studies showing null or smaller differences in BMI seemed to be under-reported in the literature (online Supplementary Fig. S2). However, the Egger’s regression asymmetry test was not significant (P = 0·637). Considerable heterogeneity (Cochran’s Q statistic P < 0·001; I 2 88 %; 95 % CI 85, 91 %) was detected. For the most part, this remained in sub-group analyses by Na intake assessment method (online Supplementary Fig. S3) and by study quality (online Supplementary Fig. S4). Within the sub-group analyses, the greatest effect size was seen in studies which (i) utilised 24-h urines to assess Na intake (BMI mean difference: 2·30 kg/m2; 95 % CI 1·86, 2·75; P < 0·001), comparatively smaller effects were seen in studies which used dietary methods and spot or overnight urines (online Supplementary Fig. S3) and (ii) among those deemed as either high (BMI mean difference: 2·00 kg/m2; 95 % CI 1·26, 2·74; P < 0·001) or moderate quality (BMI mean difference: 2·11 kg/m2; 95 % CI 1·61, 2·61; P < 0·001) compared with low-quality studies (BMI mean difference: 1·36 kg/m2; 95 % CI 1·19, 1·54; P < 0·001) (online Supplementary Fig. S4). Sub-group analysis among studies (n 6) with sex-specific estimates showed the effect size remained similar in females (BMI mean difference: 1·56 kg/m2; 95 % CI 1·30, 1·81; P < 0·001) and males (BMI mean difference: 1·51 kg/m2; 95 % CI 0·90, 2·11; P < 0·001) (online Supplementary Fig. S5). Evidence of heterogeneity was reduced in females (Cochran’s Q statistic P = 0·108; I 2 42 %; 95 % CI 0, 76 %), yet remained considerable in males (Cochran’s Q statistic P < 0·001; I 2 92 %; 95 % CI 85, 95 %). Only two studies included in the meta-analysis adjusted for a number of important covariates; specifically, Ma et al. (Reference Ma, He and Macgregor9) adjusted for age, sex, ethnic group, household income, physical activity, alcohol intake, smoking, education level and energy intake. Nam et al. (Reference Nam, Kim and Choi73) adjusted for age, smoking status, physical activity, household income, education level and energy intake. Neither of these studies reported models in which energy intake was separated out from the base model that included other covariates. To assess if these studies differed, a sensitivity analysis was performed, in which the three effect sizes from these two studies were pooled (Nam et al. reported effect estimates by sex). Findings from this analysis (three effect sizes; 1425 participants) did not substantially differ from the primary analysis presented above (e.g. BMI mean difference between highest ntile of Na intake v. lowest ntile of Na intake: 2·0 kg/m2; 95 % CI 1·26, 2·74; P < 0·001) (online Supplementary Fig. S6).
Table 2. Summary of effect estimates for the association between Na intake and adiposity outcomes from pooled meta-analyses conducted in adults and children
MD, mean difference; SSB, sugar-sweetened beverages; BW, body weight; WC, waist circumference; RCT, randomised controlled trial; NA, not applicable.
* For observational studies comparing lowest and highest ntile, difference represents the average difference in Na intake between lowest and highest ntiles across studies; due to variation in reporting for some studies, this related to the difference between the average Na intake between the lowest and highest ntile and for other studies this related to the difference between the cut-off bounds of the lowest and highest ntiles. For RCT, difference represents the average net change in Na intake across studies.
A separate meta-analysis was performed to combine findings from the nine studies(Reference Yi, Firestone and Beasley10,Reference Yi and Kansagra11,Reference Elfassy, Mossavar-Rahmani and Van Horn59,Reference Lee, Cho and Bae69,Reference Ohta, Kimura and Kitaoka76,Reference Webster, Su’a and Ieremia98,Reference Zhang, Wang and Li102–Reference Zhou, Stamler and Chan104) which reported results as linear regression analysis. Findings from this meta-analysis (twelve effect sizes; 22 221 participants) showed that an additional 393 mg/d of Na (1 g/d of salt) was associated with a 0·32 kg/m2 higher BMI (95 % CI 0·20, 0·43; P < 0·001) with substantial heterogeneity (I 2 of 93 % (95 % CI 90, 96 %)) (online Supplementary Fig. S7). Due to the smaller number of studies, no sub-group analyses to assess potential sources of heterogeneity were performed, nor was publication bias assessed. All studies adjusted for a range of covariates (online Supplementary Table S5). Five studies adjusted for energy intake(Reference Yi, Firestone and Beasley10,Reference Elfassy, Mossavar-Rahmani and Van Horn59,Reference Zhang, Wang and Li102–Reference Zhou, Stamler and Chan104) and one study for SSB consumption(Reference Yi and Kansagra11). To assess if the additional adjustment of energy intake altered results, we were able to report on those four studies(Reference Yi, Firestone and Beasley10,Reference Elfassy, Mossavar-Rahmani and Van Horn59,Reference Zhao, Cogswell and Yang103,Reference Zhou, Stamler and Chan104) that reported separate models with and without energy intake adjustment within two separate meta-analyses (online Supplementary Fig. S8). Findings from these analyses indicated that the additional adjustment of energy intake did not alter results (e.g. model without energy intake BMI difference associated with 1 g/d of salt 0·40 kg/m2; 95 % CI 0·25, 0·56; P < 0·001 v. model with energy intake BMI difference associated with 1 g/d of salt 0·42 kg/m2; 95 % CI 0·26, 0·59; P < 0·001). Of note, with regard to SSB intake(Reference Yi and Kansagra11) authors reported that the additional adjustment of this variable did not alter the reported positive associations between Na intake and BMI (online Supplementary Table S5). Publication bias was not assessed due to the low (≤10) number of studies.
Systematic review findings: BMI
Detailed findings from the remaining twenty studies that could not be included in meta-analyses are displayed in online Supplementary Table S5. Across the thirteen studies(Reference Staessen, Broughton and Fletcher35,Reference Buranakitjaroen and Phoojaroenchanachai54,Reference Cheung, Ho and Cheung56,Reference Ferdaus, Kohno and Hamano61,Reference Jiet and Soma68,Reference Pan, Tseng and You77,Reference Perin, Cornelio and Oliveira78,Reference Polonia, Maldonado and Ramos81,Reference Polonia, Martins and Pinto82,Reference Rashidah, Yeo and Noor Ani84,Reference Ribi, Zakotnik and Vertnik86,Reference Shim, Ryu and Hwang90,Reference Strazzullo, Trevisan and Farinaro92) which reported results as a correlation coefficient, all but one(Reference Cheung, Ho and Cheung56) reported weak-to-moderate positive correlations between Na intake and BMI (range r 0·11–0·45) (online Supplementary Table S5). Across the six studies(Reference Afşar and Kirkpantur52,Reference Choi and Heo57,Reference Crouch, Ware and Gafane-Matemane58,Reference Navia, Aparicio and Perea74,Reference Shay, Van Horn and Stamler89,Reference Venezia, Barba and Russo94) which reported results as linear regression analysis, all but two of these studies(Reference Choi and Heo57,Reference Crouch, Ware and Gafane-Matemane58) reported positive associations between Na intake and BMI (online Supplementary Table S5). The final study which reported mean BMI across ntile of Na density (i.e. adjusted for energy intake)(Reference Murakami, Livingstone and Sasaki72) also found a positive association with BMI.
Primary adiposity outcome: risk of overweight/obesity (weight category)
Thirteen studies reported on the association between Na intake and risk of overweight and/or obesity(Reference Ma, He and Macgregor9,Reference Yi and Kansagra11,Reference Yoon and Oh12,Reference Aballay, Osella and De La Quintana51,Reference Han, Hu and Tang63,Reference Murakami, Livingstone and Sasaki72–Reference Navia, Aparicio and Perea74,Reference Song, Cho and Lee91,Reference Watanabe, Konta and Ichikawa97,Reference Zhang, Wang and Li102–Reference Zhou, Stamler and Chan104) (online Supplementary Tables S3 and S5); eight of these were included in meta-analyses.
Meta-analyses findings: risk of overweight/obesity
In pooled analysis of the five studies (eight effect sizes, 11 067 participants) which reported OR across ntiles of Na intake(Reference Han, Hu and Tang63,Reference Nam, Kim and Choi73,Reference Song, Cho and Lee91,Reference Watanabe, Konta and Ichikawa97,Reference Zhao, Cogswell and Yang103) higher Na intake was associated with greater risk of overweight/obesity (OR 1·74; 95 % CI 1·43, 2·13; P < 0·001; I 2 54 %; 95 % CI 26, 84) (online Supplementary Fig. S9, Table 2). The difference in Na intake between ntile cut-points varied across studies (online Supplementary Table S5, e.g. ranged from 69 mmol/d (salt 4·0 g/d) to 295 mmol/d (salt 17·3 g)); the average difference between the highest and lowest ntile was 162 mmol/d of Na (salt 9·5 g/d). Sub-group analysis in studies (n 3) with sex-specific estimates showed that among males higher Na intake was associated with greater odds of overweight/obesity (OR 1·74; 95 % CI 1·38, 2·18; P < 0·001, Cochrane’s Q statistic P < 0·001; I 2 37 %; 95 % CI 0, 80 %); however, there was no effect among females (OR 1·37; 95 % CI 0·94, 1·99; P = 0·103, Cochrane’s Q statistic P = 0·011; I 2 73 %; 95 % CI 25, 90 %) (online Supplementary Fig. S10). Three(Reference Nam, Kim and Choi73,Reference Song, Cho and Lee91,Reference Zhao, Cogswell and Yang103) of the five studies adjusted for a range of covariates, including energy intake, whereas two studies(Reference Han, Hu and Tang63,Reference Watanabe, Konta and Ichikawa97) presented unadjusted findings. Sensitivity analysis to explore the effects of adjustment with energy intake was completed in the two studies (three effect sizes)(Reference Song, Cho and Lee91,Reference Zhao, Cogswell and Yang103) that reported separate models with and without energy intake adjustment. In this separate analysis, it was apparent that the additional adjustment of energy intake did not substantially alter results (e.g. model without energy intake: three effect sizes, 6685 participants; OR 1·50; 95 % CI 1·09, 2·05; P = 0·013 v. model with adjustment for energy intake: three effect sizes, 6685 participants; OR 1·67; 95 % CI 1·33, 2·10; P < 0·001) (online Supplementary Fig. S11).
A separate meta-analysis of three studies(Reference Ma, He and Macgregor9,Reference Yi and Kansagra11,Reference Zhou, Stamler and Chan104) which reported results as linear regression analysis was performed. Findings from this meta-analysis (seven effect sizes; 7121 participants) showed that an additional 393 mg/d of Na (1 g/d of salt) was associated with a 1·18 greater odds of being overweight/obese compared with a healthy weight (OR 1·18; 95 % CI 1·10, 1·30; P < 0·001; I 2 91 %; 95 % CI 84, 95) (online Supplementary Fig. S12).
Systematic review findings: risk of overweight/obesity
Detailed findings from the remaining five studies that could not be included in meta-analyses are displayed in online Supplementary Table S5 (Reference Yoon and Oh12,Reference Aballay, Osella and De La Quintana51,Reference Murakami, Livingstone and Sasaki72,Reference Navia, Aparicio and Perea74,Reference Zhang, Wang and Li102) . All five studies reported a significant positive association between Na intake and risk of overweight/obesity; however, in one study(Reference Navia, Aparicio and Perea74) the reported effect size was negligible.
Secondary adiposity outcome: body weight
Twenty studies reported on the relationship between Na intake and BW (online Supplementary Tables S3 and S6)(Reference Yi, Firestone and Beasley10,Reference Yi and Kansagra11,Reference Baudrand, Campino and Carvajal53,Reference Campino, Hill and Baudrand55–Reference Crouch, Ware and Gafane-Matemane58,Reference Eufinger, Votaw and Faber60,Reference Hashimoto, Takase and Okado64,Reference Hoffmann and Cubeddu65,Reference Hulthén, Aurell and Klingberg67,Reference Jiet and Soma68,Reference Madhavan and Alderman71,Reference Nam, Kim and Choi73,Reference Sanchez-Castillo, Warrender and Whitehead87,Reference Strazzullo, Trevisan and Farinaro92,Reference Vega-Vega, Fonseca-Correa and Mendoza-De la Garza93,Reference Villani, Clifton and Keogh96,Reference Yokokawa, Yuasa and Nedsuwan101,Reference Zhang, Wang and Li102) ; seven of these were included in meta-analysis.
Meta-analysis findings: body weight
Pooled findings from the seven studies(Reference Eufinger, Votaw and Faber60,Reference Hoffmann and Cubeddu65,Reference Hulthén, Aurell and Klingberg67,Reference Madhavan and Alderman71,Reference Nam, Kim and Choi73,Reference Vega-Vega, Fonseca-Correa and Mendoza-De la Garza93,Reference Yokokawa, Yuasa and Nedsuwan101) which reported BW across ntiles of Na (twelve effect sizes, 4097 participants) BW were 8·23 kg (95 % CI 6·35, 10·12, P < 0·001) higher among adults in the highest category of Na consumption (online Supplementary Fig. S13). Substantial heterogeneity (Cochran’s Q statistic P < 0·001; I 2 68%, 95% CI 41, 82%) was detected. Na intake at ntile cut-points varied across studies (online Supplementary Table S6); the average difference between the highest and lowest ntile cut-points was 105 mmol/d of Na (salt 6·1 g/d). Importantly only one(Reference Nam, Kim and Choi73) of the seven studies adjusted for a comprehensive range of covariates, which included energy intake; of note, the present study did not report adjusted models with and without energy intake.
Systematic review findings: body weight
Seven studies reported results as a correlation coefficient(Reference Baudrand, Campino and Carvajal53,Reference Campino, Hill and Baudrand55,Reference Cheung, Ho and Cheung56,Reference Jiet and Soma68,Reference Sanchez-Castillo, Warrender and Whitehead87,Reference Strazzullo, Trevisan and Farinaro92,Reference Villani, Clifton and Keogh96) , with all but one(Reference Cheung, Ho and Cheung56) showing significant positive correlations between Na intake and BW (range r 0·29, 0·47) (online Supplementary Table S6). Six reported findings as linear regression analysis(Reference Yi, Firestone and Beasley10,Reference Yi and Kansagra11,Reference Choi and Heo57,Reference Crouch, Ware and Gafane-Matemane58,Reference Hashimoto, Takase and Okado64,Reference Zhang, Wang and Li102) and all adjusted for a comprehensive range of covariates, four of which also included energy intake(Reference Yi, Firestone and Beasley10,Reference Choi and Heo57,Reference Crouch, Ware and Gafane-Matemane58,Reference Zhang, Wang and Li102) . Overall, four (two adjusted for energy, one adjusted for SSB)(Reference Yi, Firestone and Beasley10,Reference Yi and Kansagra11,Reference Hashimoto, Takase and Okado64,Reference Zhang, Wang and Li102) out of six studies reported positive associations between Na intake and BW, whereas one (adjusted for energy intake) reported no association(Reference Choi and Heo57) and one (adjusted for energy intake) indicated a trend towards statistical significance (P = 0·06)(Reference Crouch, Ware and Gafane-Matemane58) (online Supplementary Table S6).
Secondary outcome: waist circumference and/or abdominal obesity
Twenty studies reported on the relationship between Na intake and central adiposity(Reference Ma, He and Macgregor9–Reference Yoon and Oh12,Reference Choi and Heo57,Reference Crouch, Ware and Gafane-Matemane58,Reference Ge, Guo and Chen62,Reference Hoffmann and Cubeddu65,Reference Huh, Lim and Lee66,Reference Lee, Kim and Kim70,Reference Murakami, Livingstone and Sasaki72–Reference Oh, Han and Han75,Reference Perin, Cornelio and Oliveira78,Reference Petermann-Rocha, Sillars and Brown80,Reference Radhika, Sathya and Sudha83,Reference Yan, Guo and Wang100,Reference Zhang, Wang and Li102,Reference Zhao, Cogswell and Yang103) , of which eleven were included in meta-analyses(Reference Ma, He and Macgregor9,Reference Ge, Guo and Chen62,Reference Hoffmann and Cubeddu65,Reference Huh, Lim and Lee66,Reference Lee, Kim and Kim70,Reference Nam, Kim and Choi73,Reference Oh, Han and Han75,Reference Petermann-Rocha, Sillars and Brown80,Reference Radhika, Sathya and Sudha83,Reference Yan, Guo and Wang100,Reference Zhang, Wang and Li102,Reference Zhao, Cogswell and Yang103) (online Supplementary Tables S3 and S7).
Meta-analysis findings: waist circumference and/or abdominal obesity
In a pooled analysis of nine studies (twelve effect sizes, 35 753 participants)(Reference Ma, He and Macgregor9,Reference Hoffmann and Cubeddu65,Reference Huh, Lim and Lee66,Reference Lee, Kim and Kim70,Reference Nam, Kim and Choi73,Reference Oh, Han and Han75,Reference Petermann-Rocha, Sillars and Brown80,Reference Radhika, Sathya and Sudha83,Reference Yan, Guo and Wang100) , higher intakes of Na were associated with higher WC (mean difference between lowest and highest ntile of Na intake 5·16 cm; 95 % CI 4·23, 6·09; P < 0·001) (online Supplementary Fig. S14). Na intake at ntile cut-points varied across studies (online Supplementary Table S7); the average difference between the highest and lowest ntile cut-points was 119 mmol/d of Na (salt 6·9 g/d). Evidence of considerable heterogeneity was detected (Cochran’s Q statistic P < 0·001; I 2 86 %; 95 % CI 78, 91 %). Most studies presented findings as unadjusted(Reference Lee, Kim and Kim70,Reference Oh, Han and Han75,Reference Petermann-Rocha, Sillars and Brown80,Reference Radhika, Sathya and Sudha83,Reference Yan, Guo and Wang100) or sex stratified(Reference Hoffmann and Cubeddu65,Reference Huh, Lim and Lee66) ; only two adjusted for a range of covariates (i.e. age, sex, physical activity, income, education level, smoking and alcohol and energy intake)(Reference Ma, He and Macgregor9,Reference Nam, Kim and Choi73) . Neither of these studies reported separate effects with and without energy adjustment. We performed a sensitivity analysis which combined these two studies (three effect sizes, 1425 participants) with energy adjustment and found no substantial difference in findings from the primary analysis reported above (e.g. WC mean difference between highest ntile of Na intake v. lowest ntile of Na intake: 6·12 cm; 95 % CI 4·40, 7·83; P < 0·001) (online Supplementary Fig. S15).
In a separate meta-analysis of five studies(Reference Ge, Guo and Chen62,Reference Huh, Lim and Lee66,Reference Nam, Kim and Choi73,Reference Zhang, Wang and Li102,Reference Zhao, Cogswell and Yang103) which reported odds of abdominal obesity associated with higher Na intakes (seven effect sizes, 19 744 participants), the odds of abdominal obesity were 2·04 times greater among those adults in the highest ntile for salt intake, compared with those in the lowest ntile (OR 2·04; 95 % CI 1·72, 2·42; P value < 0·001) (online Supplementary Fig. S16). The average difference between the highest and lowest ntile cut-points was 85 mmol/d of Na (salt 5·0 g/d). A moderate degree of heterogeneity was detected (Cochran’s Q statistic P = 0·010; I 2 64 %; 95 % CI 19, 84). All of these studies adjusted for a comprehensive number of covariates (online Supplementary Table S7), and all but one(Reference Ge, Guo and Chen62) also included energy intake. There were too few studies that separated out the effects of energy intake from adjusted models to conduct a separate sensitivity analysis. Publication bias was not assessed due to the low (≤10) number of studies.
Systematic review findings: waist circumference and/or abdominal obesity
Findings from the eight studies which were not included in meta-analyses varied (online Supplementary Table S7). One study reported a weak positive correlation between Na intake and WC (unadjusted)(Reference Perin, Cornelio and Oliveira78), three studies adjusted for a range of covariates and reported positive associations between Na intake and WC(Reference Yi, Firestone and Beasley10,Reference Yi and Kansagra11,Reference Navia, Aparicio and Perea74) and one study reported a positive association between Na density and abdominal obesity(Reference Yoon and Oh12). Two studies, both of which adjusted for a range of covariates(Reference Choi and Heo57,Reference Crouch, Ware and Gafane-Matemane58) , reported null findings and the final study reported mixed findings, with no relationship between Na density and WC, yet a positive association between Na density and abdominal obesity(Reference Murakami, Livingstone and Sasaki72).
Secondary outcome: body composition
Eight studies reported on the relationship between Na intake and a measure of body composition(Reference Ma, He and Macgregor9,Reference Yi, Firestone and Beasley10,Reference Choi and Heo57–Reference Elfassy, Mossavar-Rahmani and Van Horn59,Reference Huh, Lim and Lee66,Reference Jiet and Soma68,Reference Zhang, Wang and Li102) (online Supplementary Table S8); none of which could be combined in meta-analysis.
Systematic review findings: body composition
Outcomes assessed across studies varied (online Supplementary Table S8). Five out of eight studies that examined the relationship between Na intake and either body fat mass or percentage body fat reported positive associations(Reference Ma, He and Macgregor9,Reference Yi, Firestone and Beasley10,Reference Elfassy, Mossavar-Rahmani and Van Horn59,Reference Huh, Lim and Lee66,Reference Zhang, Wang and Li102) (4/5 adjusted for a range of covariates including energy intake); however, there was some variation in the effect observed across males and females. On the contrary, three studies reported null findings(Reference Choi and Heo57,Reference Crouch, Ware and Gafane-Matemane58,Reference Jiet and Soma68) (2/3 adjusted for a range of covariates including energy intake).
Adults: longitudinal studies (adiposity outcomes)
Four longitudinal studies reported on the relationship between Na intake and a measure of adiposity with a follow-up period ranging from 1 to 14 years(Reference Larsen, Ängquist and Sørensen8,Reference Ard, Coffman and Lin105–Reference Takahashi, Sasaki and Okubo107) (online Supplementary Table S9). It was not possible to pool any of these studies for a meta-analysis.
Systematic review findings: adiposity outcomes
Two studies were follow-up extensions of participants in previous RCT. Ard et al. (Reference Ard, Coffman and Lin105) reported on fifty-six participants who had previously completed the Dietary Approaches to Stop Hypertension Sodium Trial. In analyses, stratified by the original intervention arm, there was no significant change in mean BW within the Dietary Approaches to Stop Hypertension-Na diet group (1·7 kg; 95 % CI −0·01, 3·6) and an increase in BW within the control diet group (1·93 kg; 95 % CI 0·72, 3·14). However, neither group showed a change in Na intake during the follow-up period (online Supplementary Table S9). Similarly, Takahashi et al. (Reference Takahashi, Sasaki and Okubo107) reported no change in Na density (mg/4184 kJ or mg/1000 kcal) of the diet of Japanese adults or BW over a 3–4-year period following completion of a previous Na reduction trial (online Supplementary Table S9). Sakaki et al. (Reference Sakaki, Tsuchihashi and Arakawa106) reported on the change in Na intake and BW among a group of outpatients with hypertension recruited from a medical centre in Japan. In this analysis with mean follow-up period of 9·4 years within the whole group, there was a significant reduction in Na intake (−393 mg/d, P < 0·01) but no change in BW. Similar findings were reported when participants were stratified by compliance to salt restriction (online Supplementary Table S9). All of the above three studies were deemed as moderate quality according to the NOS (online Supplementary Table S10); this was primarily due to lack of confounder adjustment. The final study by Larsen et al. (Reference Larsen, Ängquist and Sørensen8) was the only longitudinal study retrieved that specifically aimed to explore the relationship between Na intake and a range of adiposity measures over time. The present study was deemed high quality (online Supplementary Table S10) with the use of 24-h urine for Na intake assessment and adjustment with a comprehensive list of confounders which included energy intake. During the 6-year follow-up period of Danish adults, a difference of 100 mmol/d of Na at baseline was not associated with a change in BW, WC, body fat or fat free mass. However, in additional models which also adjusted for the change in BW during the follow-up period, Na intake (100 mmol/d) was found to predict change in body fat (0·24 kg; 95 % CI 0·05, 0·43; P = 0·015), suggesting that independent of BW, a higher Na intake may lead to changes in body composition which favour fat accumulation (online Supplementary Table S9).
Adults: randomised controlled trials (body weight outcome)
Fifteen RCT included information on change in BW between groups on either a ‘usual/control’ diet v. a ‘reduced-Na diet’(Reference Appel, Espeland and Easter29–Reference Petersen, Torpy and Chapman34,Reference Beard, Cooke and Gray36–Reference Nouvenne, Meschi and Prati40,108–111) ; all of these studies were included in meta-analysis (online Supplementary Table S11). Four studies were conducted in the USA(Reference Appel, Espeland and Easter29,Reference Kumanyika, Hebert and Cutler32,108,111) , three in the UK(Reference Bulpitt, Daymond and Bulpitt30,Reference Dodson, Beevers and Hallworth37,Reference Gilleran, O’Leary and Bartlett38) , three in Europe(Reference Geleijnse, Witteman and Bak31,Reference Nouvenne, Meschi and Prati40,Reference Staessen, Bulpitt and Fagard109) , three in Australia(Reference Nowson, Wattanapenpaiboon and Pachett33,Reference Petersen, Torpy and Chapman34,Reference Beard, Cooke and Gray36) , one in Japan(Reference Takahashi, Sasaki and Okubo110) and one in China(Reference He, Wu and Feng39). Duration of trials ranged from 12 weeks to 4 years and study populations varied. Most studies (10/15) used comprehensive dietary counselling and behavioural-based strategies to target reductions in Na intake(Reference Appel, Espeland and Easter29,Reference Kumanyika, Hebert and Cutler32,Reference Nowson, Wattanapenpaiboon and Pachett33,Reference Beard, Cooke and Gray36,Reference Dodson, Beevers and Hallworth37,Reference He, Wu and Feng39,Reference Nouvenne, Meschi and Prati40,108,Reference Takahashi, Sasaki and Okubo110,111) . Three studies provided participants with a K salt substitute for use during cooking and at the table(Reference Bulpitt, Daymond and Bulpitt30,Reference Geleijnse, Witteman and Bak31,Reference Gilleran, O’Leary and Bartlett38) ; one of these(Reference Geleijnse, Witteman and Bak31) also provided additional food items (bread, cheese, etc.) that were prepared with the mineral salt. None of the studies used change in BW as a specified study outcome, rather for most studies (11/15) the primary outcome related to blood pressure(Reference Appel, Espeland and Easter29–Reference Nowson, Wattanapenpaiboon and Pachett33,Reference Beard, Cooke and Gray36–Reference Gilleran, O’Leary and Bartlett38,108,Reference Takahashi, Sasaki and Okubo110,Reference Cutler, Whelton and Appel112) . The net change in Na intake between groups varied across studies (average reduction 39 mmol/d (salt 2·3 g/d)) and ranged from a reduction of −140 mmol/d (salt 8·2 g/d) to −16 mmol/d (salt 0·9 g/d)(Reference Appel, Espeland and Easter29–Reference Nowson, Wattanapenpaiboon and Pachett33,Reference Beard, Cooke and Gray36,Reference Dodson, Beevers and Hallworth37,Reference He, Wu and Feng39,Reference Nouvenne, Meschi and Prati40,108,Reference Takahashi, Sasaki and Okubo110,111) , and in three studies a positive net change was reported (i.e. 1–30 mmol/d) (salt 0–1·8 g/d)(Reference Petersen, Torpy and Chapman34,Reference Gilleran, O’Leary and Bartlett38,Reference Staessen, Bulpitt and Fagard109) .
Quality assessment
Overall, risk of bias was low for incomplete outcome data and blinding of outcome assessment but was high for blinding of participants. Risk of bias was unclear or low for random sequence generation and allocation concealment (online Supplementary Fig. S17). Individual study risk of bias assessments is shown in online Supplementary Table S12.
Meta-analysis findings: body weight
Findings from the pooled analysis of fifteen studies (sixteen effect sizes, 5274 participants) suggested a non-significant trend for lower BW on reduced-Na v. control diets (−0·29 kg; 95 % CI −0·59, 0·01; P = 0·06) (online Supplementary Fig. S18). The average net difference in Na intake between groups was −39 mmol/d (salt 2·3 g/d). There was evidence of moderate statistical heterogeneity (Cochran’s Q statistic P = 0·017; I 2 48 %; 95 % CI 7, 71 %). Visual inspection of the funnel plot (online Supplementary Fig. S19) and Egger’s regression asymmetry test (P = 0·30) suggested no publication bias. In a sensitivity analysis, we explored the removal of Staessen et al. (Reference Staessen, Bulpitt and Fagard109) which included different groups of population-based samples at baseline and endpoint measures(Reference Staessen, Bulpitt and Fagard109), and found no change to results (0·29 kg (95 % CI −0·59, 0·01) P = 0·06; Cochran’s Q statistic P = 0·014; I 2 51 %; 95 % CI 10, 74 %).
Children: cross-sectional studies (adiposity outcomes)
Eighteen cross-sectional studies reported on the relationship between Na intake and a measure of adiposity(Reference Grimes, Riddell and Campbell5,Reference Zhu, Pollock and Kotak7,Reference Ma, He and Macgregor9,Reference Yoon and Oh12,Reference Campino, Hill and Baudrand55,Reference Campanozzi, Avallone and Barbato113–Reference Yamauchi, Furuta and Hamada125) ; three of which were included in meta-analyses (online Supplementary Table S13). One of these studies was from Canada(Reference Woodruff, Fryer and Campbell124), one from Iran(Reference Rafie, Mohammadifard and Khosravi123) and the other from South Korea(Reference Lee, Kim and Kim118). Two of these studies assessed Na intake using 24-h dietary recalls(Reference Lee, Kim and Kim118,Reference Woodruff, Fryer and Campbell124) and one study used 24-h urine collection(Reference Rafie, Mohammadifard and Khosravi123). Reasons for exclusion from meta-analysis included: findings were only presented as correlation coefficients (n 8)(Reference Campino, Hill and Baudrand55,Reference Campanozzi, Avallone and Barbato113–Reference Ellison, Sosenko and Harper115,Reference Lakatos, Gyorke and Sultan117,Reference Lurbe, Alvarez and Liao120,Reference Maldonado-Martin, Garcia-Matarin and Gil-Extremera121,Reference Yamauchi, Furuta and Hamada125) or due to discrepancy in how study findings were presented, there were too few studies (i.e. ≤3) for a pooled analysis (n 7)(Reference Grimes, Riddell and Campbell5,Reference Zhu, Pollock and Kotak7,Reference Ma, He and Macgregor9,Reference Yoon and Oh12,Reference Gilardini, Croci and Pasqualinotto116,Reference Lee and Kim119,Reference Okuda, Asakura and Sasaki122) . Of the fifteen studies included in the systematic review, six studies were from Europe(Reference Campanozzi, Avallone and Barbato113,Reference De Santo, Dilorio and Capasso114,Reference Gilardini, Croci and Pasqualinotto116,Reference Lakatos, Gyorke and Sultan117,Reference Lurbe, Alvarez and Liao120,Reference Maldonado-Martin, Garcia-Matarin and Gil-Extremera121) , four from Asia(Reference Yoon and Oh12,Reference Lee and Kim119,Reference Okuda, Asakura and Sasaki122,Reference Yamauchi, Furuta and Hamada125) , two from the USA(Reference Zhu, Pollock and Kotak7,Reference Ellison, Sosenko and Harper115) , one from South America(Reference Campino, Hill and Baudrand55), one from the UK(Reference Ma, He and Macgregor9) and one from Australia(Reference Grimes, Riddell and Campbell5). Most studies (9/15) assessed Na intake using 24-h urine collection(Reference Grimes, Riddell and Campbell5,Reference Ma, He and Macgregor9,Reference Campino, Hill and Baudrand55,Reference Campanozzi, Avallone and Barbato113,Reference De Santo, Dilorio and Capasso114,Reference Lakatos, Gyorke and Sultan117,Reference Lurbe, Alvarez and Liao120–Reference Okuda, Asakura and Sasaki122) ; other methods included overnight urines (n 2)(Reference Ellison, Sosenko and Harper115,Reference Yamauchi, Furuta and Hamada125) and dietary recall methods (n 4)(Reference Zhu, Pollock and Kotak7,Reference Yoon and Oh12,Reference Gilardini, Croci and Pasqualinotto116,Reference Lee and Kim119) .
Quality assessment
Based on the NOS, studies were deemed as either low (n 2, 1 %)(Reference Ellison, Sosenko and Harper115,Reference Yamauchi, Furuta and Hamada125) , moderate (n 8, 44 %)(Reference Campino, Hill and Baudrand55,Reference De Santo, Dilorio and Capasso114,Reference Gilardini, Croci and Pasqualinotto116,Reference Lakatos, Gyorke and Sultan117,Reference Lurbe, Alvarez and Liao120–Reference Okuda, Asakura and Sasaki122,Reference Woodruff, Fryer and Campbell124) or high (n 8, 44 %) quality studies(Reference Grimes, Riddell and Campbell5,Reference Zhu, Pollock and Kotak7,Reference Ma, He and Macgregor9,Reference Yoon and Oh12,Reference Lee, Kim and Kim70,Reference Campanozzi, Avallone and Barbato113,Reference Lee and Kim119,Reference Rafie, Mohammadifard and Khosravi123) (online Supplementary Table S14).
Primary adiposity outcome: BMI z-score or BMI
Seven studies reported on the association between Na intake and either BMI or BMI z-score(Reference Grimes, Riddell and Campbell5,Reference Zhu, Pollock and Kotak7,Reference Ma, He and Macgregor9,Reference Campanozzi, Avallone and Barbato113,Reference De Santo, Dilorio and Capasso114,Reference Lakatos, Gyorke and Sultan117,Reference Yamauchi, Furuta and Hamada125) ; due to discrepancies in methods used to report data, none of these could be pooled (online Supplementary Table S15).
Systematic review findings: BMI z-score or BMI
Four studies reported on the correlation between Na intake and BMI/BMI z-score; two reported a moderate significant positive correlation(Reference De Santo, Dilorio and Capasso114,Reference Lakatos, Gyorke and Sultan117) , one a very weak significant correlation and one a null relationship(Reference Yamauchi, Furuta and Hamada125). The remaining three studies adjusted for a number of covariates and all reported positive associations between Na intake and BMI/BMI z-score(Reference Grimes, Riddell and Campbell5,Reference Zhu, Pollock and Kotak7,Reference Ma, He and Macgregor9) . Specifically among Australian primary schoolchildren aged 4–12 years, it was reported that each additional 1 g/d of salt (393 mg/d Na) (24-h urinary Na) was associated with a difference in BMI z-score of 0·10 (95 % CI 0·07, 0·13) (adjusted for sex, age and socio-economic status). In the present study, there was no appreciable change to result with the additional adjustment of either energy intake (kJ/d) (β = 0·08; 95 % CI 0·05, 0·11; P < 0·001) or SSB intake (g/d) (β = 0·08; 95 % CI 0·05, 0·11; P < 0·001), as measured by 24-h dietary recall in a sub-sample of children aged 8–12 years. Among US adolescents, 24-h dietary recall Na intake was positively associated with BMI (standardised β = 0·23, P = 0·001) (adjusted for age, sex, race, Tanner stage, birth weight, physical activity, energy, K and SSB intake)(Reference Zhu, Pollock and Kotak7) and in British children and adolescents, BMI significantly increased across tertile categories of 24-h urinary Na excretion (e.g. T1 mean BMI 18·5 (sd 0·5) kg/m2 v. T3 mean BMI 20·2 (sd 0·5) kg/m2, P for trend<0·001, adjusted for age, sex, ethnic group, household income, physical activity and energy intake)(Reference Ma, He and Macgregor9) (online Supplementary Table S15).
Primary adiposity outcome: risk of overweight/obesity
Seven studies reported on the association between salt intake and risk of overweight/obesity using OR(Reference Grimes, Riddell and Campbell5,Reference Ma, He and Macgregor9,Reference Yoon and Oh12,Reference Lee, Kim and Kim118,Reference Lee and Kim119,Reference Rafie, Mohammadifard and Khosravi123,Reference Woodruff, Fryer and Campbell124) ; three of which were combined in a meta-analysis.
Meta-analysis findings: risk of overweight/obesity
In this meta-analysis (three effect sizes, 3625 participants) (online Supplementary Fig. S20), the odds of being overweight/obese were 3·3 times greater among those children in the highest ntile for Na intake, compared with those in the lowest ntile (OR 3·29; 95 % CI 2·25, 4·80; P < 0·001). There was no evidence of heterogeneity (Cochran’s Q statistic P = 0·463; I 2 0 %; 95 % CI 0, 90 %). Due to the limited number of studies, publication bias was not assessed. All studies adjusted for a range of confounders; two of which also included energy intake(Reference Lee, Kim and Kim118,Reference Rafie, Mohammadifard and Khosravi123) . Rafie et al.’s(Reference Rafie, Mohammadifard and Khosravi123) study was the only study to report the additional adjustment of energy intake and SSB intake separated from the adjusted base model. In this individual study, there were no substantive changes to results with the inclusion of these additional covariates (online Supplementary Table S15).
Systematic review findings: risk of overweight/obesity
All four studies reported greater risk of overweight/obesity with higher Na intake (online Supplementary Table S15). Grimes et al. (Reference Grimes, Riddell and Campbell5) and Ma et al. (Reference Ma, He and Macgregor9) both reported the odds of overweight/obesity associated with an additional 1 g/d of urinary salt. Findings across these studies were similar with the odds of being overweight/obese v. a healthy weight about 1·5 times greater for each additional 1 g of salt consumed per d. Of note, the greater risk of overweight/obesity remained in models adjusted for energy or SSB intake. The other two studies(Reference Yoon and Oh12,Reference Lee and Kim119) utilised dietary Na density as the exposure variable; Lee & Kim(Reference Lee and Kim119) reported 2·72 greater odds (95 % CI 1·65, 4·51) of being obese for those participants in the highest tertile of Na density (mg/1000 kcal) compared with those in the lowest tertile. Yoon & Oh(Reference Yoon and Oh12) reported 1·58 greater odds (95 % CI 1·01, 2·45) of being overweight/obese for those in the highest quintile of Na density (mg/g food) compared with those in the lowest quintile (online Supplementary Table S15).
Secondary adiposity outcome: body weight
Seven studies examined the relationship between Na intake and BW; none of these was combined in pooled analysis(Reference Campino, Hill and Baudrand55,Reference De Santo, Dilorio and Capasso114,Reference Ellison, Sosenko and Harper115,Reference Lurbe, Alvarez and Liao120–Reference Okuda, Asakura and Sasaki122,Reference Yamauchi, Furuta and Hamada125) .
Systematic review findings: body weight
Six studies reported a significant positive correlation between Na intake and BW (r 0·18–0·63)(Reference Campino, Hill and Baudrand55,Reference De Santo, Dilorio and Capasso114,Reference Ellison, Sosenko and Harper115,Reference Lurbe, Alvarez and Liao120,Reference Maldonado-Martin, Garcia-Matarin and Gil-Extremera121,Reference Yamauchi, Furuta and Hamada125) , and one study showed no difference in mean BW across tertile of Na intake(Reference Okuda, Asakura and Sasaki122) (online Supplementary Table S16).
Secondary adiposity outcome: waist circumference and/or abdominal obesity
Seven studies assessed the association between Na intake and a marker of abdominal adiposity(Reference Grimes, Riddell and Campbell5,Reference Zhu, Pollock and Kotak7,Reference Ma, He and Macgregor9,Reference Yoon and Oh12,Reference Gilardini, Croci and Pasqualinotto116,Reference Lee and Kim119,Reference Rafie, Mohammadifard and Khosravi123) (online Supplementary Table S17). No meta-analysis was performed due to the discrepancy in analyses and outcomes used.
Systematic review findings: waist circumference and/or abdominal obesity
All seven studies reported significant positive associations between Na intake and markers of abdominal adiposity. Zhu et al. (Reference Zhu, Pollock and Kotak7) reported a positive association between 24-h dietary recall Na and WC among US adolescents after adjustment for a range of covariates including energy and SSB intake (standardised β = 0·23; P < 0·01). Among UK children, Ma et al. (Reference Ma, He and Macgregor9) found WC was significantly higher across increasing tertiles of 24-h urinary salt excretion (P for trend < 0·001, mean difference T3 v. T1 = 6·1 cm, adjusted for a range of demographic covariates and energy intake).
Three studies used waist:height ratio (WtHR) as a marker of central adiposity(Reference Grimes, Riddell and Campbell5,Reference Gilardini, Croci and Pasqualinotto116,Reference Rafie, Mohammadifard and Khosravi123) . Gilardini et al. reported a weak positive correlation between dietary Na intake and WtHR (r 0·15, P < 0·05) among obese children and adolescents after adjustment for age, sex and energy intake. The two other used a cut-point of WtHR > 0·5 to define central obesity and calculated OR associated with higher 24-h urinary Na excretion(Reference Grimes, Riddell and Campbell5,Reference Rafie, Mohammadifard and Khosravi123) . Among Iranian children aged 11–18 years, the odds of central obesity were 9·75 times greater (OR 9·75; 95 % CI 4·88, 19·5) for those children in the highest tertile of 24-h urinary Na compared with those in the lowest tertile, adjusted for a number of demographic covariates and physical activity. This association remained significant yet attenuated with additional adjustment for energy intake (OR 6·65; 95 % CI 3·24, 13·7); similarly, the association remained unchanged with additional adjustment for SSB intake (OR 9·75; 95 % CI 4·88, 19·5). Among Australian children aged 4–12 years, an additional 1 g/d of 24-h urinary salt was associated with a 1·15 greater odds of abdominal obesity (OR 1·15; 95 % CI 1·09, 1·23; P < 0·001, adjusted for demographic covariates) and this association remained significant with additional adjustment of energy intake in those children aged 8–12 years with these data available (OR 1·11; 95 % CI 1·02, 1·20; P = 0·001)(Reference Grimes, Riddell and Campbell5). Of note, this association was no longer present with the additional adjustment for BMI z-score (OR 1·00; 95 % CI 0·90, 1·10; P = 0·93) indicating that the association between Na intake and central adiposity was not independent of overall BW.
The final two studies defined abdominal obesity as a WC (cm) ≥90th percentile for sex and age(Reference Yoon and Oh12,Reference Lee and Kim119) . Both of these studies were completed in nationally representative samples of Korean children (e.g. Korea National Health and Nutrition Examination Survey (KHANES)) and utilised Na density (24-h diet recall) as the exposure variable. Similar findings were reported across studies, whereby those in the highest ntile for Na had significantly higher odds of abdominal obesity compared with those in the lowest ntiles; this was after adjustment for demographic covariates, physical activity and energy intake. Lee et al. (Reference Lee and Kim119) also adjusted for SSB intake and found significant positive associations remained (online Supplementary Table S17).
Secondary adiposity outcome: body composition
Four studies assessed the association between Na intake and a measure of body composition; due to discrepancy across studies, none was combined in a pooled analysis(Reference Zhu, Pollock and Kotak7,Reference Ma, He and Macgregor9,Reference Ellison, Sosenko and Harper115,Reference Lee and Kim119) (online Supplementary Table S18).
Systematic review findings: body composition
The study by Ellison et al. completed in US adolescents (n 248) only reported an unadjusted correlation coefficient between Na intake (3 × overnight urines) and percentage body fat as calculated from predictive equations. In the present study, there was no correlation between overnight urinary Na and percentage body fat (r 0·14, P = 0·10). The other three studies were more comprehensive in adjustment for covariates and utilised more robust measures of body composition; however, findings across study’s findings were mixed(Reference Zhu, Pollock and Kotak7,Reference Ma, He and Macgregor9,Reference Lee and Kim119) . Among US adolescents, Zhu et al. (n 766) reported a significant positive association between Na intake (mg/d) (3 × 24 h diet recall) and percentage body fat (β = 0·31, P = 0·03) and fat mass (β = 0·23, P = 0·01) as assessed by dual energy X-ray absorptiometry. This included adjustment for a comprehensive range of demographic characteristics, physical activity, energy and SSB intake. Ma et al. reported similar findings among a sub-sample of UK children (n 67) from the National Diet and Nutrition Survey Rolling Programme who had body composition data derived from doubly labelled water(Reference Ma, He and Macgregor9). In this group, an additional 393 mg/d of Na (1 g/d salt), assessed by 24-h urine collection, was associated with 0·73 kg greater body fat mass (P = 0·001, adjusted for demographic characteristics and energy intake). Whereas among Korean children (n 1467), Lee et al. (Reference Lee and Kim119) reported no association between Na density (mg/d) and percentage body fat (i.e. >25 % boys, >30 % girls) after adjustment for demographic covariates, energy intake and SSB intake (online Supplementary Table S18).
Children: longitudinal studies (adiposity outcomes)
Two longitudinal studies reported on the relationship between Na intake and measures of adiposity (online Supplementary Table S9). No pooled analysis of these studies could be completed.
Systematic review findings: adiposity outcomes
Firstly, Lee et al. (Reference Lee, Kwon and Park126) reported on the change in incidence of obesity related to Na intake among 8–9-year-old Korean children whom at baseline were of a healthy weight. Na intake was measured by 3 × 24-h dietary recalls, and obesity was defined as BMI percentile ≥85th according to Korean National Growth Charts. Over the 3-year follow-up, 10 % of children developed obesity. Those children who remained a healthy weight had a significant reduction in Na intake (−231 mg/d) during the follow-up period, whereas those children who developed obesity had no change in Na intake. When comparing relative frequency of obesity by change in Na intake over time, those children who increased Na intake during the follow-up period (Q2–Q4 mean change 115 mg/d) were almost three times more likely to develop obesity, compared to those with the greatest reductions in Na intake (Q1 mean −1451 mg/d). The effects of higher Na intakes on the development of obesity were more pronounced among females with genetic mutations of particular salt sensitive genes (online Supplementary Table S9). The present study was rated as moderate quality (online Supplementary Table S10). Secondly, Libuda et al. (Reference Libuda, Kersting and Alexy6) reported on 5-year changes in BMI sd score and percentage body fat associated with Na intake (24-h urine collection) among German children aged 3–18 years. In this analysis, there was no association between change in BMI sd score and baseline Na intake nor change in Na intake during follow-up (adjusted for age, sex, parental BMI, SSB intake and/or energy intake). With regard to percentage body fat, when adjusted for age, sex, parental BMI and energy intake, a higher baseline Na intake (1000 mg/d) predicted a positive change (+0·476 %, P = 0·044) in percentage body fat; however, with the removal of energy intake from the model, the association was no longer significant (+0·364, P = 0·073) (online Supplementary Table S9). Conversely, there was no indication of an association between change in Na intake and percentage body fat. The present study was rated as high quality (online Supplementary Table S20).
Children: randomised controlled trials (body weight outcome)
As only two RCT in children(Reference He, Wu and Feng39,Reference Gillum, Elmer and Prineas127) were identified, no meta-analysis was completed. Characteristics of these studies are reported in online Supplementary Table S11.
Systematic review findings: body weight
In both studies, the primary outcome was Na reduction and the intervention included family based education and behavioural strategies to lower salt intake in the home. The study by Gillum et al. (Reference Gillum, Elmer and Prineas127) was completed in US schoolchildren aged 6–9 years and the intervention lasted 1 year. During this time, there was no change in children’s Na intake as measured by 10-h overnight urine samples. With regard to change in BW as expected for children growing, both groups put weight on (mean control +3·9 kg and experimental +2·5 kg). The net difference in weight gain between groups was −1·4 kg; however, no statistical tests were performed on this change. Risk of bias assessment for the present study is shown in online Supplementary Table S12. The second study by He et al. (Reference He, Wu and Feng39) was a 3·5 month intervention completed in grade 5 children attending primary schools located in northern China. Overall, the present study was rated as low for risk of bias (online Supplementary Table S12). In the present study, a significant reduction of 50 mmol/d of Na intake (assessed by 2 × 24-h urine samples) between groups was achieved. In both groups, BW increased (mean control +3·8 (sd 1·8) kg and experimental +4·1 (2·1) kg) resulting in a net between group BW change of +0·3 kg; again no statistical analysis on this difference was performed.
Secondary aim: sugar-sweetened beverage consumption
No studies assessing the association between Na intake and SSB consumption among adults were retrieved. In children, four cross-sectional(Reference Grimes, Riddel and Campbell14–Reference He, Marrero and MacGregor16,Reference Marventano, Ferranti and Antoci128) and one longitudinal study(Reference Libuda, Kersting and Alexy6) reported on the association between Na intake and SSB consumption (online Supplementary Table S19). Studies included children aged 2–18 years and were conducted in the UK(Reference He, Marrero and MacGregor16), Australia(Reference Grimes, Riddel and Campbell14), USA(Reference Grimes, Wright and Liu15), Italy(Reference Marventano, Ferranti and Antoci128) and Germany(Reference Libuda, Kersting and Alexy6). All of the cross-sectional studies utilised dietary methods to assess Na intake, this included 7-d weighed records(Reference He, Marrero and MacGregor16), 24-h dietary recalls(Reference Grimes, Riddel and Campbell14,Reference Grimes, Wright and Liu15) or FFQ(Reference Marventano, Ferranti and Antoci128) and only the longitudinal study utilised 24-h urine collections(Reference Libuda, Kersting and Alexy6). There was some variation in the definition of SSB used across studies (online Supplementary Table S19).
Quality assessment
Based on the NOS, all of the studies were deemed as moderate quality (online Supplementary Table S20).
Meta-analysis findings: sugar-sweetened beverage consumption
A meta-analysis of the four cross-sectional studies (five effect sizes; 10 328 participants) showed that a 393 mg/d higher Na intake (salt 1 g/d) was associated with a 22 g/d higher SSB intake (95 % CI 16, 26 g/d; P < 0·001) (online Supplementary Fig. S21). There was no indication of statistical heterogeneity (Cochran’s Q statistic P = 0·369; I 2 7 %; 95 % CI 0, 81 %).
Systematic review findings: sugar-sweetened beverage consumption
In the 5-year longitudinal study of German children, it was found that a 393 mg/d change in Na intake predicted a 12 g/d increase in SSB intake (P = 0·027, fully adjusted model) (online Supplementary Table S19).
Discussion
In this systematic review and meta-analysis, we found consistent positive cross-sectional associations between Na intake and adiposity outcomes for children and adults. Findings from the limited number of retrieved longitudinal studies were mixed and nuanced, with findings dependent on covariate adjustment. Results from pooled RCT in adults indicated a trend for lower BW on reduced-Na compared with control diets; however, the effect estimate was very small and did not reach statistical significance (P = 0·06). In children, there were too few RCT retrieved to draw meaningful conclusions. Finally, in children, meta-analysis indicated that Na intake was positively associated with SSB intake; this was also supported with findings from one longitudinal study which showed over a 5-year follow-up period Na predicted SSB consumption.
Most studies within this review were cross-sectional. The large variation in variables reported across studies meant less than half were combined in pooled analyses. Findings from pooled cross-sectional studies in adults showed a higher Na intake was associated with higher BMI, higher odds of overweight/obesity, higher BW, higher WC and higher odds of abdominal obesity. These findings are consistent with those reported in a smaller meta-analysis of cross-sectional studies (n 18) covering publications up until 2016(Reference Moosavian, Haghighatdoost and Surkan22).
Many of the cross-sectional studies in this review were not designed to assess the association between Na intake and adiposity indices, as such a large proportion of studies lacked covariate adjustment. This limits the robustness of reported pooled associations. However, it should be noted that in alternative pooled analyses of studies which adjusted for a range of important covariates, including energy intake we found consistent positive associations with Na intake and BMI and abdominal obesity. A limitation of studies assessing abdominal obesity as an outcome was omission of adjustment for BW or BMI. As larger people tend to have a higher WC, it is unknown if the reported positive association of Na on abdominal obesity is independent of overall body size. The only study to include additional adjustment of BMI in a model assessing WC as an outcome in children found no BMI independent association of Na intake to abdominal obesity(Reference Grimes, Riddell and Campbell5).
We also conducted sensitivity analyses to assess the potential impact of adjustment with energy intake. While these analyses were restricted to limited studies, findings for effect size estimates were consistent and unchanged when adjusted with energy intake suggesting the association between Na intake and BMI, weight category and WC was independent of energy intake. Furthermore, for the most part studies included in the qualitative review which adjusted for energy intake aligned with findings from pooled analyses. With regard to children, findings from the one pooled analysis for risk of overweight/obesity were consistent with the positive association observed in adults; however, the associated odds were considerably larger, for example, 3·3 v. 1·6 times among adults. All three of these studies included energy adjustment. Overall, very few studies considered adjustment for SSB intake; however, this was more common in paediatric studies. Within these limited studies, findings suggested that the association between Na and adiposity measures remained independent of SSB intake.
Within studies included in this review, daily Na intake varied substantially across different population groups. The WHO recommends salt intake be limited to 5 g or less per d (Na 2000 mg/d)(129). The 2010 Global Burden of Disease Study reported a global mean Na intake of 3950 mg/d (salt 10 g/d); however, regional estimates for salt intake varied, with the highest intakes in Central Asia, East Asia and Asia Pacific (average >4500 mg/d (salt 11 g/d)) and lower intakes in Central and Western Europe, Australasia and Latin America (average range 3000–4000 mg/d (salt 7·5–10 g/d))(Reference Powles, Fahimi and Micha130). Within cross-sectional studies included in this review, the difference in Na intake across ntiles cut-points was large, averaging between 2350 and 4325 mg/d (salt 6–11 g/d). This finding reflects the relatively high and varied Na intakes observed in a number of the included population groups, particularly within Asian countries (e.g. Korea). Of note, in analyses restricted to studies examining the association between adiposity outcomes with a much smaller difference in Na intake (e.g. 390 mg/d (equivalent to 1 g/d salt)), significant positive associations with adiposity outcomes were still noted; however, they were much more modest in effect size.
The relationship between Na intake and adiposity could be influenced by other factors such as sex, race and age. In the current review, it was possible to pool cross-sectional data by sex to examine if the effect of higher Na intake on BMI or risk of overweight/obesity differed by men and women. Within this analysis, we found results were overall comparable for both. It is, however, unknown if sex differences exist for other reported adiposity outcomes, such as WC and body composition as there were too few studies to pool for these measures. Similarly, due to how data were reported we could not complete more in-depth analysis to examine the potential effects of age or race. While it is possible to review individual effect estimates for higher Na intake and markers of adiposity across different countries and regions, due to the large variation observed, it is difficult to draw any meaningful conclusions.
Overall, the mixed findings from the very limited number of longitudinal studies did not support those from cross-sectional studies with regard to BMI or BW. In adults, three out of the four studies were not designed to examine the relationship between Na intake and adiposity outcomes(Reference Ard, Coffman and Lin105–Reference Takahashi, Sasaki and Okubo107); two of these studies showed no change in Na intake during the follow-up period (1–4 years), nor change in BW(Reference Ard, Coffman and Lin105,Reference Takahashi, Sasaki and Okubo107) , whereas one showed a significant reduction in Na intake over an average 9-year follow-up period, but no change in BW(Reference Sakaki, Tsuchihashi and Arakawa106). The only longitudinal study retrieved which included BW as well as more robust measures of adiposity (e.g. WC and body composition) was that conducted by Larsen et al. (Reference Larsen, Ängquist and Sørensen8). This study(Reference Larsen, Ängquist and Sørensen8), considered high quality, found no association between baseline Na intake, assessed by 24-h urinary Na and 6-year change in BW or WC. A higher baseline Na intake was associated with an increase in body fat; however, this was only apparent after adjustment for change in BW between baseline and follow-up(Reference Larsen, Ängquist and Sørensen8). These findings suggest that any potential relationship between higher Na intakes and adiposity is specific to changes in body composition and independent of changes in BW. Some animal experiments support a link between higher-Na diets and the accretion of fat tissue(Reference Fonseca-Alaniz, Brito and Borges-Silva131,Reference Fonseca-Alaniz, Takada and Andreotti132) . In children, findings from the two longitudinal studies were also mixed, with Na intake predicting 3-year change in obesity prevalence in Korean children; however, among German children and adolescents, there was no association between Na intake and BMI sd score, yet there was some indication of a higher baseline Na intake predicting a positive change in percentage body fat but only when energy intake was included in the model. In summary, the only consistent finding that emerged from review of longitudinal studies is related to observations between higher Na intakes and adverse changes in body composition; however, these findings were very limited and the changes in effect estimates were very small, not generalisable to other population groups and layered with complexities surrounding covariate adjustment. These findings for body composition were aligned with those reported in cross-sectional studies, where there was some indication of a positive association between Na intake and body fat in both adults and children.
Finally, the RCT conducted in adults aligned with findings observed in cross-sectional analyses, indicating that following a reduced-Na diet, reduced BW compared with control diets, but the pooled effect size did not reach statistical significance. The average reduction in Na intake achieved in the reduced-Na diets v. control diet group was 897 mg/d (salt 2·3 g/d); however, not all studies achieved significant reductions in Na intake. Furthermore, some studies were very small, and importantly none of the studies was designed to assess change in BW as a primary outcome of the trial. Across studies, it is unclear if energy intakes may have inadvertently differed among participants in reduced-Na v. control diet groups. While studies were designed to solely reduce Na intake, maintaining the same energy intake in free-living populations can be difficult in countries where the main source of Na is manufactured foods. Lower-Na foods are less available, and eating out can be difficult on a lower-Na diet. Recommended foods on a lower-Na diet also tend to be less energy dense, for example, fruits and vegetables. Only two(Reference Geleijnse, Witteman and Bak31,Reference Nowson, Wattanapenpaiboon and Pachett33) of the fifteen studies tried to limit the effects of this by providing reduced-Na alternatives for key intervention target foods. One reported a small non-significant trend for a 0·5 kg (P = 0·06) greater reduction in BW on the lower-Na diet(Reference Geleijnse, Witteman and Bak31), while the other reported a significant reduction of approximately 1 kg in both the intervention and control groups(Reference Nowson, Wattanapenpaiboon and Pachett33).
A number of potential mechanisms may explain a relationship between Na intake and adiposity outcomes, all of which are characterised by higher intakes of energy. Firstly, the addition of salt to food enhances palatability and encourages greater intake of food and energy(Reference Bolhuis, Lakemond and de Wijk13). Secondly, it has been hypothesised that salted food activates the hedonic reward centre of the brain, leading to a salted food addiction which encourages overeating and increased energy intake(Reference Cocores and Gold133). Thirdly, as Na intake stimulates thirst and fluid intake(Reference He, Markandu and Sagnella17,Reference Stachenfeld134) , a high-salt diet may encourage greater consumption of SSB(Reference Karppanen and Mervaala18). Fourthly, a high-salt diet may play a role in the regulation of appetite hormones such as ghrelin(Reference Zhang, Li and Liu135) and leptin(Reference Zhu, Pollock and Kotak7,Reference Lanaspa, Kuwabara and Andres-Hernando136) . While Na itself does not provide energy, it appears higher intakes may drive behavioural or physiological changes that in turn favour greater energy consumption.
In contrast, we found that overall the additional adjustment of energy intake in cross-sectional studies did not alter associations between Na and adiposity outcomes. A potential mechanism independent of energy intake explored in rat studies relates to the effect of higher Na intakes on alterations in glucose metabolism which favour fat tissue deposition(Reference Fonseca-Alaniz, Brito and Borges-Silva131,Reference Fonseca-Alaniz, Takada and Andreotti132) . In chimpanzees fed an energy-matched diet that only differed in Na intake, after a 19 week feeding period those in the higher-Na diet experimental group (2000 mg/d) had a significant 8 % increase in BW, whereas those in the control group (391 mg/d) had no change in BW(Reference Denton, Weisinger and Mundy137). It is interesting to note that the observed relationship between higher Na intakes and adiposity outcomes was consistent across a wide range of countries where the typical dietary sources of Na differ substantially. In modern-day Westernised food systems, most Na (approximately 75–95 %) is derived from salt added to processed manufactured foods(Reference Brown, Tzoulaki and Candeias19,Reference Anderson, Appel and Okuda138,Reference Lee, Duffey and Popkin139) , in comparison in Asian countries most Na (approximately 65–75 %) is derived from salt or salty condiments (e.g. soya sauce, soyabean paste) added at home in cooking or at the table or via preserved or fermented vegetables (e.g. Kimchi)(Reference Anderson, Appel and Okuda138,Reference Lee, Duffey and Popkin139) .
Strengths of this review include the wide inclusion criteria for study design, comprehensive search across a wide range of databases and completion of study selection in duplicate. A limitation is that most included studies were cross-sectional, making it impossible to ascertain a temporal relationship between high Na intake and gains in adiposity measures, and although longitudinal studies were included, too few were retrieved to confirm the reported cross-sectional positive associations. Overall, there was a lack of high-quality observational studies retrieved. For example, in adults less than a third (30 %) of cross-sectional studies included in meta-analyses and only 1/4 of longitudinal studies were deemed as high quality; in children, this was 8/17 for cross-sectional and 1/2 for longitudinal studies. Within individual studies, errors associated with measures of dietary salt and energy intake determined via dietary methods are acknowledged. Cross-sectional studies reviewed that examined the effect of Na intake on BW were particularly limited in that most studies did not adjust for any covariates. It is therefore likely that other factors unrelated to Na intake accounted for the large reported differences in BW between those consuming higher and lower intakes of Na. Although BW was included as an outcome within this review, it is acknowledged that in isolation this measure is somewhat limited in its ability to predict chronic disease risk that is associated with a greater body fat mass. More robust measures of adiposity included within the observational study arm of this review include BMI, WC and percentage body fat. In most of the completed pooled analyses, publication bias could not be assessed due to insufficient study numbers. Among cross-sectional studies assessing the relationship between Na intake and BMI in adults, there was some indication of publication bias favouring those studies reporting significant positive effects. On the contrary, no publication bias was detected in pooled analyses of RCT. Overall, in pooled analyses of cross-sectional studies substantial to considerable heterogeneity was detected. Due to the limited number of studies that could be combined in separate meta-analyses, we only examined two potential sources of heterogeneity (e.g. Na intake assessment method and study quality) in the largest pooled analysis (n 22 studies) with BMI as an outcome, and found that neither of these factors explained the observed heterogeneity. Within these studies, other potential sources of heterogeneity could be study population, covariate adjustment and difference in Na intake between groups. Within the pooled analyses of RCT, a moderate degree of heterogeneity was detected; differences in study populations, intervention duration and the extent of Na reduction achieved may have contributed to this.
Clinical implications
From the current systematic review and meta-analysis, the relationship between Na intake and measures of adiposity remains unclear. While findings from cross-sectional studies among adults and children lend support to a positive association between these two factors, which may be independent of energy intake, these findings have not been clearly confirmed by longitudinal studies nor RCT. This is due to a lack of available high-quality longitudinal studies conducted in this area as well as the previously outlined inherent difficulties in conducting RCT which include a reduced-Na diet that is in fact equivalent in energy intake to the control diet. At present, the available evidence does not support any recommendations for clinical practice in regard to reduced-Na diets to aid with weight loss. Rather to clarify the relationship between high Na intakes and excess weight gain, it is recommended that additional high-quality longitudinal studies are conducted which include robust measures of Na intake (e.g. repeated 24-h urines to determine usual intakes), energy intake (e.g. 24-h diet recall with consideration for potential under-reporting) and other important confounders (e.g. physical activity data), combined with objective measures of anthropometry (e.g. body composition assessed by dual-energy X-ray absorptiometry). This should be combined with animal and human studies which explore and identify clear physiological pathways linking higher Na intake with increased fat deposition independent of energy intake, such as feeding trials conducted in humans that objectively measure daily Na and energy intake together with energy expenditure. Well-controlled studies that objectively assess if increasing the palatability of food through increased Na concentration is a contributing factor to excess energy consumption would also be valuable.
Acknowledgements
At the time of this work, C. A. G. was supported by a National Heart Foundation of Australia Postdoctoral Fellowship (Award ID: 100155) and an Alfred Deakin Postdoctoral Fellowship. None of the funders had a role in the design, analysis or writing of this article.
C. A. G. and C. A. N. designed the research. C. A. N. and F. H. H. provided expert guidance. C. A. G. completed the searches. A. G., A. B. B., K. A. B., D. K. and C. S. completed the data extraction. C. A. G. completed the analysis. C. A. G. drafted the manuscript. All authors reviewed and revised the manuscript and approved the final manuscript as submitted.
C. A. G. and C. A. N. are members of World Action on Salt & Health (WASH) which is a non-profit charitable organisation and neither receive any financial support from WASH. F. H. H. is a member of Consensus Action on Salt & Health (CASH) and WASH. Both CASH and WASH are non-profit charitable organisations and F. H. H. does not receive any financial support from CASH or WASH.
K. A. B., A. B. B., D. K. and C. S. have nothing to disclose.
Supplementary material
For supplementary materials referred to in this article, please visit https://doi.org/10.1017/S0007114520004122


