


Most experimental data sets on Zn metabolism reflect studies that used severely Zn-depleted animals expressing symptoms of clinical Zn deficiency. However, this condition appears to be rare in nature and especially under livestock rearing conditions because the generous supplementation of Zn to feed is standard practice( 1 – 6 ). Furthermore, investigations into Zn metabolic functions or the estimation of measures reflecting the efficacy of Zn feeding interventions may be biased under pathophysiological conditions because of significant secondary metabolic events. A more likely scenario of Zn malnutrition is a subclinical Zn deficiency (SZD), under which the animal expresses no visible symptoms of Zn depletion (e.g. growth depression, feed refusal, tissue necrosis etc.( Reference Prasad 7 )) but significant shifts in physiological parameters( Reference Brugger, Buffler and Windisch 8 – Reference Brugger and Windisch 10 ). This condition could arise through periods of fluctuating dietary Zn supply and/or increased demand (e.g. during inflammation, stress etc.). Because SZD is not accompanied by severe secondary metabolic events, it may be a more appropriate model for studies on Zn metabolism. Furthermore, pigs respond quite similar to dietary intervention compared to humans( Reference Nielsen, Hartvigsen and Hedemann 11 ). Therefore, an SZD model in piglets may not only be beneficial for the understanding of pig physiology but also be considered as a proper translational model for humans.
Recently, an experimental approach has been published that promotes short-term SZD in fully weaned piglets( Reference Brugger, Buffler and Windisch 8 ). It has been shown that this condition is accompanied by a loss of digestive and antioxidative capacity( Reference Brugger and Windisch 9 – Reference Brugger and Windisch 12 ). Simultaneously, no symptoms of clinical Zn deficiency were evident. Furthermore, the gross Zn requirement under given experimental conditions was estimated at 58 mg Zn/kg diet( Reference Brugger, Buffler and Windisch 8 ).
To better understand the Zn homoeostatic regulation behind these functional adaptions, this study investigated the response of Zn concentrations in various biological matrices in response to finely graded differences in alimentary Zn supply. This represents the fourth publication on the physiological response to our SZD model in weaned piglets and provides, to our knowledge, the first comparative description of tissue Zn concentration patterns in growing individuals as affected by short-term SZD.
Methods
This animal study was approved and registered by the responsible animal welfare authorities (District Government of Upper Bavaria, Federal State of Bavaria: case number 55.2.1.54-2532.3.63-11).
Animals and diets
This is the fourth publication based on an experiment setup that has been described in detail earlier( Reference Brugger, Buffler and Windisch 8 ). In brief, forty-eight fully weaned piglets (hybrids of German Large White×Land Race×Piétrain; 50 % female, 50 % male-castrated; initial average body weight 8·5 (sd 0·27) kg, supplier: pig farm of Christian Hilgers (Germany)) from six litters were fed a Zn adequate (60 mg added Zn/kg as ZnSO4.7H2O yielding 88·0 mg analysed Zn/kg diet) maize–soyabean meal-based diet ad libitum, during a 2-week acclimatisation phase (Table 1). Subsequently, animals were subject to eight different treatment groups (n 6) by a balanced distribution of litter mates, sex and body weight (blocking). These groups received restrictively (450 g/d) the same basal diet (28·1 mg native Zn/kg diet) as during acclimatisation but with finely graded differences in dietary Zn supply (0, 5, 10, 15, 20, 30, 40, 60 mg added Zn/kg diet from ZnSO4.7H2O yielding 28·1, 33·6, 38·8, 42·7, 47·5, 58·2, 67·8, 88·0 mg total Zn/kg diet) for a total experimental period of 8 d. The highest supplied group (88·0 mg Zn/kg) was considered as control because it represented the supply level fed during the 2 weeks of acclimatisation. The individual animal represented the experimental unit. Animals were handled and assessed block-wise to avoid bias.
Table 1 Composition as well as concentrations of metabolisable energy and crude nutrients of the basal diet( Reference Brugger, Buffler and Windisch 8 )
* Premix composition: 2·80 % MgO; 0·08 % CuSO4.5H2O; 2·00 % FeSO4.7H2O; 0·20 % MnSO4.H2O; 0·002 % Na2SeO3.5H2O; 0·002 % KI; 0·05 % retinyl propionate; 0·007 % cholecalciferol; 0·20 % all-rac-α-tocopherol; 0·002 % menadione; 0·01 % thiamine; 0·03 % riboflavin; 0·10 % nicotinic acid; 0·02 % pantothenic acid; 0·02 % pyridoxine; 0·15 % hydroxocobalamin; 0·03 % biotin; 0·002 % folic acid; 6·70 % choline; 77·6 % maize meal.
† The concentrations of metabolisable energy and essential pre-caecal digestible (synonymous with ‘ileal digestible’) amino acids were estimated according to feed table information (http://datenbank.futtermittel.net/). Vitamin and trace element concentrations (except Zn) met the requirements according to the National Research Council( Reference Brugger and Windisch 10 ).
Sampling conditions
After eight experimental days, all animals were killed without fasting by exsanguination under anaesthesia (azaperone and ketamine), block-wise to avoid bias. Sampling procedures for feed, faeces, blood plasma, bone and soft tissues have been described earlier( Reference Brugger, Buffler and Windisch 8 ). In brief, each experimental diet was sampled in individual airtight polyethylene bottles. Faecal, bone and soft tissue samples were collected in plastic bags and vacuumed. Li-heparin blood was centrifuged (1100 g , 4°C, 10 min) and the plasma was collected in Eppendorf tubes. All samples were stored at –20°C until analysis.
Chemical analyses
All samples were subject to DM and total Zn analysis as described in Brugger et al. ( Reference Brugger, Buffler and Windisch 8 ) Quantification of total Zn occurred by atomic absorption spectrophotometry (AAS) (NovAA 350, Analytik Jena AG) using a certified external AAS Zn standard (Merck 109953, Merck Millipore) after microwave wet digestion (Ethos 1, MLS GmbH).
Statistical analyses
All statistical procedures were performed with SAS 9.4 (SAS Institute Inc.). Linear broken-line regression models (y=a+bx; y=a+bx+cx) were calculated for tissue Zn concentrations in response to changes in dietary Zn concentration (procedure NLMIXED) using individual group means (n 8). Using single values from individual animals for regression analysis was not advisable, given the present experimental design as the imbalance in the ratio of X (eight dietary treatment groups) and Y (six response values per treatment group) would have caused a severe overestimation of the df and, therefore, false results. The broken-line regression approach represents an iterative procedure to estimate a potential dietary threshold (breakpoint) within non-linear data sets above and below which, respectively, a significant difference in the response behaviour of a certain parameter to the dietary treatment is evident( Reference Robbins, Saxton and Southern 13 ). If no significant breakpoint in parameter response could be estimated from respective data sets, a linear regression was calculated instead (y=a+bx) (procedure REG). Only significant regression models were applied for data presentation and interpretation. A threshold of P≤0·05 was considered to be significant.
Finally, k-means cluster analyses of tissue Zn concentrations were performed by applying the procedure FASTCLUS assuming k=6 and 5 clusters for clustering according to classification variables ‘dietary Zn concentration’ and ‘type of biological matrix’, respectively. In addition, the procedure FREQ was applied for frequency tabulation of the k-means clusters with the respective classification variable. Graphical display of the discriminatory power of k-means clusters was achieved by canonical discriminant analysis of the cluster data using the procedure CANDISC and plotting of canonical variables Can 1 v. Can 2. The FASTCLUS and CANDISC procedure provide statistical measures of the goddess of fit of respective k-means clustering models (approximate expected overall coefficient of determination (R 2), cubic clustering criterion (CCC)) as well as a P value regarding the significance of differences between clusters. These measures have been presented within respective figures.
The justification of the total sample size for the present experiment has been done earlier on base of plasma and liver Zn status parameters (Zn concentrations, enzyme activities, gene expression patterns)( Reference Brugger, Buffler and Windisch 8 ). Based on these assumptions it has been concluded that forty-eight animals in a completely randomised block design yielded in any case a statistical power of 1–β>0·8, which is generally accepted to represent the minimum power for studies on the kinetics and dynamics of substances within animal organisms( Reference McDonald 14 ). For the present data sets, which have been analysed using linear and non-linear regression models to compare the response of group means over dietary doses, we used the SAS 9.4 procedure POWER to justify this approach. Based on these estimations, the underlying effect sizes of presented models as well as for t tests (included in the procedures REG and NLMIXED) on the significance of certain statistical measures of these curves (slopes, breakpoints) exceeded in any case the minimum statistical power of 0·8.
Results
All animals developed equally during the whole trial period and expressed no signs of impaired health and well-being or other adverse effects (no signs of feed refusal, growth depression etc.( Reference Prasad 7 ))( Reference Brugger, Buffler and Windisch 8 ).
Fig. 1 highlights the response of tissue Zn concentration in jejunum, colon, mesenteric lymph follicles, thymus, spleen, skeletal muscle, kidney and epidermis in weaned piglets fed diets with varying dietary Zn concentration for 8 d. The statistical measures of the respective regression curves are shown in Table 2.
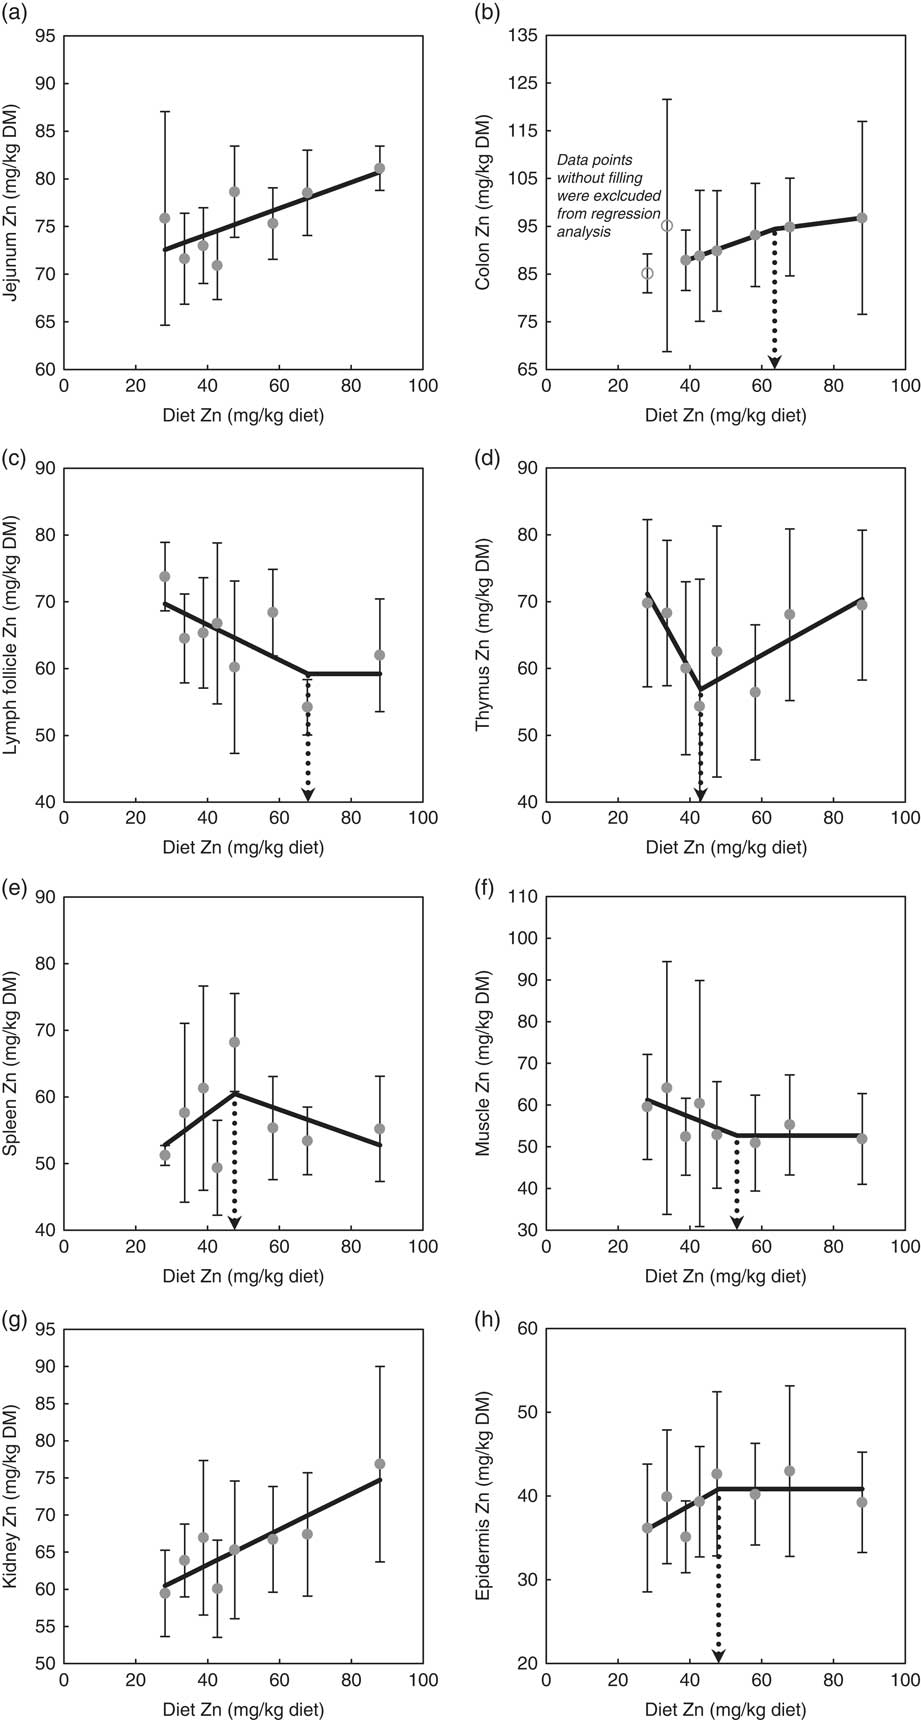
Fig. 1 Response of zinc concentrations in jejunum (a), colon (b), mesenteric lymph follicles (c), thymus (d), spleen (e), skeletal muscle (f), kidney (g) and epidermis (h) in weaned piglets fed diets with different zinc concentrations for 8 d (see Table 2 for detailed information on the statistical measures of the respective regression curves). Notes: values are arithmetic means and standard deviations, n 6. (a, g) ![]() , Group mean and standard deviation;
, Group mean and standard deviation; ![]() , linear regression. (b–f, h)
, linear regression. (b–f, h) ![]() , Group mean and standard deviation;
, Group mean and standard deviation; ![]() , broken-line regression.
, broken-line regression.
Table 2 Linear and broken-line regression analysis of tissue zinc concentrations of jejunum, kidney, colon, epidermis, skeletal muscle, mesenteric lymph follicle, thymus and spleen in weaned piglets fed diets with different zinc concentrations for 8 dFootnote † (Mean values with their standard errors)
se, standard error of respective parameter estimates; R 2, coefficient of determination; b, slope of the parameter response of the linear regression curves; X B, X intercept of the break point in parameter response; Y B, Y intercept of the break point in parameter response; b 1, slope of the broken-line regression curves over dietary Zn doses ≤X B; b 2, slope of the broken-line regression curves over dietary Zn doses >X B.
*P<0·05, **P<0·01, ***P<0·0001. Linear and broken-line regression models were estimated based on independent arithmetic group means relative to dietary Zn concentration (n 8; except for colon where the two lowest supplied groups were excluded from the analyses→n 6). Parameter estimates are presented as means with their standard errors to indicate the precision of estimation. P≤0·05 was considered to be significant.
† The applied dietary Zn concentrations were 28·1, 33·6, 38·8, 42·7, 47·5, 58·2, 67·8 and 88·0 mg Zn/kg.
Zn concentrations in jejunum and kidney followed a straight linear response with significant positive slopes over the full range of applied dietary Zn concentrations (P=0·04, 0·004, respectively). The remaining tissue Zn concentrations exhibited a non-linear behaviour in response to changes in dietary Zn concentration. Break points were evident based on significant estimates for X and Y intercepts of respective thresholds (X-intercept (mg Zn/kg diet) and Y-intercept (mg Zn/kg tissue DM): 63·6 and 94·4, 68·0 and 59·2, 43·0 and 56·9, 47·5 and 60·5, 53·1 and 52·7 and 48·0 and 40·8 for colon, mesenteric lymph follicles, thymus, spleen, skeletal muscle and epidermis, respectively; P<0·001 in all cases).
Above these break points, the response of total Zn concentration in mesenteric lymph follicles, skeletal muscle and epidermis plateaued in response to changes in dietary Zn concentration, whereas the Zn concentrations in colon, thymus and spleen correlated positively or negatively, respectively, with the dietary Zn concentration (P=0·001, 0·006, 0·24, respectively).
Below the respective breakpoints, the Zn concentrations in colon, spleen and epidermis exhibited a direct relationship (P<0·0001, P=0·22, P=0·14), whereas mesenteric lymph follicles, thymus and skeletal muscle followed an inverse response to further reduction in dietary Zn concentration (P=0·03, 0·003, 0·13, respectively). In case of colon Zn, the data points of the groups receiving 28·1 and 33·6 mg Zn/kg diet were excluded from the estimation of the broken-line regression model because they seemed to exhibit a distinct status of Zn homoeostatic regulation. This aspect has been further addressed within the ‘Discussion’ section.
The subsequently presented cluster analysis also included Zn concentrations in other matrices. These data sets have been published and discussed earlier( Reference Brugger, Buffler and Windisch 8 – Reference Brugger and Windisch 10 , Reference Brugger and Windisch 12 ). The respective response patterns over dietary Zn concentrations are highlighted in online Supplementary Fig. S1 and Supplementary Table S1.
Fig. 2 presents k-means cluster analysis of Zn concentration patterns in various biological matrices (soft tissue, bone, blood plasma, faeces) in weaned piglets fed diets with different Zn concentrations for 8 d. Tables 3 and 4 highlight the frequency tabulation of k-mean clusters with respective classification variables (‘dietary Zn concentration’, ‘type of biological matrix’) in addition to Fig. 2(a) and (b), respectively.
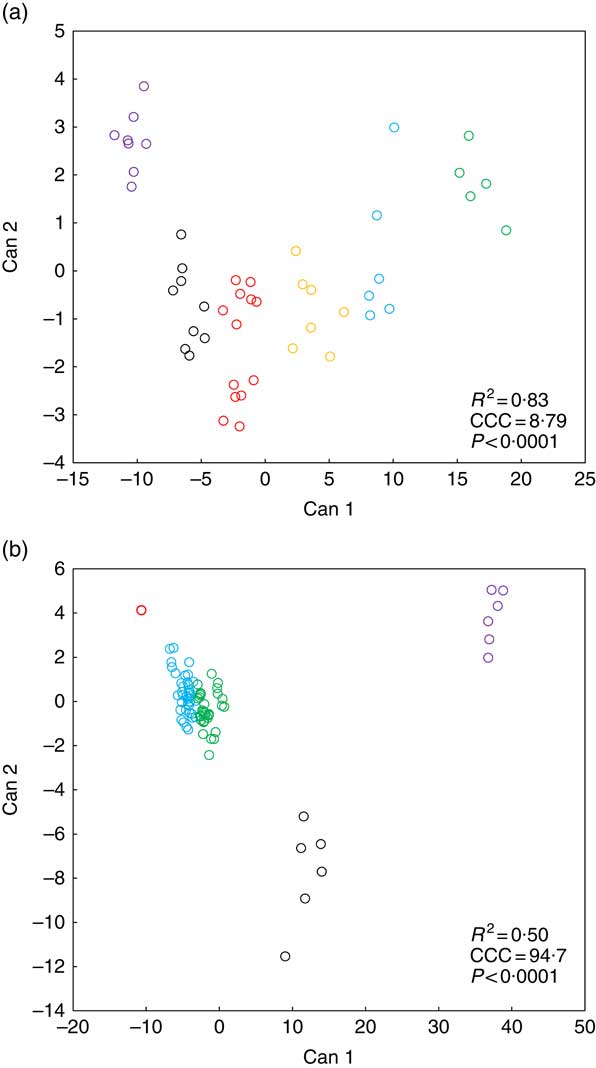
Fig. 2
K-means cluster analysis according to dietary zinc concentration (a) and type of biological matrix (b) of Zn concentration patterns in distinct types of biological matrices of weaned piglets fed diets with varying Zn concentration for 8 d (see Tables 3 and 4 for frequency tabulation of clusters according to the respective classification variables). Notes: Can, canonical variable; CCC, cubic clustering criterion; R
2, approximate expected overall coefficient of determination of the respective k-means clustering model. Data analysis comprised Zn concentrations from fifteen different biological matrices (faeces, femur, blood plasma, fundus, jejunum, colon, liver, kidney, pancreas, heart muscle, skeletal muscle, thymus, mesenteric lymph nodes, spleen and epidermis) sampled from forty-eight weaned piglets receiving finely graded differences in dietary Zn concentration (28·1, 33·6, 38·8, 42·7, 47·5, 58·2, 67·8 and 88·0 mg Zn/kg diet, respectively; n 6 animals per feeding group) yielding a total of 720 single data points; a total number of clusters of k=6 and 5 for clustering according to tissue zinc concentration and type of biological matrix, respectively, yielded the best results in terms of cluster discrimination using the FASTCLUS procedure of SAS 9.4; a cubic clustering criterion >3 is considered to represent good clustering of a data set(
Reference Institue Inc
15
); P<0·0001 indicates significant differences between certain clusters. ![]() , Cluster 1;
, Cluster 1; ![]() , cluster 2;
, cluster 2; ![]() , cluster 3;
, cluster 3; ![]() , cluster 4;
, cluster 4; ![]() , cluster 5;
, cluster 5; ![]() , cluster 6.
, cluster 6.
Table 3 Cross-tabulation of absolute and relative numbers of within-cluster mean values with the classification variable ‘dietary Zn concentration’ associated with a total of k=6 clusters after k-means cluster analysis of Zn concentrations in fifteen biological matrices from forty-eight weaned piglets fed varying dietary zinc concentrationsFootnote * (Numbers and percentages)
* n, absolute number of within-cluster mean values from a respective feeding group associated with one or more empirical clusters; %, percentage amount of within-cluster mean values from a respective feeding group associated with one or more empirical clusters. Forty-eight Zn concentration values per type of biological matrix (faeces, femur, blood plasma, fundus, jejunum, colon, liver, kidney, pancreas, heart muscle, skeletal muscle, thymus, mesenteric lymph nodes, spleen and epidermis) were considered yielding a total of 720 data points.
Table 4 Cross-tabulation of absolute and relative numbers of within-cluster mean values with the classification variable ‘type of biological matrix’ associated with a total of k=5 clusters after k-means cluster analysis of Zn concentrations in fifteen biological matrices from forty-eight weaned piglets fed varying dietary zinc concentrationsFootnote * (Numbers and percentages)
* n, absolute number of within-cluster mean values from a respective feeding group associated with one or more empirical clusters; %, percentage amount of within-cluster mean values from a respective feeding group associated with one or more empirical clusters; ninety Zn concentration values per Zn feeding group (28·1, 33·6, 38·8, 42·7, 47·5, 58·2, 67·8 and 88·0 mg Zn/kg diet) were considered yielding a total of 720 data points.
Cluster analyses according to classification variable ‘dietary Zn concentration’ (Fig. 2(a) and Table 3) as well as ‘type of biological matrix’ (Fig. 2(b) and Table 4) yielded CCC values >3, respectively, which is generally accepted as indicator of good clustering( Reference Institue Inc 15 ). Furthermore, in both cases significant differences between clusters were evident (P<0·0001).
Fig. 2(a) indicates a clear discrimination between each of the six clusters by canonical variable 1 (Can 1), whereas Can 2 only discriminated between cluster 1 and the sum of clusters 2, 3 and 6. Clusters 1–3 represent exclusively animals which were fed below the gross Zn requirement threshold under the present experimental conditions (58 mg Zn/kg diet), whereas clusters 4–6 contain only the sufficiently supplied groups (≥58 mg Zn/kg diet) (Tables 3). Frequency tabulation of data points further indicated the following gradual distribution of deficiently supplied groups over clusters: 100 % of values from 28·1 mg Zn/kg diet group associated with cluster 1; 33·3 and 66·7 % of values from 33·6 mg Zn/kg diet group associated with clusters 1 and 2, respectively; 66·7 and 33·3 % of values from 38·8 mg Zn/kg diet group associated with clusters 2 and 3, respectively; 16·7 and 83·3 % of values from 42·7 mg Zn/kg diet group associated with clusters 2 and 3, respectively; 100 % of values from 47·5 mg Zn/kg diet group associated with cluster 3. Clusters 4 and 6 are predominately represented by animals receiving either 58·2 or 67·8 mg Zn/kg diet in ratios of 16·7:83·3 and 66·7:33·3, respectively. The highest supplied group was associated with 16·7 % of values to cluster 4, whereas 83·3 % represented cluster 5.
According to Fig. 2(b), Can 1 discriminated between clusters 1, 2, 3 as well as the sum of clusters 4 and 5. In contrast, Can 2 discriminated between cluster 2 and the sum of clusters 1, 3, 4 and 5. Frequency tabulation indicated clusters 1, 2 and 3 to be exclusively represented by the biological matrices faeces, femur and blood plasma, respectively, with the values of the latter cluster being almost congruent. Clusters 4 and 5 are exclusively represented by soft tissues in following percentage amounts: 100 % of heart muscle, skeletal muscle, mesenteric lymph nodes, spleen and epidermis as well as 50 and 83·3 % of kidney and thymus, respectively, were associated with cluster 4; 100 % of fundus, jejunum, colon, liver and pancreas as well as 50 and 16·7 % of kidney and thymus, respectively, were associated with cluster 5.
Discussion
This study investigated the depletion and redistribution of body Zn in weaned piglets challenged with short-term SZD. Therefore, changes in Zn concentrations of several soft tissues as well as bone, plasma and faeces in response to finely graded differences in dietary Zn supply for 8 d were monitored. The suitability of our experimental design to induce SZD in weaned piglets has been discussed in detail in earlier publications( Reference Brugger, Buffler and Windisch 8 , Reference Brugger and Windisch 9 ).
The Zn concentrations within the biological matrices examined during the present study showed either a significant linear or non-linear pattern in response to changes in dietary Zn concentration. There was no tissue fraction that was not affected by the dietary treatment, which is in sharp contrast to earlier studies using models of clinical Zn deficiency. For example, it has been reported earlier that total Zn concentrations in heart, spleen and thymus were not affected by changes in alimentary Zn supply( Reference Giugliano and Millward 16 – Reference Windisch and Kirchgessner 18 ).
Muscle tissues (heart, skeletal) as well as immune tissues (mesenteric lymph follicles, thymus) exhibited a response pattern to varying dietary Zn supply which to our knowledge has been reported earlier only for the total Zn pool (but not the Zn concentration) within the skeletal muscle of clinical Zn-deficient growing rats( Reference Giugliano and Millward 16 ). These tissues either replenished their Zn concentrations after an initial depletion phase (heart, thymus) or even exceeded the control level (muscle, mesenteric lymph follicles) under the terms of deficient alimentary supply. This was to some extent also the case in pancreatic tissue, which has been demonstrated by Brugger & Windisch( Reference Brugger and Windisch 9 , Reference Brugger and Windisch 12 ). In the case of heart muscle, the repletion of tissue Zn concentrations in deficiently Zn supplied groups correlated with higher proapoptotic and antioxidative gene expression, which has been concluded to compensate for a significant loss in the tissue’s ability to detoxify reactive oxygen species( Reference Brugger and Windisch 10 ). Indeed, Zn is essential for basic cellular processes like the regulation of gene transcription or the maintenance of DNA integrity( Reference Andreini, Banci and Bertini 19 ). Therefore, we conclude that the response of Zn concentrations in muscle and immune tissues of Zn-depleted animals may also represent a compensation reaction. It is interesting that this kind of behaviour was mainly evident in organs that are supposed to be essential for the acute survival of the organism (heart, skeletal muscle, immune tissue and pancreas). Obviously, these tissues acted as Zn acceptors at the expense of other tissues, which released parts of their total Zn load to the periphery and/or reduced Zn uptake from the circulation (e.g. bone, kidney, liver, epidermis).
The non-linear response of spleen Zn concentration in the present study might have reflected an increased degradation of white blood cells and associated recycling of Zn released from degraded immune cells. This would be in context to Hosea et al. ( Reference Hosea, Rector and Taylor 20 ) who recognised a decrease in T cells and B cells within the spleen of Zn-deficient growing rats. However, this hypothesis is yet to be tested. Furthermore, an earlier study on the time course of SZD in rats recognised a stepwise decrease in spleen Zn concentration( Reference Canton and Cremin 21 ), however, other groups did not recognise any changes( Reference Windisch and Kirchgessner 17 , Reference Windisch and Kirchgessner 18 ). Future experiments should reproduce the spleen Zn response from the present study and investigate its mode of action.
In some earlier studies, the Zn concentrations within kidney and urine did not significantly respond to changes in dietary Zn supply( Reference Windisch and Kirchgessner 18 , Reference Windisch and Kirchgessner 22 , Reference Weigand and Kirchgessner 23 ). Therefore, the relevance of the kidney for the regulation of whole-body Zn homoeostasis was considered to be less important. However, a stable Zn load in times of fluctuating demands and/or supply levels, respectively, indicates a strict control of renal Zn fluxes. Given the timescale of earlier studies (approximately 2 weeks of insufficient dietary Zn supply), a lack in responsiveness of kidney/urinary Zn may indicate an end point in homoeostatic adaption to clinical Zn deficiency. Hence, under such conditions urinary Zn may represent inevitable endogenous losses (e.g. from sloughed nephric endothelial cells). However, the response of kidney Zn concentrations indicates a direct functional relationship to the status of bone Zn stores under the present experimental conditions. This decrease in Zn concentration may have happened in favour of other tissues (heart, skeletal muscle, thymus, mesenteric lymph follicles and pancreas) to compensate short-term Zn losses. This supports the data of Canton & Cremin( Reference Canton and Cremin 21 ) who also recognised a decrease in the concentrations of renal Zn in parallel to bone Zn in the course of SZD in the rat. Own data on the response of certain Zn transporters within the kidney indicated a controlled up-regulation of Zn recycling from the primary urine and, at the same time, an increase in Zn transport towards the circulation( Reference Brugger 24 ). It can be concluded that the kidney plays a key role within the network of whole-body Zn homoeostasis.
The present study highlighted obvious differences in the response of tissue Zn concentrations between the small and the large intestine. Jejunal Zn responded in a direct linear fashion to changes in dietary Zn concentration (thereby following the pattern of bone Zn depletion( Reference Brugger, Buffler and Windisch 8 )), whereas colonic Zn expressed a broken-line response whose break point equalled that of apparently digested feed Zn( Reference Brugger, Buffler and Windisch 8 ). Interestingly, studying Zn transporter gene expression (namely, the response of porcine solute carrier family (SLC) 39 member A4 (ZIP4)) indicated a significant non-linear response to the dietary Zn supply within the colon, but no significant regulation of the jejunal expression pattern under the present experimental conditions( Reference Brugger 24 ). Furthermore, the colonic ZIP4 expression showed a highly significant negative correlation with the apparent Zn digestion (r –0·91, P=0·002)( Reference Brugger 24 ). In a former study, Pfaffl & Windisch( Reference Pfaffl and Windisch 25 ) speculated about a potential shift in the main Zn absorption site from the small to the large intestine during the early stages of Zn deficiency. The authors based their assumption on peaks in the colonic expression of certain Zn responsive genes. Other groups demonstrated that the large intestine contributes to Zn absorption in times of impaired absorption from the small intestine( Reference Hara, Konishi and Kasai 26 , Reference Martin, Aydemir and Guthrie 27 ). Furthermore, certain digestive enzymes, like carboxypeptidases A and B, need Zn as catalytic cofactor( Reference Folk, Piez and Carroll 28 – Reference Hsu, Anilane and Scanlan 30 ). In light of earlier data regarding the loss in digestive capacity in response to SZD( Reference Brugger and Windisch 9 , Reference Brugger and Windisch 12 ), we hypothesise the organism shifted its main absorption site of Zn to the lower intestinal segments as an attempt to maintain the already impaired digestive capacity.
The response of colon Zn concentration in the group receiving 33·6 mg Zn/kg diet was completely different from the response of the six highest supplied groups (38·8–88·0 mg Zn/kg diet) and of the lowest supplied group (28·1 mg Zn/kg diet). This peak may have indicated an increased Zn uptake in this group. In good context to that, colonic metallothionein gene expression (MT1A and MT2B) also peaked in animals fed 33·6 mg Zn/kg diet (data not shown). Therefore, we conclude this finding was not due to analytical bias. The reason for this high Zn load remains yet unclear. Based on earlier data, the apparent feed Zn digestion in this group was slightly negative, indicating these animals excreted more Zn with the faeces than they ingested with the diet( Reference Brugger, Buffler and Windisch 8 ). Windisch & Kirchgessner( Reference Windisch and Kirchgessner 22 ) demonstrated that dietary phytate concentrations of 9 g/kg (which have been applied in the present study( Reference Brugger, Buffler and Windisch 8 )) completely eliminate the true absorption of native dietary Zn from the gastrointestinal tract. Therefore, we conclude the observed Zn uptake within the colonic mucosa of animals fed 33·6 mg Zn/kg diet occurred from the basolateral rather than the apical side. Gene expression data obtained from the same tissue samples indicated a numerical up-regulation of SLC39A14 (ZIP14) with decreasing dietary Zn supply below the gross Zn requirement threshold (58 mg Zn/kg diet)( Reference Brugger 24 ). This transporter is associated with the basolateral side of plasma membranes, where it pumps Zn from the circulation towards the cytosol( Reference Liuzzi, Lichten and Rivera 31 , Reference Guthrie, Aydemir and Troche 32 ). Interestingly, Guthrie et al. ( Reference Guthrie, Aydemir and Troche 32 ) demonstrated that the ZIP14 may be involved in the maintenance of intestinal barrier function, by demonstrating an increase in mucosal permeability in ZIP14 –/– mice. Other studies showed clear connections between the Zn supply and the status of gut permeability( Reference Zhang and Guo 33 – Reference Hennig, Wang and Ramasamy 35 ). Therefore, the observed peak in colonic Zn concentration in animals fed 33·6 mg Zn/kg diet may reflect a compensation reaction to stabilise gut permeability. However, we did not see such a peak in the lowest supplied group (28·1 mg Zn/kg diet). This group expressed the strongest negative apparent Zn digestion together with the strongest bone Zn depletion( Reference Brugger, Buffler and Windisch 8 ). Hence, its colon may have already been forced to reduce its Zn concentration to an inevitable minimum by ‘donating’ it to other tissues (e.g. the heart muscle). Indeed, this has yet to be proven in further studies.
To our knowledge, this is the first time the Zn supply status in response to varying dietary Zn supply was mapped by cluster analysis of body Zn pools. Interestingly, the sufficiently supplied groups (>58·0 mg Zn/kg diet) were not represented by one single cluster but three distinct clusters. These separated the majority of animals (83·3 %) supplied with the highest dietary Zn supply (88·0 mg Zn/kg diet) in cluster 5 from the other sufficiently supplied animals in clusters 4 and 6. This is in agreement with specific response patterns of certain matrices, which pointed towards a different response of animals receiving 58·2 and 67·8 mg Zn/kg diet relative to control (88·0 mg Zn/kg diet) (e.g. jejunum and kidney). This could be explained by earlier data on the kinetics of Zn homoeostatic regulation over time. As has been demonstrated earlier, a full adaption of whole-body Zn homoeostasis to changes in dietary Zn supply (as expressed by an up-regulation of absorptive capacity together with a decrease in endogenous losses) happens within approximately 3–5 d( Reference Windisch and Kirchgessner 18 , Reference Windisch 36 – Reference Windisch 41 ). This means every decrease in dietary Zn supply, even within ranges that would still be sufficient on a long-term scale, induces a short-term lack of absorbed dietary Zn, which is compensated mainly by Zn mobilisation from the skeleton. This aspect has already been discussed in more detail in an earlier publication( Reference Brugger, Buffler and Windisch 8 ). Furthermore, also the deficiently supplied groups (<58 mg Zn/kg diet) were not represented by only one but three distinct clusters, which showed a gradual distribution of animals of the five lowest supplied groups. This hints again towards different physiological states in response to varying alimentary Zn supply, especially between animals receiving 28·1 mg Zn/kg diet compared to 33·6 and 38·8 mg Zn/kg diet as well as 42·7 and 47·5 mg Zn/kg diet, respectively, based on the respective frequency tabulation. This is in good context to our earlier data on the response of cardiac redox metabolism( Reference Brugger and Windisch 10 ). The lowest Zn supplied groups already showed first signs of subclinical pathophysiological adaption (loss in cardiac antioxidative capacity, up-regulation of stress-responsive genes), whereas >40 mg Zn/kg diet animals still expressed a basal physiological status( Reference Brugger and Windisch 10 ).
Clustering our data over biological matrices separated the excretion, storage and distribution media (faeces, bone, plasma) from each other and soft tissues, respectively. However, the soft tissues were not represented by one single cluster but two. Based on the respective frequency tabulation, one of these clusters (cluster 5) was mainly represented by tissues of Zn metabolism by being involved in Zn acquisition (fundus, jejunum and colon), excretion (pancreas) or redistribution (liver), respectively. The other cluster (cluster 4) appears to be mainly represented by tissues that are important for the acute survival of the organism (heart muscle, skeletal muscle, lymph follicles, thymus, spleen and epidermis) and in which Zn concentrations may have been affected by the tissues of Zn metabolism. Although the already discussed regression data and the frequency tabulation of cluster composition appear to be in good context, the discrimination between clusters 4 and 5 was not very good based on the display of the relationship between canonical variables 1 and 2. Therefore, these results must be considered with caution.
The present study comprised varying supplementation of zinc sulphate to healthy animals. However, infections or different dietary Zn sources presumably would have changed the outcome of our study. Earlier published data suggest plasma hypozincaemia during systemic inflammation by SLC39A14 (ZIP14) activity at the basolateral membrane of hepatocytes( Reference Liuzzi, Lichten and Rivera 31 , Reference Liuzzi, Aydemir and Nam 42 ). Own data on Zn transporter gene expression in different tissues indicate certain transporters to be regulated by the stress status of a tissue rather than the Zn supply status of the organism( Reference Brugger 24 ). Hence, inflammatory processes have the potential to change the distribution of body Zn and may be able to interfere with the response to dietary Zn restriction. A variable bioavailability of the feed Zn might have also changed the current data set. A higher or lower available Zn source could have slowed down or increased Zn depletion over time, respectively. Hence, the above described dietary thresholds would have been altered. However, the hierarchy of body Zn redistribution would presumably not have been changed. In times of limited body Zn stores, the organism would expectedly favour tissues that are crucial for the acute survival in advance of others.
Conclusion
During the present study, novel response patterns of the adaption of tissue Zn concentration have been recognised. These included the replenishment and accumulation of Zn concentrations in tissues that are important for the acute survival of the developing organism (heart muscle, skeletal muscle, immune tissues and pancreas). This appears to have happened due to other body compartments ‘donating’ their Zn to these tissues during limited dietary Zn supply, which might indicate compensation reactions in times of increased cellular stress. Furthermore, this is to our knowledge the first study that mapped the gross Zn requirement by clustering tissue Zn concentrations between treatment groups. Clustering groups of biological matrices discriminated between excretion, storage and transport media as well as soft tissues. The present study highlights for the first time the dose-dependent kinetics of body Zn depletion and redistribution during short-term SZD in growing individuals. Given their high similarity regarding nutrition physiology, these data may be likely translated from pigs to humans.
Acknowledgements
The authors thank the Bayerische Arbeitsgemeinschaft Tierernährung (BAT) e.V. for the generous support of this study. BAT e.V. had no role in the design, analysis or writing of this article. Furthermore, the authors would like to express their deepest gratitude to Dr Astrid Kunert, Dr Martin Hanauer, Johanna Ortner, MSc, Anna Dettweiler, BSc, Maria Hechfellner, BSc, Vanessa Straub, BSc, Dipl. Ing. (FH) Michael Gertitschke and Andrea Reichlmeir for excellent technical assistance. Special gratitude is related to Brett Boden, BSc, for valuable advice on the manuscript.
D. B. designed and conducted the experiment, supervised the chemical analyses, analysed and interpreted the data and wrote the manuscript; and W. M. W. was the principal investigator and had primary responsibility for the final content.
The authors declare no conflicts of interest which could have biased their work.
Supplementary material
For supplementary material/s referred to in this article, please visit https://doi.org/10.1017/S0007114519000187


