


Introduction
The oral glucose tolerance test (OGTT) is used widely in both clinical practice and research for the diagnosis of impaired glucose tolerance and/or type 2 diabetes mellitus(Reference Kuo, Cheng and Li1). In one study, glucose tolerance during an OGTT was better after a 12-h fast than after a 4- or 8-h fast, although tolerance did not differ according to the duration of fasting in young adults (age 18–39 years)(Reference Walsh, O’Regan and O’Sullivan2). Prolonged fasting for ≥ 2 d produces a diabetic-like state that is characterised by impaired glucose tolerance, insulin resistance and ketosis in humans(Reference Anderson and Herman3–Reference Yang, Ma and Zhang8). It is unknown whether the duration of prolonged fasting influences the effects of fasting on glucose intolerance, as measured by the standard OGTT.
The sympathetic nervous system plays an important role in glucose metabolism. Norepinephrine increases glucose uptake in skeletal muscle and in white and brown adipose tissues (BAT) independent of insulin, whereas epinephrine increases hepatic glucose production and inhibits insulin secretion and glucose uptake by insulin-dependent tissues(Reference Nonogaki9). A previous study(Reference Zauner, Schneeweiss and Kranz10) reported that a 4-d fast led to a progressive increase in the serum concentration of norepinephrine but no change in that of epinephrine. It seems that during prolonged starvation, the sympathetic nervous system activates the mechanisms responsible for increasing the energy available for survival, which may have a substantial effect on glucose metabolism.
During fasting, liver glycogen stores are depleted, and lipolysis of triacylglycerols and diacylglycerols in adipocytes generates free fatty acids, which are transported into hepatocytes, where they are metabolised to acetyl CoA and used to generate the ketones acetone, acetoacetate and β-hydroxybutyrate(Reference Mattson, Moehl and Ghena11). In one study, supplementation with ketone monoesters before an OGTT increased blood β-hydroxybutyrate level to ∼3 mM and improved the glycaemic response, as shown by a 16 % decrease in the glucose area under the curve (AUC) and insulin sensitivity without an effect on insulin secretion(Reference Myette-Côté, Neudorf and Rafiei12). The mechanism responsible for these actions may involve activation of BAT. There is evidence that ketosis induced by ketone esters can increase BAT activation and overcome insulin resistance in mice(Reference Veech13). Following BAT transplantation, recipient mice showed improved glucose tolerance, increased insulin sensitivity, lower body weight, decreased fat mass and complete reversal of high-fat diet-induced insulin resistance(Reference Stanford, Middelbeek and Townsend14). These findings provide evidence that BAT is important for combating obesity, glucose intolerance and insulin resistance.
Despite the evoked ketosis, there is evidence that fasting can induce loss of uncoupling protein from BAT in rodents(Reference Trayhurn and Jennings15) and that the loss is greater after a 24-h fast than after a 72-h fast(Reference Gianotti, Clapés and Lladó16). Uncoupling protein is necessary for norepinephrine-induced glucose utilisation in BAT(Reference Inokuma, Ogura-Okamatsu and Toda17), and its expression is highly induced by cold via sympathetic nervous system and β-adrenergic receptors(Reference Razzoli, Emmett and Lazar18). A previous study reported that prolonged starvation increased uncoupling protein from mRNA in rat and that this change paralleled a decrease in body temperature at ambient temperature of 23°C(Reference Champigny and Ricquier19), which can be explained as an adaptive strategy to save energy(Reference Landsberg20). Therefore, it may be expected that, compared with a 2-d fast in healthy young adults, prolonged (6 d) fasting would increase norepinephrine and ketone concentrations and decrease core temperature to a greater extent and that these changes would lead to improved glucose tolerance (decreased AUC) and increased oral glucose insulin sensitivity (OGIS) index(Reference Mari, Pacini and Murphy21).
Although different fasting patterns, such as intermittent fasting (lasting from 12 to 48 h and repeated every 1 to 7 d) or periodic fasting (lasting from 2 to 7 d and repeated once per month), are a part of a new lifestyle approach for affecting longevity and health(Reference Longo, Di Tano and Mattson22), there is little information about the effects of the fasting duration on glucose tolerance and insulin sensitivity. Recently, it was established that over 10 d complete fasting, on 6th day, the glucose reaches the lowest level and metabolic shift from glucose to ketone bodies reaches a new balance, after which a stable energy supply could be maintained(Reference Yang, Ma and Zhang8). Thus, in this study, we explored whether prolonged fasting (6 days) induces lower glucose intolerance and greater insulin sensitivity than short-term fasting (2 days). Because postprandial hyperglycaemia can increase the risk of developing type 2 diabetes and cardiovascular diseases (CVDs)(Reference Numao, Kawano and Endo23), we also evaluated whether fasting-evoked glucose intolerance during the OGTT returns to the baseline values after 7 d of the usual diet. We expect this study to provide clinicians and nutrition specialists the information regarding immediate and residual effects of fasting duration on hyperglycaemia screening as well as the information required to choose a certain fasting duration or to develop further appropriate effective intermittent or periodic fasting protocols.
Materials and methods
Ethical approval
The present study was approved by The Lithuanian Sports University Bioethics Committee (No. MNL-SFZ(M)-2021–339) and conducted according to the guidelines laid down in the Declaration of Helsinki. Written informed consent was obtained from all participants during initial visit. The trial was registered at ClinicalTrials.gov (No. NCT05545943).
Participants
In total, fifty-two volunteers were assessed for eligibility. Eligible participants were healthy adult males with a body mass index (BMI) within the range of 19·5–29·9 kg/m2. The inclusion criteria were as follows: (i) no blood or needle phobia; (ii) no history of alcohol, nicotine or drug abuse; (iii) no history of an eating disorder; (iv) no medications and/or dietary supplements that could affect the experimental variables and (v) no neurological, cardiovascular, metabolic or inflammatory disease or conditions that could be worsened by fasting or that could affect the experimental variables. Volunteers were excluded if they had a history of an eating disorder, were in a weight-reduction program, followed a low-carbohydrate diet or were engaged in regular physical activity (> 3 times per week and > 150 min of moderate intensity or > 75 min of vigorous intensity activity per week) for ≥3 months. Nine participants did not meet the inclusion criteria and were excluded: three were obese (BMI > 30·0 kg/m2), one was underweight (BMI < 18·5 kg/m2), one followed a low-carbohydrate diet, three were engaged in regular physical activity and one had CVD. A final sample of forty-three participants was included (Fig. 1). Their mean age was 28·5 ± 7·7 years, body mass was 80·9 ± 11·6 kg and BMI was 24·1 ± 2·6 kg/m2.

Fig. 1. CONSORT flow chart of the study.
Study design and experimental protocol
We conducted a single-centre, parallel-group, single-blind randomised controlled trial at the Institute of Sports Science and Innovations, Lithuanian Sports University, from February 2021 to September 2022. Participants were instructed to avoid physically fatiguing exercises and the consumption of alcoholic beverages, caffeine or medications 72 h before each visit and throughout the experiment.
A schematic representation of the protocol is presented in Fig. 2. During the baseline assessment, the participant arrived at the laboratory following an 8–13-h overnight fast. The experiments began at 08:00–09:00. In the laboratory, all participants voided their bladders to estimate the level of hydration based on the specific gravity of urine (PocketChem UA PU-4010, Arkray Factory Inc., Kyoto, Japan). All participants were found to be hydrated (specific gravity, 1·020–1·030 g/ml)(Reference Armstrong24), and hydration status remained stable throughout all measurements. Body weight was measured, and a 20-gauge 32-mm intravenous catheter was inserted into the right median antecubital vein. Next, the participant self-inserted a rectal probe and was asked to rest in a semirecumbent position for 20 min in a quiet room at an ambient temperature of 24°C with 60 % relative humidity. Baseline values of skin (TS) and rectal (TR) temperatures and capillary ketone and glucose concentrations were measured. Venous blood samples were obtained for later measurement of catecholamine, glucose and insulin concentrations. This was followed by a standardised OGTT in which the participant ingested 75 g of glucose in 200 ml of water. Venous blood samples were obtained every 15 min for 2 h after glucose ingestion and used for measurement of glucose and insulin concentrations (Fig. 2(c)).
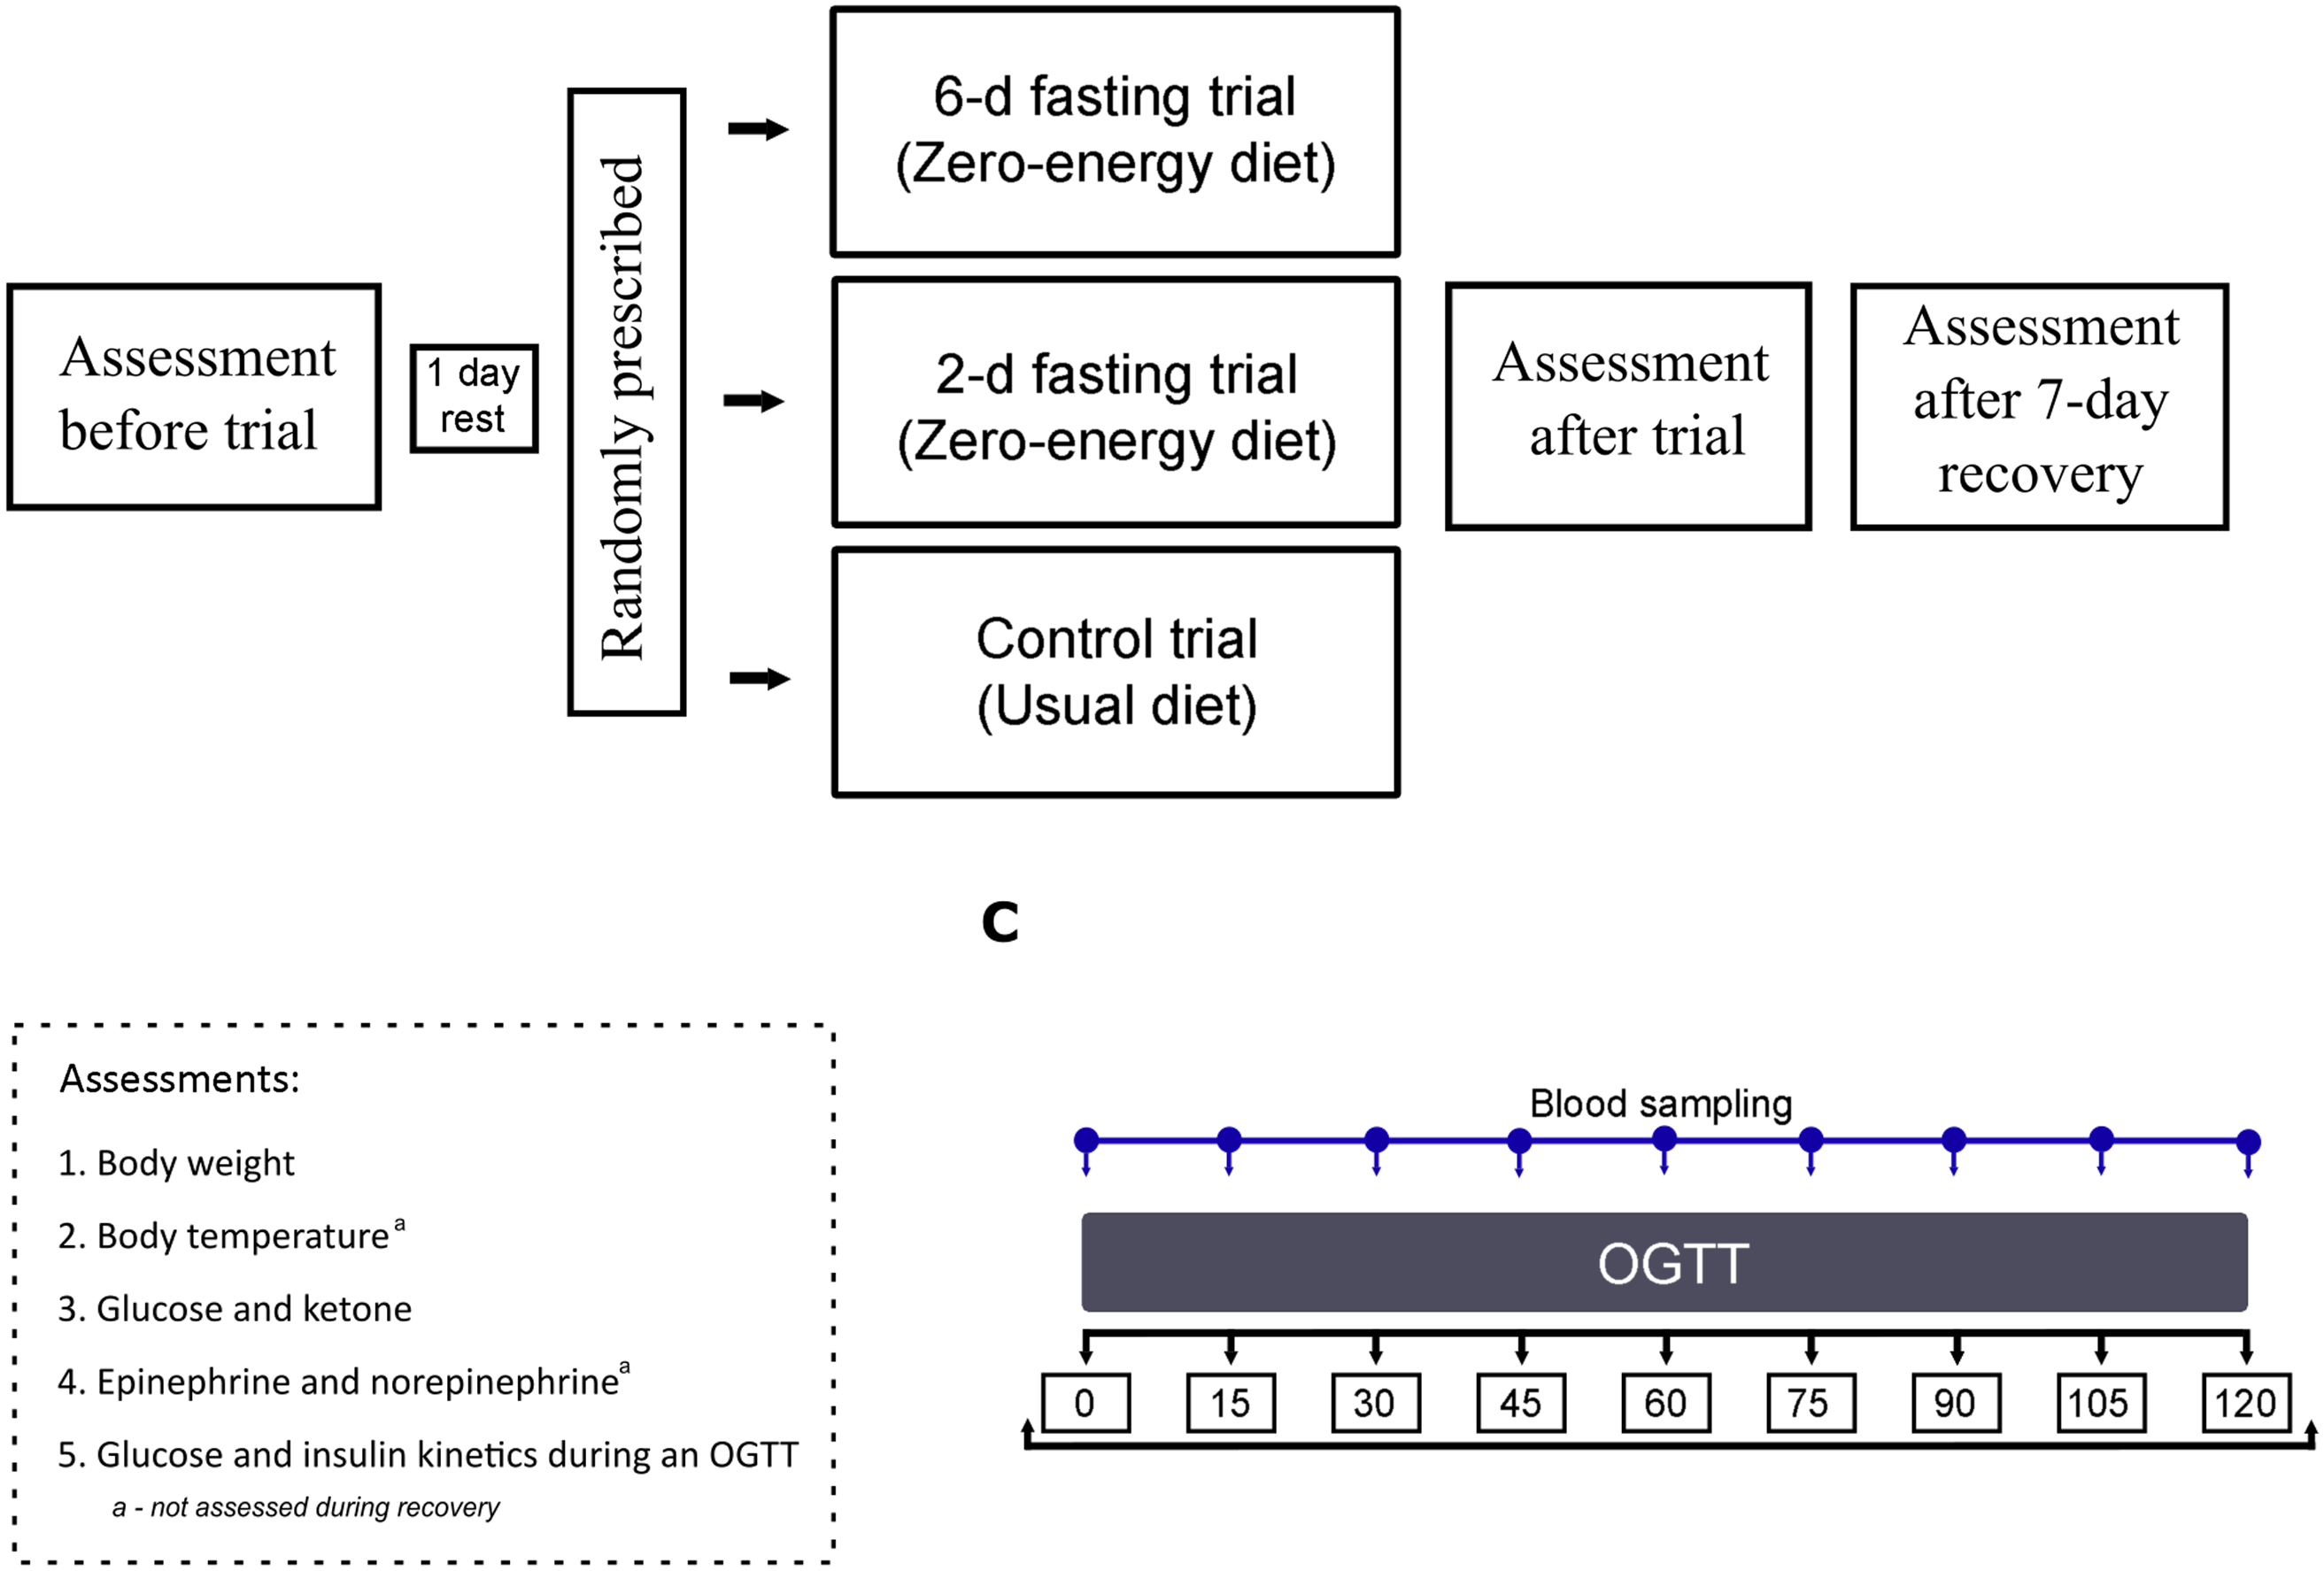
Fig. 2. Schematic representation of the protocol. OGTT, oral glucose tolerance test.
The participant then rested for 1 d before starting one of the randomly prescribed trials: 2-d fast (n 15; age: 27·2 ± 8·8 years; weight: 79·7 ± 11·4 kg; BMI: 24·2 ± 3·2 kg/m2), 6-d fast (n 14; age: 31·0 ± 6·2 years; weight: 84·7 ± 10·0 kg; BMI: 24·7 ± 1·9 kg/m2) or a control trial (n 14; age: 27·4 ± 7·7 years; weight: 77·8 ± 13·2 kg; BMI: 23·7 ± 2·5 kg/m2). For allocation of the participants, blocked randomisation using a computer-generated list of random numbers was prepared by an investigator with no involvement in the study. During the fasting trials, the participants were instructed to follow a prescribed zero-energy diet with water provided ad libitum over a period of 2 or 6 d. During the control trial, the participants were instructed to maintain their previous eating habits for 2 (n 7) or 6 d (n 7). All volunteers were instructed to refrain from physically fatiguing activities.
At the end of each trial, the same measurements obtained at the baseline were repeated. During the recovery period after the fast, participants returned to their normal eating habits, and the same measurements except for catecholamine concentration and body temperature were obtained after 7 d. No participants in the control and experimental trials were lost to follow-up, and the data for all forty-three participants were available for the analyses (Fig. 1).
Anthropometric characteristics
Body weight was measured using a Tanita DC-430U body composition analyser (Tokyo, Japan), and height was measured using a Harpenden anthropometer set (Holtain Ltd, Crymych, Dyfed, Wales, UK) with the participant barefoot and wearing only underwear. BMI was calculated as weight (kg)/height2 (m2). Body weight and BMI were primary outcomes in our study.
Body temperature
TR was measured using a thermocouple (accuracy, ± 0·01°C, Rectal Probe, Ellab, Hvidovre, Denmark) inserted to a depth of 12 cm past the anal sphincter. TS was measured with thermistors (accuracy, ± 0·01°C, Skin/Surface Probe, DM852, Ellab) at three sites: midlines of the anterior surface of the right scapula (back), the anterior surface of the right thigh (thigh) and midline of posterior surface of the right forearm (forearm). The mean TS was calculated using the equation as 0·5back + 0·36thigh + 0·14forearm (Reference Burton25). Body temperature was a primary outcome in our study.
Capillary blood ketone and glucose concentrations
The capillary blood ketone and glucose concentrations were assessed using an Abbott FreeStyle Optium Neo H blood glucose and blood ketone monitoring system (Doncaster, Australia) using blood obtained from a finger-prick sample. Capillary blood ketone and glucose concentrations were secondary outcomes in our study.
Venous glucose, insulin and catecholamine concentrations
The glucose concentration was measured in venous blood samples using a glucose analyser (Glucocard X-mini plus meter; Arkray, Shiga, Japan). Venous blood samples were also used for measurement of insulin and catecholamine concentrations. Blood samples for measurement of serum insulin concentration were collected directly into a 3·5-ml vacutainer tube containing silica clot activator and polymer gel for serum separation (Becton Dickinson, Franklin Lakes, NJ, USA). Blood samples for measurement of plasma catecholamine concentration were collected directly into 3-ml vacutainer tubes containing tripotassium ethylenediaminetetraacetic acid as the anticoagulant (EDTA-K3; Beckton Dickinson). Vacuum tubes containing anticoagulant were gently inverted 8–10 times immediately after blood collection. Serum-separating tubes were allowed to clot for 30–60 min at room temperature, and the tubes were centrifuged at 2000 × g for 15 min at 4°C. After centrifugation, blood samples were transferred into 1·5-ml microtubes (FL Medical, Italy), and the serum microtubes were stored at –20°C and plasma microtubes at –80°C until analysis. Insulin and catecholamine concentrations were measured using enzyme-linked immunosorbent assay kits (Cat. No. KAP1251, DIAsource ImmunoAssays S.A., Nivelles, Belgium; Cat. No. RE59242, IBL International GmbH, Hamburg, Germany, respectively) and a Spark multimode microplate reader (Tecan, Grödig, Austria). Venous glucose, insulin and catecholamine concentrations were primary outcomes in our study.
Serum and plasma samples were analysed in duplicate, and the values were averaged. The intra-assay coefficients of variation (CVs) were 2·81 %, 5·91 % and 4·57 %, and the interassay CVs were 5·21 %, 7·41 % and 5·03 % for insulin, epinephrine and norepinephrine, respectively. The AUC for glucose and insulin concentrations were calculated between 0 and 120 min of the OGTT according to the trapezoidal rule(Reference Matthews, Altman and Campbell26). The OGIS index was calculated from the 2-h OGTT insulin and glucose values using the model-based method proposed by Mari et al.(Reference Mari, Pacini and Murphy21). The researcher who analysed the laboratory venous blood samples was blinded to the experimental conditions.
Statistical analysis
The number of participants was selected based on the calculated sample effect size, following the use of the data involving the first three volunteers who completed the study. At an α value of 0·05 and β (power) value of 80 %, our power analysis indicated that eleven participants in a within-condition comparison would be required to detect a large effect for hypothesised parameters. Furthermore, three participants were added after considering an attrition rate and missing data.
The normality of the results was examined using the Shapiro–Wilk test. Parametric tests were used to analyse data that followed a normal distribution. A two-way mixed-model repeated-measures ANOVA followed with the Bonferroni post hoc test was used to examine the effects of trial (control, 2-d fast and 6-d fast) and time for ≥3 repeated measures (body mass, BMI, capillary glucose and ketone concentrations, OGIS). In case of sphericity violation, the Greenhouse–Geisser estimates were used. A dependent t test for paired samples was used to examine the effect of time for two repeated measures (body temperature), and an independent-samples t test was used to identify differences between trials.
Nonparametric tests were used for data that did not follow a normal distribution. The Friedman test followed by the Wilcoxon signed-rank test with the Bonferroni correction was used to examine the effect of time for ≥ 3 repeated measures (glucose and insulin concentrations during the OGTT, glucose and insulin AUCs). The Wilcoxon signed-rank test with the Bonferroni correction was used to examine the effect of time for two repeated measures (catecholamine concentrations). The Kruskal–Wallis test with the Bonferroni correction was used to compare multiple groups and to examine the effect of trials.
Statistical analyses were performed using IBM SPSS Statistics software (version 28.0.1.0 (142); IBM Corp., Armonk, NY, USA). Statistical significance was set at P < 0·05. The data are presented as the mean and standard deviation.
Results
Anthropometric characteristics
The participants’ anthropometric characteristics are presented in Table 1. The groups did not differ significantly on body weight and BMI at the baseline (before the start of the trials). A significant effect of time (P < 0·001) and significant trial × time interaction (P < 0·001) were observed for anthropometric characteristics. Subsequent analysis showed that both fasting trials decreased body mass and BMI (both P < 0·001). The decreases in body mass and BMI were larger after the 6-d fast (5·30 ± 1·14 kg and 1·54 ± 0·25 kg/m2, respectively) than after the 2-d fast (2·14 ± 0·50 kg and 0·65 ± 0·17 kg/m2, respectively) (both P < 0·001). Body mass and BMI increased at 1 week after return to the usual diet (both P < 0·001) but did not reach the baseline level after the recovery period following the 6-d fast (P < 0·001).
Table 1. The effects of control, 2-d fasting and 6-d fasting trials on anthropometric characteristics
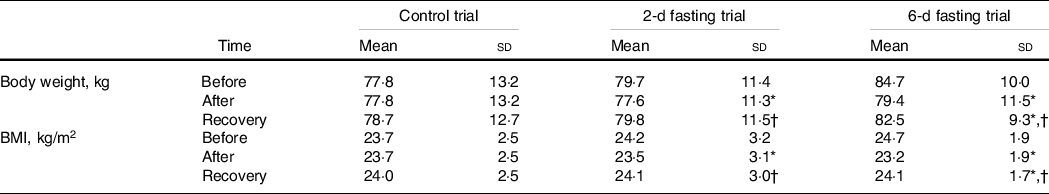
Data shown in mean ± standard deviation.
* P < 0·05, compared with baseline (before trial) values.
† P < 0·05, compared with after trial values. P values were based on a two-way mixed-model repeated-measures analysis of variance followed with the Bonferroni post hoc test.
Body temperature
Rectal and mean skin temperatures did not differ significantly between groups at the baseline. TR increased significantly after the 2-d fast (P = 0·039) (Fig. 3(a)) but showed a nonsignificant trend towards an increase after the 6-d fast (P = 0·078). TS did not differ between groups or from before to after the trials.
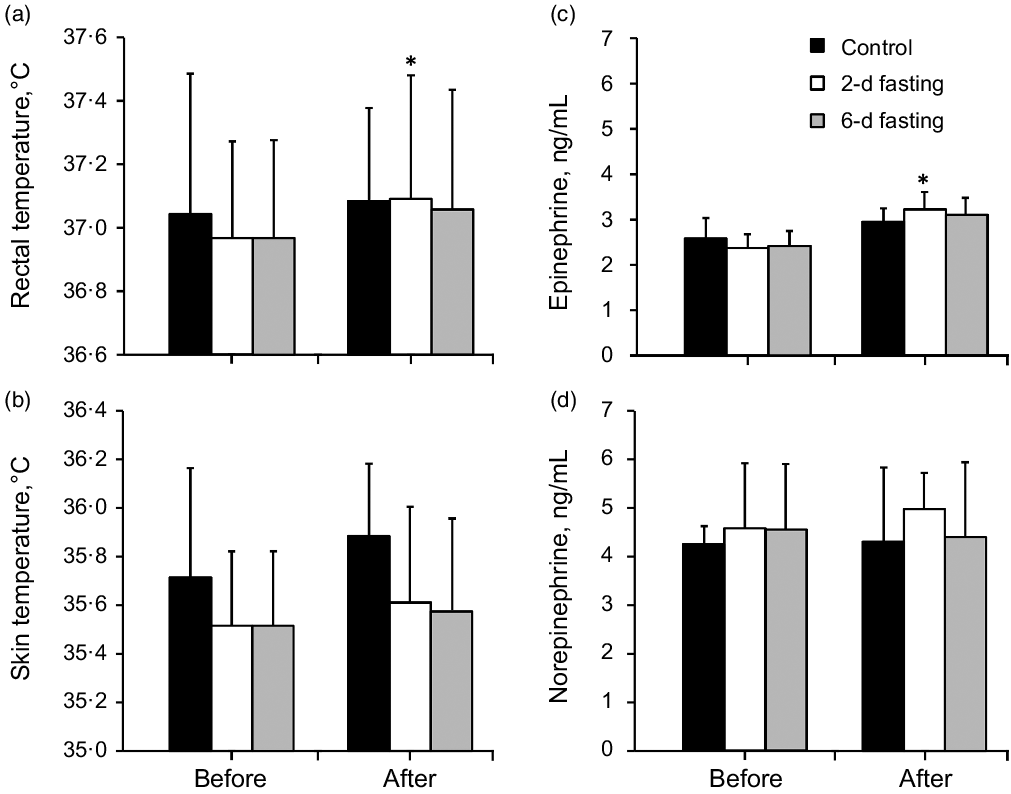
Fig. 3. The effects of control, 2-d fasting and 6-d fasting trials on body temperature and catecholamines concentration. Data shown in mean ± standard deviation. *P < 0·05, compared with baseline (before trial) values. P values were based on the dependent and independent-sample t tests in panels a and b, and P values were based on the Wilcoxon signed-rank and Kruskal–Wallis tests with the Bonferroni corrections in panels c and d.
Stress hormone concentrations
Catecholamine concentrations did not differ significantly between groups at the baseline (Fig. 3(c) and (d)). Neither fasting trial had a significant effect on norepinephrine concentration (P > 0·05). Epinephrine concentration increased only after the 2-d fast (P = 0·011) (Fig. 3(c)) but did not change significantly after the control trial or 6-d fast (P > 0·05).
Capillary glucose and ketone concentrations
Capillary glucose and ketone concentrations are presented in Fig. 4. Glucose and ketone concentrations did not differ significantly between groups at the baseline. Significant effects of time (P < 0·001) and significant trial × time interactions (P < 0·001) were observed for capillary blood glucose and ketone concentrations. Subsequent analysis showed that both fasting trials decreased glucose concentration (P < 0·004) and increased ketone concentration (P < 0·001) and that the effect was larger after the 6-d fast than after the 2-d fast (P < 0·032). During the recovery period, glucose concentration increased (P < 0·007) and ketone concentration decreased (P < 0·001) after both fasting trials and reached the baseline level (P > 0·05).

Fig. 4. The effects of control, 2-d fasting and 6-d fasting on capillary glucose and ketone concentration. Data shown in mean ± standard deviation. *P < 0·05, compared with baseline (before trial) values; #P < 0·05, compared with after trial values; †P < 0·05, compared with control trial; ‡P < 0·05, between fasting trials. p values were based on a two-way mixed-model repeated-measures analysis of variance followed with the Bonferroni post hoc test.
Venous glucose AUC and kinetics during the 2-h oral glucose tolerance test
The changes in venous glucose AUC and kinetics during the 2-h OGTT are presented in Fig. 5. The glucose AUC did not differ between trials (P > 0·05). A significant time effect was observed during the OGTT for all trials (P < 0·001). The glucose concentration increased above the baseline value at 15 min in all trials (P < 0·001) and returned to the pre-OGTT level after 75 min in the control group, after 90 min in the 2-d fast group and after 105 min in the 6-d fast group (P > 0·05).
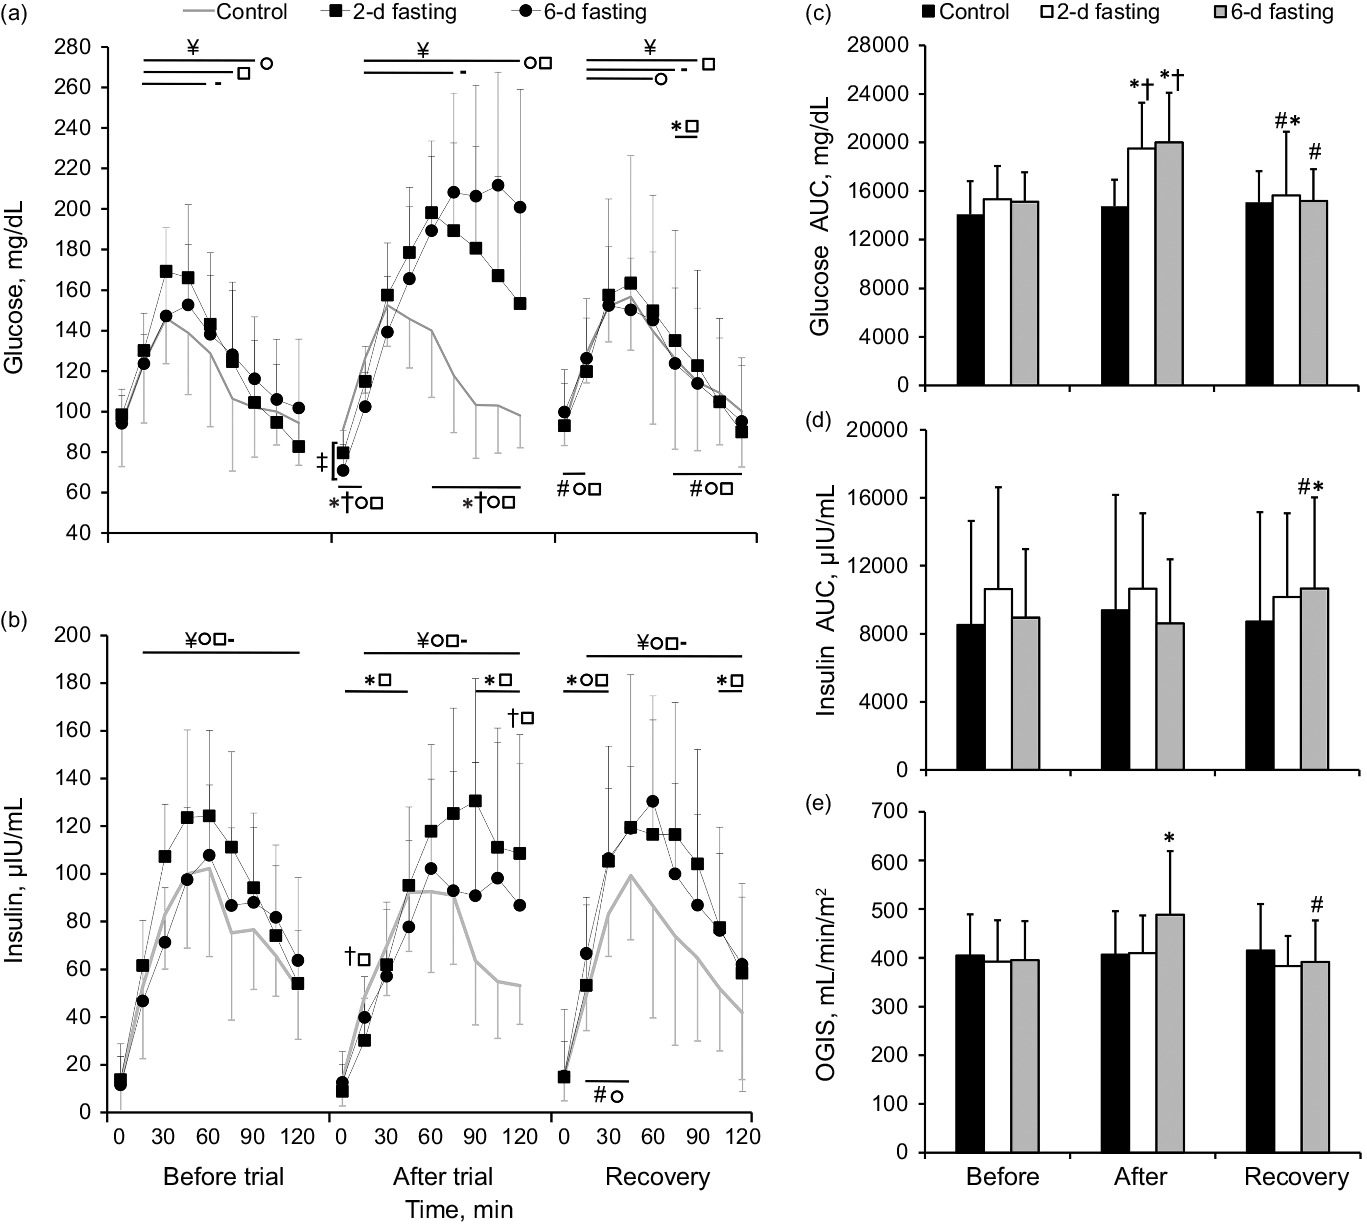
Fig. 5. The effects of control (-), 2-d fasting (□) and 6-d fasting (○) trials on glucose and insulin kinetics, areas under the curves (AUCs) and oral glucose insulin sensitivity (OGIS) during 2-h oral glucose tolerance test (OGTT). Data shown in mean ± standard deviation. *P < 0·05, compared with baseline (before trial) values; #P < 0·05, compared with after trial values; †P < 0·05, compared with control trial; ‡P < 0·05, between fasting trials; ¥P < 0·05, compared with baseline OGTT (0 min) values. P values were based on the Kruskal–Wallis test with the Bonferroni correction and Friedman test followed by the Wilcoxon signed-rank test with the Bonferroni correction.
Both fasting trials increased the glucose AUC above the baseline and control trial values (P < 0·004), but the glucose AUC did not differ between fasting trials (P > 0·05). Detailed analysis revealed higher glucose concentration values before the OGTT (0 min) in the 2-d than in the 6-d fast group (P = 0·05). After all trials during OGTT glucose concentration level increased (P < 0·001) but returned to the baseline value at 90 min only in the control group (P > 0·05). Lower glucose concentration values within the first 15 min (P < 0·001) and higher values within 60–120 min of the OGTT as compared both fasting groups to baseline values and values in the control trial (P < 0·008) were observed.
During the recovery period, the glucose AUC decreased from the value at the end of the trial in both fasting groups (P = 0·011) but remained higher than the baseline AUC in the 2-d fast group (P = 0·049). Detailed analysis revealed higher glucose concentration values at 75–90 min during the OGTT compared with the baseline value (P < 0·020) in the 2-d fast group. Higher values at 0 and 15 min and lower values at 75–120 min as compared both fasting groups to after trial values were observed (P < 0·011). During the recovery period, a significant effect of time was observed during the OGTT for all trials (P < 0·001). Increased glucose concentration level above the pre-OGTT level was observed during the first 75 min of the OGTT in the control group (P < 0·020), during the first 60 min in the 6-d fast group (P < 0·002) and during the first 90 min in the 2-d fast group (P < 0·006).
Venous insulin AUC and kinetics during the 2-h oral glucose tolerance test
The changes in venous insulin AUC and kinetics during the 2-h OGTT are presented in Fig. 5. The insulin AUC did not differ between groups at the baseline (P > 0·05). A significant effect of time on insulin concentration during the OGTT was observed for all trials (P < 0·001), which indicated that the insulin concentration increased throughout the 2-h OGTT (P < 0·001).
The insulin AUC did not change from the baseline value after either fasting trial or after the control trial (P > 0·05). Detailed analysis revealed that the 2-d fast lowered insulin concentration values within the first 45 min of the OGTT (P < 0·022) and that the insulin concentration value was higher at 90–120 min of the OGTT compared with the baseline (P < 0·012). By contrast, no differences were observed in the control and 6-d fast groups (P > 0·05). Similarly, in all trials, the insulin level increased during the OGTT (P < 0·001). The insulin concentration was lower at 15 min (P = 0·017) and higher at 120 min (P = 0·045) of the OGTT in the 2-d fast group compared with the control group, but the insulin AUC did not differ between trials (P > 0·05).
During the recovery period, the insulin AUC increased above the value at the end of the trial only in the 6-d fast group (P = 0·009) and remained higher compared with the baseline value in the 6-d fast group (P = 0·004). Detailed analysis revealed that, compared with the baseline value, the insulin concentration value increased within the first 30 min of the OGTT for both fasting trials (P < 0·022), but decreased within 105–120 min only for the 2-d fast group (P ≤ 0·05). In the 6-d fast group, the insulin concentration was higher within 15–45 min of the OGTT during the recovery period compared with immediately after the trial (P < 0·019).
Insulin sensitivity/resistance
Insulin sensitivity/resistance did not differ significantly between groups at the baseline. A significant effect of time (P = 0·002) and a significant trial × time interaction (P = 0·021) for OGIS were observed. Subsequent analysis showed that the 6-d fast improved insulin sensitivity (P = 0·028), but insulin sensitivity decreased after the usual diet (P = 0·004) and returned to the baseline level (P > 0·05) (Fig. 5(e)).
Discussion
In the present study, we investigated whether fasting duration has any effect on glucose tolerance and insulin sensitivity in healthy young adult males. As expected, compared with short-term fasting, prolonged fasting causes a larger increase in ketone concentration and decreases in glucose concentration. In contrast to our expectations, TR and epinephrine concentration increased only after the 2-d fasting, which suggested greater perceived stress experienced by the participants(Reference Oka27) during the short duration fast compared with the prolonged fast. Similar increases in the glucose AUC response were observed immediately after both types of fast, but only the 6-d fast improved insulin sensitivity. Interestingly, the 2-d fast had a residual negative effect on glucose tolerance (e.g., higher glucose AUC). After the recovery period following the 6-d fast, glucose tolerance returned to the baseline level, which suggests that the prolonged fast evoked an adaptive mechanism, such as greater insulin release, as shown by the higher insulin AUC.
Transient receptor potential vanilloid 1 regulates basal body temperature, and antagonists can cause significant hyperthermia, which is associated with increased norepinephrine concentration in BAT(Reference Alawi, Aubdool and Liang28). Endogenous transient receptor potential vanilloid 1 is degraded under fasting conditions(Reference Ahn, Park and An29). Surprisingly, neither fasting duration had an effect on the norepinephrine response, but TR increased significantly after the 2-d fast. One study found that the 24-h core body temperature during fasting correlated positively with 24-h urinary epinephrine concentration(Reference Vinales, Begaye and Thearle30). Our finding of an increased epinephrine concentration after the 2-d fast but not after the 6-d fast is consistent with this earlier report. An increase in ketone concentration may play a role. Ketones can reduce the appetite sensation(Reference Wilhelmi de Toledo, Grundler and Sirtori31), which should cause lower perceived stress after prolonged fasting. Differences in epinephrine response may also be explained by different metabolic adaptations to prolonged and short-term fasting. During short-term fasting, epinephrine increases more in metabolically ‘spendthrift’ individuals who can maintain higher energy expenditure during fasting compared with those who are metabolically ‘thrifty’(Reference Vinales, Schlögl and Piaggi32).
As reported in previous studies(Reference Anderson and Herman3–Reference Gallen, Macdonald and Mansell5), the rate of glucose utilisation was impaired by both the 2- and 6-d fasts. However, only 2-d fast has led to residual glucose intolerance, as shown by the increased glucose AUC after return to the usual diet. Fasting did not induce the expected fasting-evoked insulin resistance, and, as shown by the OGIS, increased insulin sensitivity immediately after the 6-d fast, which in turn prevented a greater rise in insulin. Intriguingly, when insulin sensitivity returned to baseline, an increased insulin response, as shown by the AUC, was observed only after the recovery period following the 6-d fast, which may indicate elimination of the residual glucose intolerance. A 4-d fast-mimicking diet was reported to promote the reprogramming of mice pancreatic cells to restore insulin generation in islets(Reference Cheng, Villani and Buono33). In that study, increased insulin secretion was observed after refeeding. By contrast, prolonged adrenergic stimulation is the dominant factor in impairment of the pancreatic islet function(Reference Kelly, Camacho and Pendarvis34,Reference Li, Huang and Limesand35) , which may be related to the limited effects on insulin release and glucose intolerance after the 2-d fast.
One important limitation of this study is that we included only healthy males, which limits the ability to generalise the results to the whole population. It would be beneficial to replicate this research in females. In addition, because of the limited time and invasive nature of the hyperinsulinemic euglycemic clamp, which is the gold standard for assessing whole-body insulin sensitivity in vivo (Reference DeFronzo, Tobin and Andres36), we chose to use the OGTT and did not observe fasting-induced insulin resistance directly. Differences in OGTT-derived values for insulin sensitivity should be interpreted with caution because variation in factors other than insulin sensitivity (e.g. alterations in beta-cell sensitivity and glucose absorption without changes in insulin sensitivity) appears to have the greatest effects on indices calculated from the OGTT(Reference Hücking, Watanabe and Stefanovski37).
In conclusion, the 2-d fast had a residual effect by impairing glucose tolerance, and this effect may be linked to greater perceived stress, as shown by the epinephrine response and increase in core temperature during short-term fasting. By contrast, prolonged fasting seemed to evoke an adaptive residual mechanism that may be related to improved insulin release and maintained glucose tolerance. The findings from this study support evidence indicating that prolonged fasting may overcome the effects of short-term fasting on glucose tolerance and insulin release, and suggest that prolonged fasting should be prioritised when implementing periodic or intermittent fasting regimes.
Acknowledgements
We thank all the subjects who have participated in this study. This research received no external funding.
The authors R. S. and M. B. contributed to the study conception and design. The authors R. S., K. Ž. and N. E. performed experiments and contributed to the data analysis and interpretation. R. S. drafted the initial manuscript, and final version of manuscript was critically revised and approved by all authors. All authors agreed to be accountable for all aspects of the work.
There are no conflicts of interest.


