


Introduction
Biodiversity is seriously threatened worldwide by habitat loss and fragmentation brought about by land use/cover change (WWF 2014, Newbold et al. Reference Newbold, Hudson, Hill, Contu, Lysenko, Senior, Börger, Bennett, Choimes, Collen, Day, De Palma, Díaz, Echeverria-Londoño, Edgar, Feldman, Garon, Harrison, Alhusseini, Ingram, Itescu, Kattge, Kemp, Kirkpatrick, Kleyer, Laginha, Martin, Meiri, Novosolov, Pan, Phillips, Purves, Robinson, Simpson, Tuck, Weiher, White, Ewers, Mace, Scharlemann and Purvis2015). Identifying and monitoring priority habitats over time is essential for the effective conservation and management of threatened species (Anderson and Gutzwiller Reference Anderson, Gutzwiller and Bookhout1994). An approach combining satellite remote sensing (SRS) data and species distribution models (SDMs; also called habitat suitability models or ecological niche models; Guisan and Zimmerman 2000, Franklin and Miller Reference Franklin and Miller2009) provides a formidable opportunity to offer repeatable, standardised and verifiable information on long-term monitoring (Pettorelli et al. Reference Pettorelli, Safi and Turner2014). This integrative approach is particularly relevant in dynamic landscapes affected by different global change drivers (Brook et al. Reference Brook, Sodhi and Bradshaw2008, Mantyka-Pringle et al. Reference Mantyka-Pringle, Martin and Rhodes2012). SDMs are increasingly used to predict environmentally induced range shifts in the distribution of wildlife species and their habitats. Consequently, SDMs are valuable tools for supporting conservation decisions (Guisan et al. Reference Guisan, Tingley, Baumgartner, Naujokaitis-Lewis, Sutcliffe, Tulloch and Martin2013, Villero et al. Reference Villero, Pla, Camps, Ruiz-Olmo and Brotons2016). Significant advances have been made in ecological modelling in recent years, and e.g. the use of combination of different modelling algorithms has been successful in adjusting the inherent uncertainty of individual models, thus providing more informative and ecologically correct predictions (Araújo and New Reference Araújo and New2007). However, temporal transferability of SDMs (i.e. our ability to extrapolate species distributions over time) is rarely evaluated (Rapacciuolo et al. Reference Rapacciuolo, Roy, Gillings and Purvis2014), which is essential if there is interest in making inferences beyond the data set used for model fitting (Wenger and Olden, Reference Wenger and Olden2012).
Heathland is one of most threatened habitat types in southern Europe (Habitat type Nat-2000 4030―European dry heaths are listed in Annex I of the Council Directive 92/43/EEC). These ecosystems are key elements of the Iberian landscape as they provide important ecological and socioeconomic services such as conservation of threatened European species, accumulation of organic carbon and climate change mitigation, among others (López-Bao et al. Reference López-Bao, Sazatornil, Llaneza and Rodríguez2013, Morán-Ordóñez 2013, Rodríguez-Lado and Martínez-Cortizas 2015). However, over the last three decades, these ecosystems in the north-western Iberian Peninsula have been degraded and transformed into cropland and pastures or have been afforested with extensive monospecific plantations of fast-growing tree species (e.g. Eucalyptus spp. and Pinus spp.) (Calviño-Cancela et al. Reference Calviño-Cancela, Rubido-Bará and Van Etten2012, Morán-Ordóñez et al. Reference Morán-Ordóñez, Suárez-Seoane, Elith, Calvo and de Luis2012, 2013, Ramil-Rego et al. Reference Ramil-Rego, Rodríguez-Guitián, López Castro, Ferreiro da Costa and Muñoz Sobrino2013). In the context of ongoing land use change, the loss and fragmentation of heathlands may lead to difficult-to-reverse tipping points for species tightly linked to these habitats (Regos et al. Reference Regos, D’Amen, Herrando, Guisan and Brotons2015, Reference Regos, Domínguez, Gil-Tena, Brotons, Ninyerola and Pons2016, Brambilla et al. Reference Brambilla, Gustin, Vitulano, Negri, Bogliani, Falco and Celada2017, Tapia et al. Reference Tapia, Regos, Gil-Carrera and Domínguez2017).
For instance, Montagu´s Harrier Circus pygargus has sharply declined in recent years in Europe (BirdLife International 2004, PECBMS 2011), including different parts of the Iberian Peninsula (SEO/Birdlife 2014, Pinilla Reference Pinilla2015). In Galicia (NW Spain), the population of this migratory raptor is considered ‘vulnerable’, and a decrease in the population of around 50% has been estimated along with a decrease from 500–700 to 280–390 breeding pairs in the last decade (Tapia et al. Reference Tapia, Gil-Carrera and Vázquez-Pumariño2015, Reference Tapia, Regos, Gil-Carrera and Domínguez2017, Vázquez-Pumariño Reference Vázquez-Pumariño2016). This population presents a high percentage of melanism (up to 50%) and usually breeds in heathlands and semi-natural areas (Tapia et al. Reference Tapia, Domínguez and Rodríguez2004, Vázquez-Pumariño Reference Vázquez-Pumariño2014). Thus, one of the main threats to the species is the destruction of these habitats for forest management purposes and abandonment of traditional land management practices (Tapia et al. Reference Tapia, Domínguez and Rodríguez2004, Reference Tapia, Gil-Carrera and Vázquez-Pumariño2015, Reference Tapia, Regos, Gil-Carrera and Domínguez2017). In the case of the Common Kestrel Falco tinnunculus, the available data indicate a decline in breeding and wintering populations in Spain as well as in the rest of Europe (SEO/Birdlife 2010, 2014, PECBMS 2011). The decline in numbers of both species appears to be linked to human activities, direct persecution and habitat loss due to the effects of agricultural intensification and forest management (Martínez Padilla 2003, Laiolo et al. Reference Laiolo, Dondero, Ciliento and Rolando2004, Tapia et al. Reference Tapia, Regos, Gil-Carrera and Domínguez2017).
The aim of this study was to assess the temporal transferability of species distribution models (SDMs) and their potential implications for bird conservation. In particular, we quantified the habitat loss and fragmentation of Montagu´s Harrier and Common Kestrel over the last 13 years (2001–2014) in a highly dynamic landscape in NW Spain. For this purpose, priority habitats for the target species were modelled and mapped from remotely-sensed land use/cover (LUCC) information by using 10 widely used single-modelling algorithms, which provided an ensemble of predictions at different spatial scales. To explore the temporal transferability of our ensemble models, they were also back-projected (hereafter ‘backcasting’) to the land cover conditions in 2000 and tested against historical occurrence data. Ensemble models calibrated with historical data were also projected to the land cover conditions in 2014 (hereafter ‘hindcasting’) and evaluated using updated occurrence data. Changes in the availability and connectivity of suitable habitats for these raptor species between 2001 and 2014 was estimated at four spatial scales using a set of widely-used indicators. We expected important changes in the avaliability and connectivity of suitable habitats for these raptor species due to major land use change that has occurred over the last 13 years (see Tapia et al. 2017). These changes could also alter species-habitat relationships, raising concerns about our ability to provide future habitat projections, especially in unstable, highly-perturbed systems. If so, we could also expect that our subsequent estimates of the impact on land-use change on these raptor species could be strongly influenced by the scale of analysis and the model transferability. Finally, we propose management guidelines to ensure the effective management and conservation of these species and their habitats.
Methods
Study area
The province of Ourense (c.7,281 km2) is located in the south-east of Galicia (NW Spain) (Figure 1). The climate is transitional between Atlantic and Mediterranean (Rodríguez-Guitian and Ramil-Rego 2007). Average annual rainfall ranges between 700 and 2,000 mm, and annual mean temperature between 6.3 and 14.5°C (Rodríguez-Lado et al. 2016). Elevations are higher (up to 2,071 m a.s.l.) in the east and lower (29 m) in the river valleys. Forested areas cover over 70% of the study region, while agricultural areas (arable land and meadows) represent less than 8% (for a more detailed description of land-cover composition, see below). Extensive traditional agropastoral systems have been preserved, although they have gradually been abandoned since the middle of the last century and have been recolonised by native oak forests and pine plantations. The study area is relatively sparsely populated (44 inhabitants/km2), with fewer than 10 inhabitants/km2 in some remote mountain areas. Human-caused fires expose the study area to an unusually high frequency of wildfires, even though the climatic conditions do not generally favour wildfire occurrence (Vazquez de la Cueva et al. Reference Vazquez de la Cueva, García del Barrio, Ortega Quero and Sánchez2006, Chas-Amil et al. Reference Chas-Amil, Touza and Prestemon2010). A total of 264 wildfires larger than 100 ha occurred between 2001 and 2013 (MAGRAMA 2014).
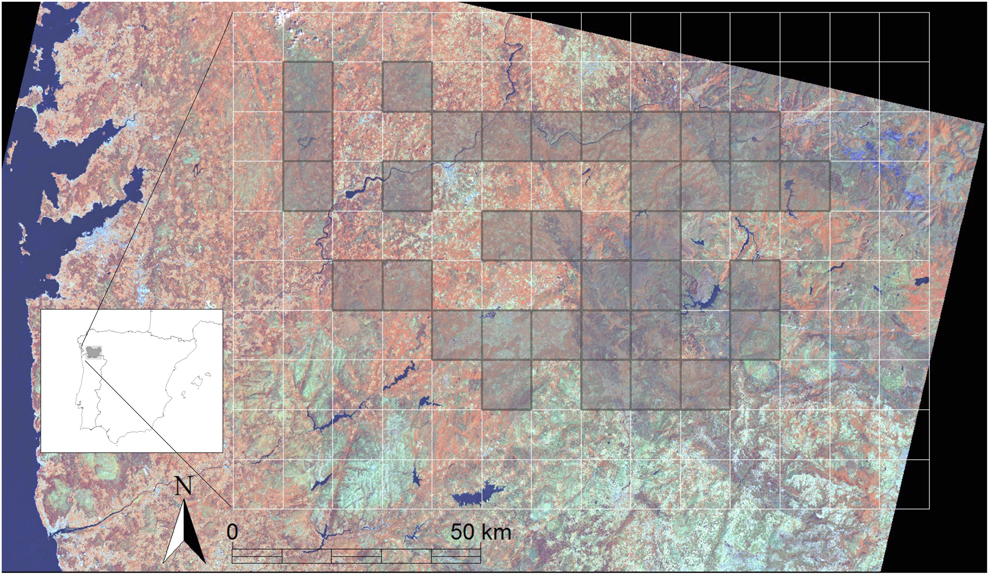
Figure 1. Satellite image of the study area (Province of Ourense, Southeast Galicia, Northwestern Iberian Peninsula). The sampled 10 x 10 km grid cells are shown in dark shading.
Field surveys and target species
Diurnal raptors were sampled during the 2001 breeding season from 15 May to 6 August to ensure the detectability of resident and late migratory species (for more details see Tapia et al. 2017). The same survey was replicated in 2014 following the same timing as in the 2001 census, to minimise any phenological bias. The sampling unit was a 10-km UTM grid. Cells with more than 50% of the area outside the province were excluded. Finally, from a total of 66 possible cells, 34 were selected at random (51.5% of the area of the province), thus ensuring all ecosystems and land cover types were well represented (Figure 1). In each cell, a 40-km transect was monitored from a 4 x 4 vehicle travelling at a speed of 30–40 km/h (Andersen Reference Andersen, Bird and Bildstein2007). A total distance of 1,360 km was covered (140 h of observation, always between 2 h after sunrise and two h before sunset). Two experts in raptor identification carried out the censuses in both years. From the initial dataset, we exclusively focused on two open-habitat specialist species whose populations have declined during the last few decades in the study region (Tapia et al. 2017): Montagu´s Harrier (N2001 = 53; N2014 = 29) and Common Kestrel (N2001 = 42; N2014 = 35) both associated with shrubland, heathland and traditional agropastoral landscapes (Tapia et al. 2004, Reference Tapia, Domínguez and Rodríguez2008). A minimum of five occurrence records per predictor was considered suitable for fitting SDMs (Pearson et al. Reference Pearson, Raxworthy, Nakamura and Townsend2007, Thuiller et al. Reference Thuiller, Pironon, Psomas, Barbet-Massin, Jiguet, Lavergne, Pearman, Renaud, Zupan and Zimmermann2014). During the field sampling, we did not detect any behavioural interactions between the two raptor species that could have influenced the results obtained. Occurrences of the raptor species were not spatially autocorrelated (mean Moran’s Index = 0.04, range = 0.015–0.114; P-values > 0.1; tested using the ‘ape’ package in R), and they can therefore be considered statistically independent of each other.
Remotely-sensed environmental data
We used the land use/cover (LUCC) maps derived from a previous work (Tapia et al. 2017) based on satellite remote sensing data (SRS). In particular, the main SRS data source consisted of optical multispectral bands (30 m resolution) of four Landsat images acquired on dates close to the raptor survey from Landsat 7 Enhanced Thematic Mapper plus (ETM +) (20 March 2000 and 24 June 2000) and Landsat 8 Operational Land Imager (OLI) sensors (19 March 2014 and 9 July 2014). Landsat scenes captured during spring and summer (e.g. images from March and July) were considered to enhance seasonal discrepancies in the phenology of deciduous species. Cloud-free Landsat images were not available for either spring or summer of 2001, and images for 2000 were finally selected. The Landsat data-derived maps for 2000 and 2014 were generated using the maximum likelihood algorithm (Richards and Jia Reference Richards and Jia2006, Campbell Reference Campbell2008), with overall accuracy of 97.70% and 94.89% respectively (Kappa coefficients of 0.97 and 0.93; for details see Tapia et al. 2017).
Model fitting and evaluation
To quantify changes in habitat suitability for the target raptor species between 2001 and 2014 at local and broader scales, we first constructed SDMs. These models allowed us to empirically correlate occurrence data and the LUCC data at four different scales. The occurrence data comprised all presence records collected during the specific surveys in 2001 and 2014 within each 10-km square. For each species, pseudo-absences were recorded within the presence points of the other species detected during the surveys. As the bias in the sampling design is the same for all species, better results can be obtained by selecting pseudo-absences with this method (also called ’target-group background’, see Phillips et al. 2009, Barbet-Massin et al. Reference Barbet-Massin, Jiguet, Albert and Thuiller2012) than by using randomly sampled background. The LUCC-type data comprised the proportion (%) of area occupied by each LUCC class: (1) deciduous forest, dominated by native oaks Quercus robur and Q. pyrenaica, which constitute the climax vegetation in the region), chestnut Castanea sativa groves and riparian forest (Betula sp.); (2) coniferous forest, dominated by pine Pinus sylvestris and P. pinaster plantations; (3) closed shrubland, shrubland and heathland ecosystems covered by more than 50% of shrub species (Cytisus sp., Ulex sp. and Erica sp.); (4) open shrubland, rocky soil covered by less than 50% of shrub species, including sparse vegetation areas resulting from fire events and forest clearings (clear-cuttings); (5) meadows and fallow land; (6) arable or farm land (being or capable of being tilled for crop production). These proportions were calculated within radii of 500-m, 1-km, 2-km and 5-km of each individual sighting by using the R package ‘raster’.
All SDMs were constructed using 10 widely-used modelling algorithms available in BIOMOD2 (R package ‘Biomod2’) with the default settings (Thuiller et al. 2009): generalized linear models (GLM), generalized additive models (GAM), generalized boosted models (GBM; also known as Booted Regressions Tress, BRT), flexible discriminant analysis (FDA), classification tree analysis (CTA), multivariate adaptive regression splines (MARS), surface range envelope (SRE; also known as BIOCLIM), maximum entropy (MaxEnt), random forest (RF), and artificial neural networks (ANN) (Thuiller et al. 2009). The original raptor dataset was split into two subsets: 70% of the data was used for model training and the remaining 30% for performance testing. We randomly repeated this procedure 30 times to produce predictions independent of the training data (Fielding and Bell Reference Fielding and Bell1997). We applied a weighted averaging approach to compute a consensus of single-model projections by using the area under the curve (AUC) of the receiver-operating characteristic (ROC) as model weights (Araújo and New Reference Araújo and New2007, Marmion et al. 2009). Only models with AUC values above 0.7 were used in the ensemble procedure. The entire procedure was repeated for each species, resolution and year (total of 2,400 single models for each species). The ensemble models were directly projected at 500-m resolution (Araújo et al. Reference Araujo, Pearson, Thuiller and Erhard2005, Guisan et al. 2007). We calculated four different evaluation indices: AUC (Fielding and Bell Reference Fielding and Bell1997), true skill statistic (TSS) (Allouche et al. Reference Allouche, Tsoar and Kadmon2006), Cohen’s kappa coefficient (Cohen Reference Cohen1960), and Boyce’s Index (Boyce et al. Reference Boyce, Vernier, Nielsen and Schmiegelow2002).
Model transferability
To explore our ability to extrapolate habitat suitability predictions in time (i.e. temporal transferability), the models for both species were also back-projected to past land cover conditions in 2000 and evaluated using historical occurrence data, i.e. from 2001. In addition, models calibrated with historical data were projected to the land cover conditions in 2014 and evaluated using updated occurrence data, i.e. from 2014. We calculated different measures of accuracy: AUC, sensitivity (i.e. the percentage of presence correctly predicted), specificity (i.e. the percentage of absence correctly predicted) (Fielding and Bell Reference Fielding and Bell1997), and Boyce’s index (Boyce et al. 2002). Accuracy measures were calculated and compared by using the R packages ‘PresenceAbsence’ (Freeman and Moisen Reference Freeman and Moisen2008) and ‘ecospat’ (Di Cola et al. Reference Di Cola, Broennimann, Petitpierre, Breiner, D’Amen, Randin, Engler, Pottier, Pio, Dubuis, Pellissier, Mateo, Hordijk, Salamin and Guisan2016). All graphs were constructed with the R package ‘ggplot2’.
Habitat change and fragmentation
Raw probabilities were converted into binary data to identify habitats with high suitability (henceforth ‘HSH’) for each species, as described in Tapia et al. (2017). We then estimated the habitat loss and fragmentation of HSH for each species, scale of analysis and model projection (including temporal projections, ‘backcasting’ and ‘hindcasting’), from a set of widely-used fragmentation indicators, available in the R package ‘SDMTools’ (Schumaker Reference Schumaker1996, Allen and Connor Reference Allen and O’Connor2000):
(1) ‘Number of patches’ of HSH.
(2) ‘Mean patch area’, i.e. the average area of patches (in ha).
(3) ‘Max patch area’, i.e. the maximum patch area of the total patch areas (in ha).
(4) ‘Total area’, the sum of the areas (ha) of all patches of HSH.
(5) ‘Patch cohesion index’, proposed by Schumaker (Reference Schumaker1996) to quantify the connectivity of habitat as perceived by organisms dispersing in binary landscapes. Patch cohesion is computed from the information contained in the patch area and perimeter. Briefly, it is proportional to the area-weighted mean perimeter-area ratio divided by the area-weighted mean patch shape index (i.e. standardised perimeter-area ratio). Fragmentation indicators are calculated for the sets of patches of HSH for Montagu’s Harrier and Common Kestrel for the years 2001 and 2014.
Finally, changes between year 2001 and 2014 were calculated for each metric from: 1) projections within model calibration time period (‘2001–2014’); and 2) from temporal projections, i.e. ‘backcasting’ (2014 → 2001) and ‘hindcasting’ (2001 → 2014).
Results
Model performance and transferability
Although our SDMs showed a good predictive accurracy, the different evaluation indices indicated different predictive power depending on the spatial scale (Figure 2). On the one hand, metric scores obtained for 2001 for Montagu’s Harrier were consistenly higher at the scale of 1 km across the different evaluation metrics. However, for Common Kestrel, the habitat models with highest predictive ability were computed at the 5-km scale. On the other hand, the highest evaluation values for both species were obtained for 2014 at the 500-m scale, with very low accuracy values at 2- and 5-km scales, according to the Boyce’s index. For this reason, and given the potential risk of pseudoreplication of land cover data because of the overlap between radii at large scales, the 500-m scale was considered the most consistent one over both years for both species (Figure 2).
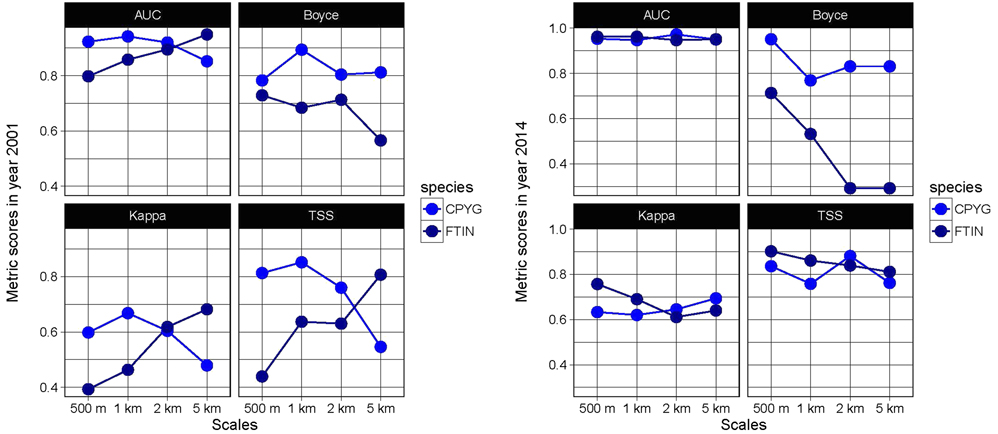
Figure 2. Mean evaluation metric scores for Montagu´s Harrier (CPYG) and Common Kestrel (FTIN) in the study area, for each scale and year. The following evaluation indices were calculated: Area Under the ROC Curve (AUC), True Skill Statistic (TSS), Cohen’s Kappa coefficient (Kappa), and Boyce’s index.
In addition, the projections obtained from backcasting and hindcasting procedures showed low levels of accuracy (see Figure 3 and 4), except for hindcasting projections for Montagu’s Harrier at the 500-m scale (AUC values > 0.7 and Boyce’s index > 0.4, Figure 3). The limited temporal transferability of the models is probably caused by changes in the species-habitat relationships between 2001 and 2014 (see variable importance in Appendix S1, and response curves in Appendix S2 in the online supplementary material). Consequently, only projections within model calibration time period (‘2001-2014’, i.e. using occurrence and land cover data from the same year), and at the 500-m scale, were considered realiable.
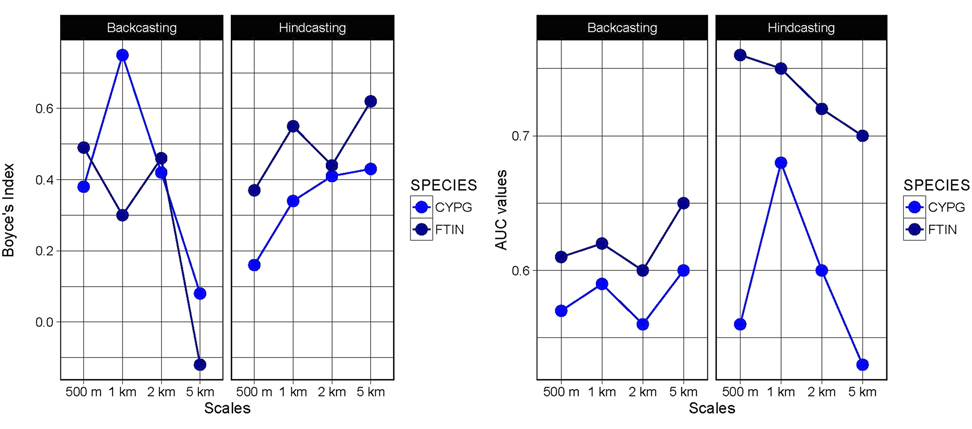
Figure 3. Boyce’s index and Area under the ROC curve (AUC) values for the projections obtained from backcasting and hindcasting procedures for Montagu´s Harrier (CPYG) and Common Kestrel (FTIN).
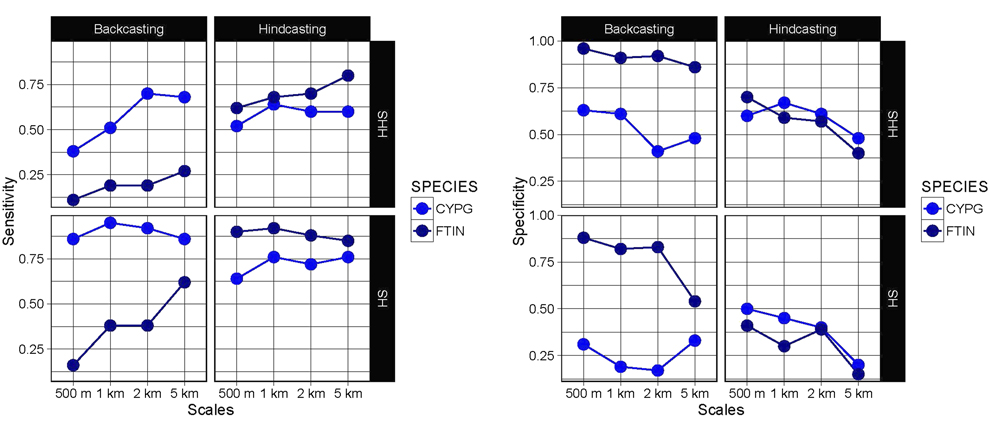
Figure 4. Sensitivity (i.e. the percentage of presence correctly predicted) and specificity (i.e. the percentage of absence correctly predicted) projections of suitable habitat (SH) and high suitable habitat (HHS) obtained from backcasting and hindcasting procedures for Montagu´s Harrier (CPYG) and Common Kestrel (FTIN).
Habitat loss and fragmentation
The avaliability of suitable habitats decreased greatly between 2001 and 2014 for Montagu’s Harrier and Common Kestrel (-33.4 and -47.7% for HSH, respectively), according to projections within model calibration time period at the scale of 500 m, i.e. the most consistent scale; see Figures 5 and 6). The number of patches per 1,000 ha with HSH for Montagu’s Harrier and Common Kestrel increased during this period from 3.46 and 2.11 to respectively 5.46 and 5.13 (Figure 5). Mean patch size decreased during this period from 288.9 ha and 474.08 ha, to 183.05 ha and 195.05 ha respectively. The maximum size decreased from 28,220 ha and 60,707 ha, to respectively 11,418 ha and 20,521 ha (Figure 5). The patch cohesion index decreased slightly, from 9.45 and 9.62 to respectively 8.97 and 9.36 (Figure 5). All computed values are indicative of an increasing degree of fragmentation of HSH for both raptor species due to large loss of habitat during the last 13 years in the study area.
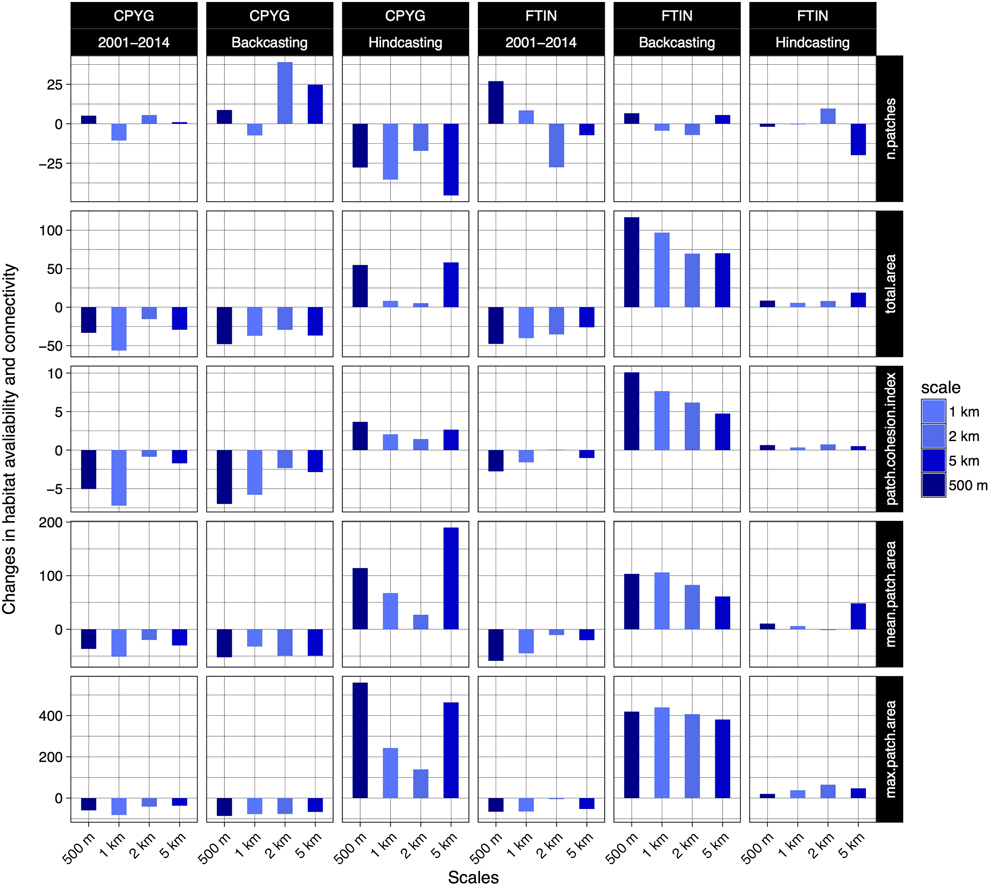
Figure 5. Changes in habitat availability and connectivity between year 2001 and 2014 (in %) estimated from projections within model calibration time period (2001–2014, and from temporal projections: ‘backcasting’ (2014–2001) and ‘hindcasting’ (2001–2014). Abbreviations: ‘n.patches’, the number of patches of highly suitable habitats; ‘total.area’, the sum of the areas (ha) of all patches of the highly suitable habitats; ‘mean.patch.area’, average area of patches; ‘max.patch.area, the maximum patch area of the total patch areas; ‘patch.cohesion.index’, proposed by Schumaker (Reference Schumaker1996) to quantify the connectivity of habitat as perceived by organisms dispersing in binary landscapes.
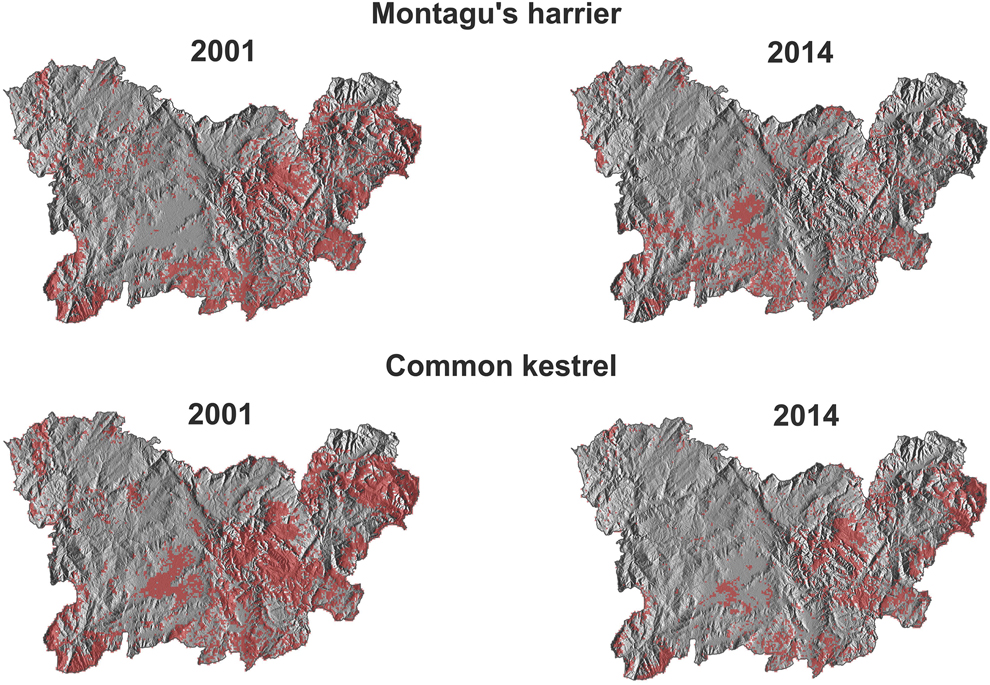
Figure 6. Habitat suitability maps (highly suitable habitat) for Montagu´s Harrier and Common Kestrel in the study area in 2001 and 2014 obtained from models calibrated at 500-m scale and within the calibration time period.
However, the change in habitat availability and connectivity estimated from the temporal projections was found to be strongly dependent on the the scale of analysis and model transferability. Thus, for Montagu’s Harrier, the change in habitat availability and connectivity ranged from -48% (-52% in mean patch size) to +54% (+114% in mean patch size) at the 500-m scale (Figure 5). For Common Kestrel, the change ranged from +116% (103% in mean patch size) from backcasting projections at the 500-m scale to +5.6% (6% in mean patch size) from hindcasting projections at the 1-km scale (Figure 5).
Discussion
Model performance and transferability
The study findings confirm that the combined use of satellite remote sensing data and species distribution modelling techniques is a powerful approach for effective and efficient modelling and mapping of the distribution patterns of key species. This multiscale approach enabled us to account for the availability of suitable habitat for our focal species at local and broad scales and to identify the best modelling approach for the subsequent fragmentation analysis (Figure 2). However, the limited temporal transferability of the models raises concerns about our ability to predict future land-use impacts on species’ habitats (Figures 3 and 4), with strong implications for future management recommendations (Figure 5). These findings are not surprising, as validation based on temporally and spatially independent data often result in more realistic (and lower) estimates of model performance, as already found for birds, plants, and butterflies (Araujo et al. 2005, Randin et al. 2006, Kharouba et al. 2009, Dobrowski et al. Reference Dobrowski, Thorne, Greenberg, Safford, Mynsberge, Crimmins and Swanson2011, Eskildsen et al. Reference Eskildsen, Roux, Heikkinen, Høye, Kissling, Pöyry and Luoto2013). The lack of model transferability is intrinsically related to the static nature of purely statistical correlative models such as SDMs, and their underlying assumptions on environmental equilibrium and niche equality across species’ distributions (Guisan and Zimmerman 2000). In our particular case study, the lack of model transferability could have been caused by: 1) model overfitting, i.e. accepting a predictor variable that is nominally correlated with the response variable in the dataset, but which does not represent a relationship that holds generally (Wenger and Olden Reference Wenger and Olden2012); 2) species-habitat relationships not stable through time (Strauss and Biedermann Reference Strauss and Biedermann2007; see response curves in Appendix S2). For instance, the presence of Montagu’s Harrier was found to be strongly correlated with open shrubland in year 2001; however, this species-habitat relationship changed in year 2014 in favour of closed shrubland and agricultural land (see variable importance in Appendix S1). This can be attributed to habitat loss and fragmentation as the new open scrublands are derived from previous coniferous forests and closed shrublands (due to clear-cutting, ploughing and wildfires; Tapia et al. 2017), which are not suitable in terms of habitat quality for this species. 3) Changes in patterns of collinearity between predictors between 2001 and 2014 (Dormann et al. Reference Dormann, Elith, Bacher, Buchmann, Carl, Carré and Münkemüller2013; around 0.1-0.2 of Pearson coefficients, see correlation matrices in Appendix S3). Temporal transferability assessements should therefore provide a highly robust method of identifying relationships with predictor variables that are truly general, thus greatly reducing the risk of overfitting and increasing model utility (Wenger and Olden Reference Wenger and Olden2012). In light of these results, specific, long-standing monitoring protocols remain essential to ensure accurate modelling performance and reliable future projections. This is especially important for raptor species, often characterised by low population sizes and large home ranges, which are prone to being exposed to unstable, highly dynamic conditions in terms of habitat avaliability.
Habitat loss and fragmentation
Our estimates about the impact of land-use change on habitat availability and connectivity for both Montagu’s Harrier and Common Kestrel were found to be strongly dependent on the scale of analysis and model transferability (Figure 5). The resuls showed incongruent patterns between the analysis derived from projections within model calibration time period and temporal projections (i.e. ‘backcasting’ and ‘hindcasting’) (Figure 5). This highlights the need for caution when using SDMs beyond the model calibration period to guide bird conservation since a high discriminative power in the calibration procedure does not ensure a model’s ability to predict future land-use change impacts on bird distribution (Figure 4). In our particular case, the lack of model transferability could have led to erroneous management recommendations for our target species (Figure 5).
Our results suggest a strong reduction in the availability and connectivity of optimal habitats that confined Montagu’s Harrier to the remaining mature heath and shrub formations or forced them to occupy non-natural, open habitats such as agricultural land (Figure S1 in Appendix S1). These findings are consistent with those reporting strong population decline at Iberian and European scales (PECBMS 2011, SEO/Birdlife 2014, Pinilla Reference Pinilla2015, Wiącek Reference Wiącek2015), as well as for other threatened raptor species and top predators associated with these European priority habitats (Rodríguez-Lado and Tapia Reference Rodríguez-Lado and Tapia2012, López-Bao et al. 2013). Destruction and fragmentation of montane heath and shrub formations by unsustainable forestry policies (e.g. intensive operations such as ploughing, planting fast-growing tree forest species and clear-cutting), together with the gradual abandonment of traditional land management practices (e.g. extensive livestock grazing, cutting and burning management), may account for the habitat degradation, as previously reported in other study areas (Ramil-Rego et al. 2013, Uezu and Metzger Reference Uezu and Metzger2016). Major impacts in the study area include afforestation and intensification of pastureland (Tapia et al. 2017), both of which are systematically financed by agri-environmental funds from the European Union (EU). Rather than promoting biodiversity, these policies have provoked serious damage to this habitat of community interest, which contrast completely with the objectives of the EU Nature Directives (Birds and Habitats Directives).
Management recommendations
In the study area, a large farmland area (“A Limia”; c.6,939 ha) was declared a Special Protection Area for Birds (SPA) in 2009 under the Birds Directive. This farmland area currently preserves suitable habitat for both species, especially for Montagu´s Harrier. In human-dominated habitats, such as European farmland, several conservation strategies were encompassed within reactive approaches based on financial incentives or active conservation habitat management (Aebischer et al. Reference Aebischer, Green, Evans, Aebischer, Evans, Grice and Vickery2000, Dicks et al. Reference Dicks, Ashpole, Dänhardt, James, Jönsson, Randall, Showler, Smith, Turpie, Williams and Sutherland2013, Santana et al. 2014). The areas can become ‘conservation traps’ when the application of biologically focused actions in response to conservation problems results in an unsustainable need to perpetuate implementation of these actions (see Santana et al. 2014, Cardador et al. Reference Cardador, Brotóns, Mougeot, Giralt, Bota, Pomarol and Arroyo2015, Torres-Orozco et al. 2016). Montagu’s Harrier, which mainly breeds in farmland across Western Europe, has declined in many areas due to intensification of farming, which can lead to decreased habitat quality and food resources, but also to an important increase in the mortality of chicks due to harvesting operations during the breeding season (Arroyo et al. Reference Arroyo, Bretagnolle, Garcia, Thompson, Redpath, Fielding, Marquiss and Galbraith2003, Santangeli et al. 2014). However, the species is still strongly associated with natural and semi-natural habitats (i.e. mature heath and scrub formations) in the study region, thus providing land managers an opportunity to act proactively to avoid difficult-to-reverse tipping points being reached in these habitats. The observed decline in the availability of suitable habitat for Montagu’s Harrier during the last 13 years is clearly threatening the sustainability of its population in the near future. Implementation of proactive conservation measures in these semi-natural habitats is therefore essential, before they become completely degraded or lost. Conservation policies that rely exclusively on agricultural activities or European subsidies should be avoided. Therefore, we recommend implementing the most cost-effective options that would eventually become financially sustainable, in order to reduce the species dependence on active management in the medium and long term. In particular, management practices should aim to increase 1) the effective protection of montane heath and shrub formations by preventing unsustainable forestry activities (intensive operations such as ploughing, planting fast-growing tree forest species and clear-cutting); and 2) connectivity of the remaining optimal habitats for the species by restoring their historical breeding areas.
Conclusions
The study findings confirm that the combined use of satellite remote sensing data and species distribution modelling techniques is a powerful approach for modelling and mapping of the distribution patterns of key species. However, a lack of model transferability raises concerns about our ability to provide future habitat projections, with strong implications for future management recommendations. Indeed, our estimates about the impact of land-use change on habitat availability and connectivity for both Montagu’s Harrier and Common Kestrel were found to be strongly dependent on the scale of analysis and model transferability. The resuls showed incongruent patterns between the analysis derived from projections within model calibration time period and temporal projections (i.e. ‘backcasting’ and ‘hindcasting’). This highlights the need for caution when using SDMs to guide bird conservation since a high discriminative power within the model calibration period does not ensure a model’s ability to predict the future land-use change impacts on bird distribution. From a purely conservation viewpoint, our results suggest a strong reduction in the availability and connectivity of optimal habitats that confined Montagu’s Harrier and Common Kestrel to the remaining mature heath and shrub formations or forced them to occupy non-natural, open habitats such as agricultural land. The implementation of conservation plans and proactive conservation measures will therefore be essential for effective protection of heathlands and the connectivity of the remaining optimal habitats for the species.
Supplementary Material
To view supplementary material for this article, please visit https://doi.org/10.1017/S0959270917000375
Acknowledgements
The study was partly funded by the Consellería de Medio Ambiente and project PGIDTO1MAM2001PR (Xunta de Galicia). Luis Tapia was supported by a Post-Doctoral Grant from the Galician Government (Plan Galego de Investigación, Innovación e Crecemento 2011-2015, Plan I2C, Xunta de Galicia). Adrián Regos was supported by EU BON (308454; FP7-ENV-2012, European Commission), FORESTCAST (CGL2014-59742) and NEWFORESTS (PIRSES-GA-2013-612645) projects and is currently funded by the Xunta de Galicia (post-doctoral fellowship ED481B2016/084-0). We thank two anonymous referees and Mattia Brambilla for their useful comments and suggestions on earlier versions of this manuscript.


