Introduction
The major UK political news since the February Review was published is the surprise call for a general election, to be held on 8 June. Financial markets appear to have viewed this development positively, perhaps based on electoral polls which suggest the Conservative Party would be returned to government with an increased majority strengthening the position of the Prime Minister (figure 1). Commentators have indeed suggested that such an election victory will enable the Prime Minister to pursue a new relationship with the EU that is less damaging to the economy in the long run than defaulting to WTO rules, while also raising the prospect of a transitional period upon exit at the end of March 2019. But one should not forget that formal negotiations with the remaining EU27 and EU institutions have yet to begin and the hopes of financial market participants could well be dashed over the course of the complex process of a negotiated withdrawal from the EU.

Figure 1. General election voting intentions
Much of the election campaign will be dominated by the UK's exit from the EU. How far other important policy issues are crowded out is an acute near-term risk with long-run implications. There are a number of structural economic issues in the UK that need to be addressed. Pressing structural issues, not least the low levels of investment, which have been so endemic to the UK, and the more recent abysmal productivity performance are two important and, indeed, interrelated issues which intersect to determine our long-run prosperity. As Box A highlights, that our economic performance since 2010 has been poor, is most evident in the absence of any meaningful increase in the standard of living. The Commentary in this Review discusses these structural issues in detail and ends emphasising the risk we face, “we may, once again, be in danger of letting the urgent drive out the important. Political parties should not shy away from facing the question of Britain's underlying economic weakness and should be called upon to offer solutions that address the lost decade of economic growth the country has endured”.
At the time of writing, the manifestos of the main political parties have still to be published. It is only with the publication of these manifestos that political parties will begin to reveal how much of their election campaign will be dominated by leaving the EU; it is, after all, only with the publication of these manifestos that the election process truly gets underway.
In stark contrast, the process of leaving the EU has finally started, with the Prime Minister giving formal notice of the UK's intention to leave the EU on 29 March. The triggering of Article 50 of the Treaty of Lisbon before the end of March 2017 was not news for financial markets (see Box B). What Box B does highlight is the improvement in sovereign bond premia since the start of this year, while sterling has appreciated around the Prime Minister's Lancaster House speech and her calling of a general election for June of this year.
In terms of economic news, the outturn for GDP growth in the first quarter of this year suggests the economy has slowed substantially. Quarterly economic growth slowed from 0.7 per cent in the fourth quarter of last year to just 0.3 per cent in the first quarter of 2017 (figure 2). The ONS' Preliminary estimate of GDP suggests the slowdown was concentrated in the distribution and retail, and transport and communication sectors of the economy, consistent with a moderation in the contributions from consumer spending growth.
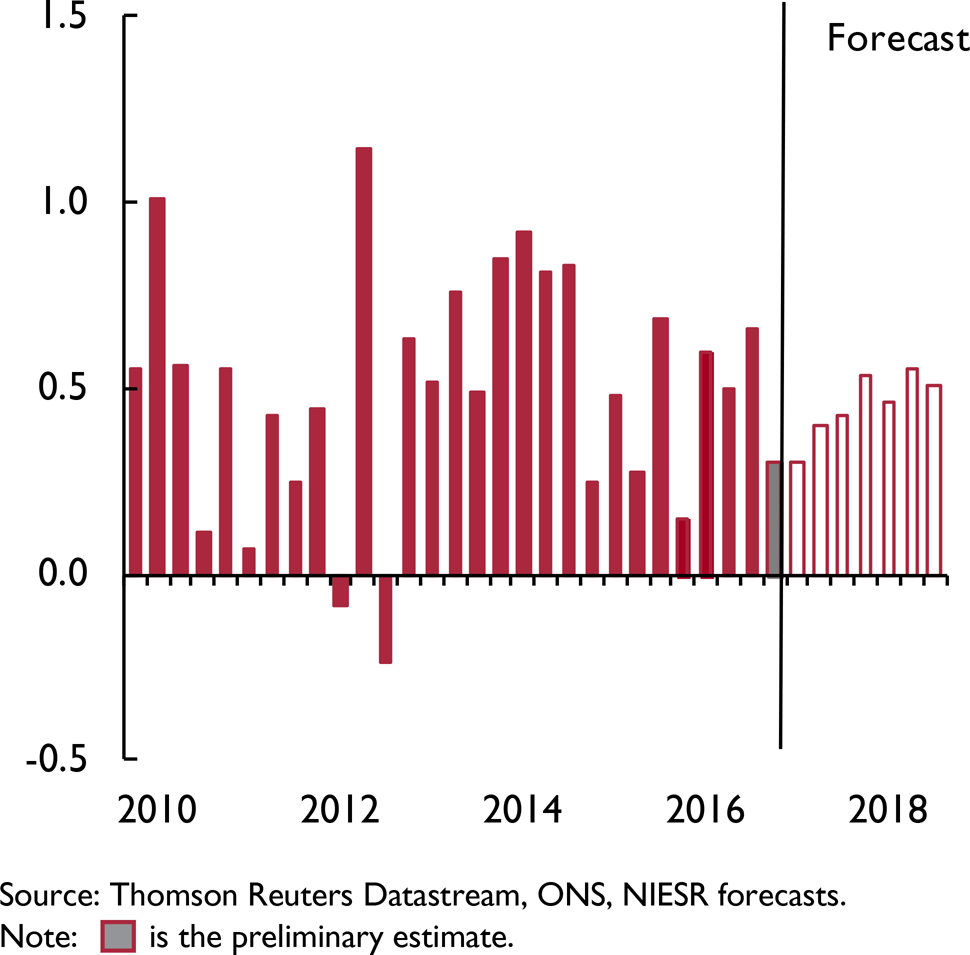
Figure 2. Real GDP growth (per cent per quarter)
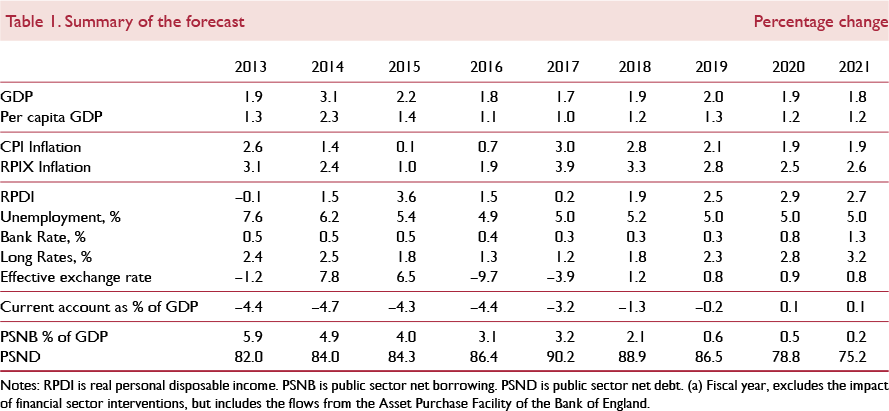
Our forecast for GDP growth for this year and next remains unchanged compared to the projection published three months ago. We expect growth of 1.7 per cent this year, rising only marginally to 1.9 per cent in 2018 (figure 3). Such growth rates are inconsistent with a further narrowing of the negative output gap in the UK, since we estimate potential output growth to average around 2 per cent per annum.
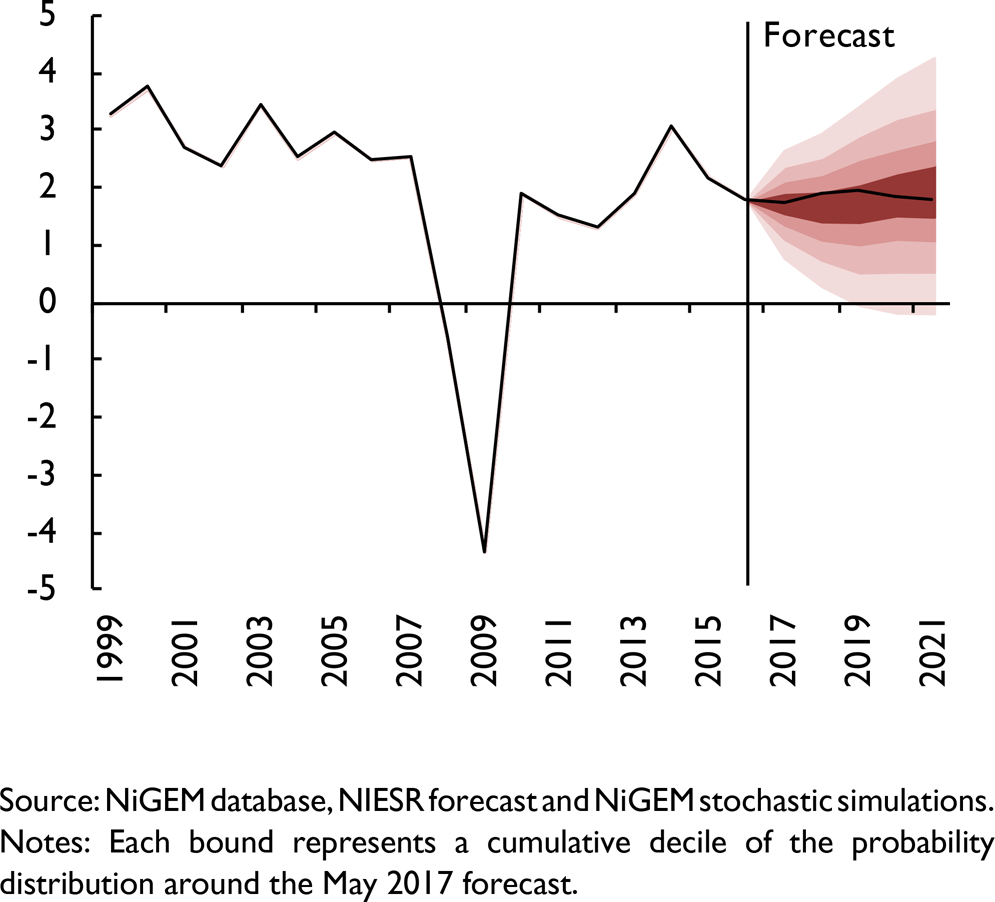
Figure 3. GDP growth fan chart (per cent per annum)
The slowdown in consumer spending is the key driver of the muted economic outlook. As we noted in our scenarios published before the referendum, and our forecasts published since, the environment of low inflation and rising real consumer wages that has proved a tailwind to consumer spending growth ended as the sharp depreciation of the exchange rate fed into consumer prices. Indeed the latest consumer price estimates suggest that price inflation is once again running ahead of the rate of growth in nominal wages. We expect this wedge to widen through the course of the year as CPI inflation reaches a peak of 3.4 per cent per annum in the final quarter (see figure 4).
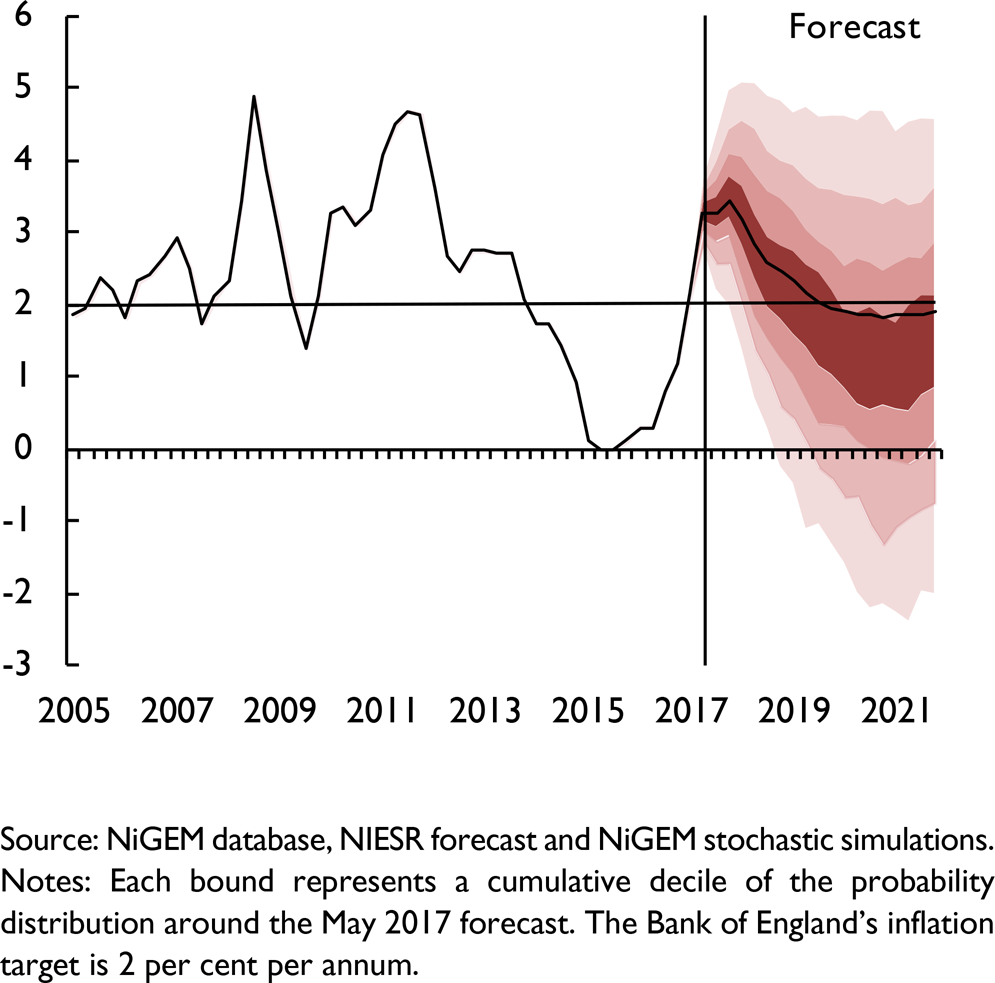
Figure 4. CPI inflation rate fan chart (per cent per annum)
This is a modest downward revision from our projection of 3.7 per cent per annum published in our February Review. This is partly a consequence of changes to the conditioning paths for exchange rates. The inflation forecast is always at the mercy of the conditioning path for exchange rates, but perhaps more so in recent months given the exceptional volatility of sterling. This volatility has led to rather a wide set of conditioning paths for successive forecasts since last summer (see figure 5). The path for bilateral exchange rates is assumed to follow a random walk from after the cut-off point for out conditioning assumptions (19 April 2017). From this point we assume bilateral rates remain constant through the remainder of this quarter and the subsequent two quarters. Beyond this, bilateral rates follow a path implied by an uncovered interest rate parity condition. This path implies sterling, on a trade weighted basis, will have appreciated 3½ per cent, year on year, in the final quarter of 2017, before reporting only modest gains in subsequent years.
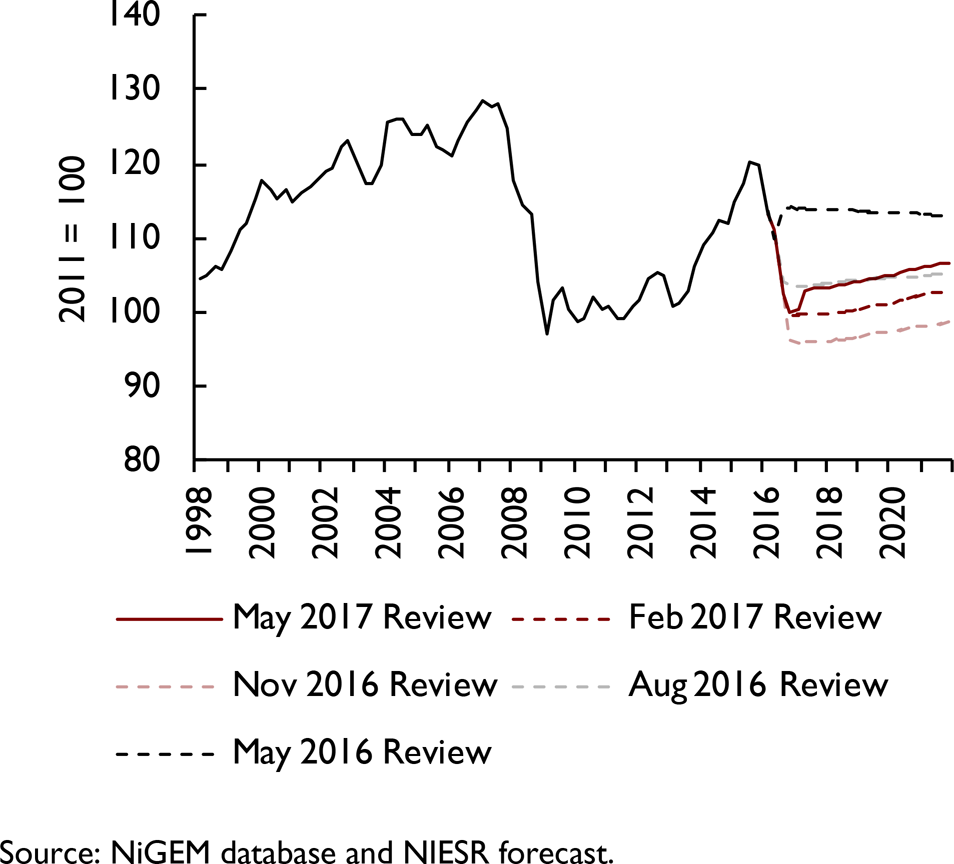
Figure 5. Effective exchange rate, trade-weighted
The performance of the labour market continues to be robust, at least with regard to headline indicators. The rate of unemployment has reached 4.7 per cent of the labour force and the employment rate of the working age population is at a record high of 74.6 per cent in the three months to February 2017. The labour market appears tight, yet wage growth remains subdued, not even keeping pace with price inflation. Questions have been raised over whether structural changes to the labour market have lowered the equilibrium unemployment rate to levels lower than before the financial crisis. The ONS measure of underemployment remains elevated compared to pre-crisis levels, indicating that there is perhaps more slack in the labour market than implied by the low unemployment rate (see the Supply Conditions section for further details).
In our forecast, muted economic growth coupled with heightened uncertainty result in employment growth failing to keep pace with the expansion of the labour force, but this is simply a temporary phenomenon (figure 6). While there is a risk that the unemployment rate will increase more sharply than we expect, there is also the risk that the equilibrium unemployment rate is substantially lower than pre-crisis levels and that we should expect the rate of unemployment to drop further in our forecast. In terms of labour market performance, the Beveridge curve is at least indicative of a return to pre-crisis levels of labour market matching (see figure A10), suggesting the absence of any negative structural dvelopment in the UK labour market.
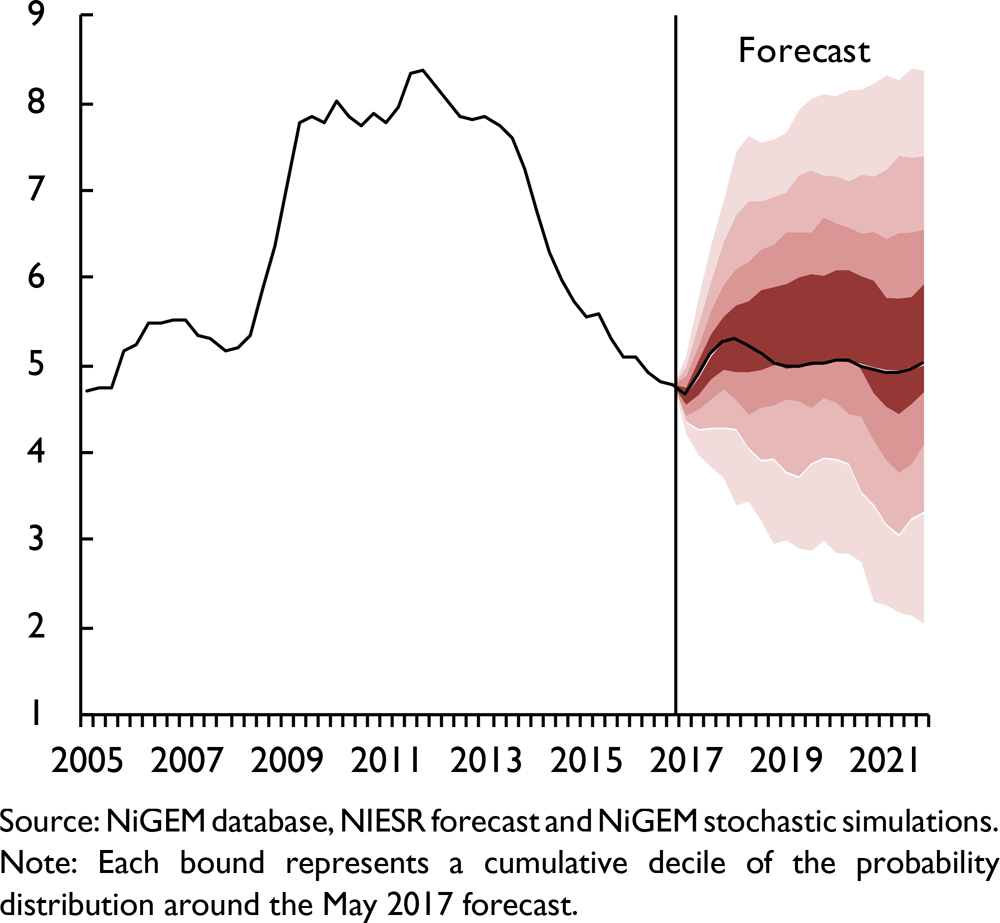
Figure 6. Unemployment rate fan chart (per cent of labour force)
Despite all the recent events at home and abroad, developments have not made any material difference to our assumptions with regard to the impact on the economy from the process of leaving the EU. Over the course of this year and next we assume that tighter financial conditions and elevated uncertainty will weigh on domestic spending, with the depreciation of sterling acting to stabilise overall economic performance. We have not made assumptions with regard to any transitional period once the UK has withdrawn from the EU. We await firmer information from the negotiation process before making such an adjustment to our assumptions. The long-run assumption remains an Europepan Free Trade Area type trading relationship with the EU, which our estimates suggest would lead to a long-run permanent loss of around 2 to 2½ per cent of GDP (Reference Ebell and WarrenEbell and Warren, 2016). One must not forget that the permanent economic consequences of leaving the EU remain a long-run phenomenon. Recent data outturns and political posturing do not change this economic reality.
The snap general election, called for June 2017, changes the period for the next Parliament from 2020–25 to 2017–22. The current objective of the government's fiscal framework is to “return the public finances to balance at the earliest possible date in the next Parliament”. The changes to the Parliamentary timetable reduce the chance of the government meeting this objective. Our projections suggest the government will still borrow around £3½ billion per annum in fiscal year 2021–2. This borrowing position is supported by the assumption that the public finances improve via no further net contributions to the EU. If an outcome of the negotiated withdrawal is the ‘settling of the UK's account’ then this borrowing figure could potentially be substantially higher than the £3½ billion figure in our forecast. Nonetheless, our projections suggest the changing of Parliamentary timetables will require a further fiscal tightening in order to ensure the objective of the fiscal mandate is met. However, tax increases early in the next Parliament could exacerbate the erosion of purchasing power that households face as a consequence of the pass-through to consumer prices from the sterling's depreciation in 2016.
Of course, the election of a new government may well bring yet another new fiscal rule. Were there to be another change to the fiscal framework we would welcome a change in the target measure that excludes capital expenditures; more precisely, targeting the current budget balance rather than an absolute surplus. At the time of writing election manifestos have not been published, but potentially pose risks on both sides of our projections for the real economy and fiscal aggregates. The precise magnitudes will begin to reveal themselves once manifestos have been published. Even if manifestos are light on detail about tax and spending plans it may still be possible to determine the implied outlook for the public finances and the real economy along the lines of Reference KirbyKirby (2015).
Reference Walton and DoodyWalton and Doody (2017) estimate that nominal GDP will be revised upwards by just over £10 billion (0.6 per cent of GDP in 2012) with the release of the Blue Book consistent national accounts in September 2017. Most of this upward revision is due to new methods of estimating actual and imputed rents. Assuming similar magnitudes of revision apply to the period 2013–16, then these upward revisions to the level of nominal demand will help lower the overall scale of the fiscal aggregates, as a per cent of GDP, but they do not change the estimates of the degree of fiscal consolidation required. Such discretionary policy changes are counted in £ billion, even as revisions to estimates of GDP refine our understanding of the relative size of the state's stocks and flows of debt.
The need for further fiscal tightening over the course of the next five years does not change the view of the OBR that further fiscal consolidation in the longer run will be required to ensure that the national debt, as a per cent of GDP, does not increase substantially. Longer-term fiscal risks are an issue that garners less public debate than it should do.
The world chapter of this Review summarises the major external risks facing the UK economy. These stem from policy uncertainty in the United States through to the continuing concerns related to the accumulation of credit in China. Much closer to UK shores, the outcome of elections across Europe, and most notably in France and Germany, will feedback into negotiations over the UK's withdrawal from the EU. The UK's exit from the EU presents both short and longer-term risk to the outlook. As we have noted above, we have not changed our underlying assumptions on how short and longer-term shocks will manifest. While deviations from our assumptions about the temporary elevated paths for risk premia and uncertainty pose the most obvious short-term risks to the outlook (see Reference Baker, Carreras, Kirby, Meaning and PiggottBaker et al., 2016 for an exploration of different paths for risk premia and uncertainty), there is very real possibility of the UK and EU not negotiating a new relationship or even a transitional deal, the so called ‘cliff-edge’ scenario that perhaps presents the greatest ‘Brexit’ related risk to the outlook. But underlying this remains the single largest risk to rising living standards in the UK: a continuation of persistent poor productivity performance. Finally, there is an additional risk that leaving the EU interacts with persistent productivity weakness. In a review of the literature Reference SyversonSyverson (2011) highlights that, while the link between competition and productivity is relatively robust, the evidence for a trade to productivity causal link is mixed. Syverson does, however, highlight some evidence that this latter relationship is more robust for exporters to high-income countries. Reference Ebell and WarrenEbell and Warren (2016) underpin our long-run assumptions on the effects of withdrawing from the EU. We view their results as conservative precisely because they do not include any direct link between trade and productivity.
Our fan charts are derived from stochastic simulations. In generating these we assume that the floor to Bank Rate is 0.1 per cent. As such there is very limited scope for the MPC to respond to any additional negative shocks to the economy. This generates a skew distribution we present in the fan chart in the short term. We think this reasonably illustrates the shape of risks the economy faces in the near term. Further out the distribution is evenly balanced since the condition path for interest rates rises over time presenting the MPC with significantly more monetary space to mitigate any negative shocks. Perhaps medium term risks are more evenly distributed. However, the risks stemming from the UK's withdrawal from the EU as well as the concerns about further productivity shortfalls cannot but leave one thinking the risks are weighted to the downside.
Box A. UK economy since 2010
The UK economy has been on a recovery path since 2010. The economy is some 9 per cent bigger in real terms compared with the pre-crisis peak in the first quarter of 2008 and around 27 per cent bigger in nominal terms, employment is at record levels in terms of numbers and as a share of working age population and CPI inflation is close to the target rate of 2 per cent. At face value this performance might appear as acceptable, but the economic recovery period is also characterised as one of structural weaknesses related to low investment, weak productivity and real wage growth, and stagnant living standards.
One of the striking features of this recovery period is its pace – economic growth has been anaemic compared with past recovery episodes (figure A1), including the recovery that followed the Great Slump in the 1920s. Consistent with that, forecasters have persistently overpredicted real GDP growth outturns since the Great Recession and alongside that, delayed the recovery in productivity, wages and inflation.
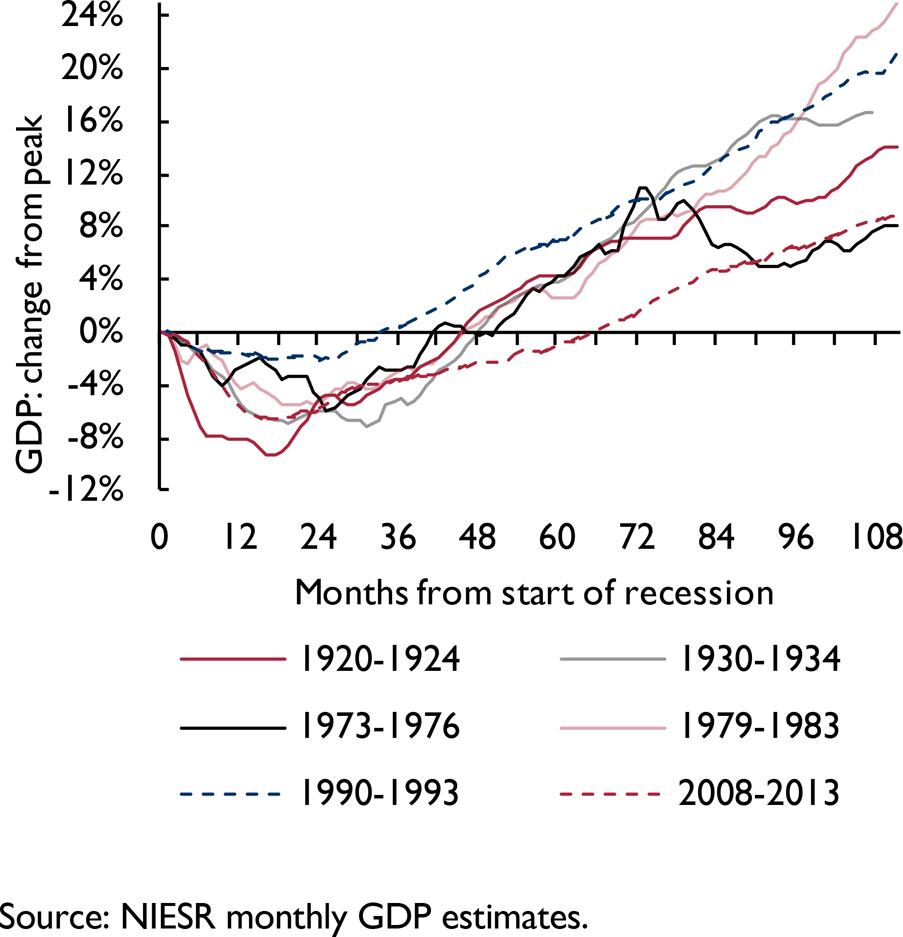
Figure Al. The profiles of recession and recoveries
Unlike GDP growth, employment outturns, as measured by hours and heads, have persistently outperformed and although the unemployment rate on the LFS measure has fallen to just 4.7 per cent – below the pre-crisis rate of 5.2 per cent – we estimate that there is still some spare capacity in the economy.
The corollary to high employment and weak GDP growth outturns is low productivity growth. Most advanced economies have suffered from low labour productivity growth since the Great Recession and the UK is no exception. What is particularly striking is that the productivity gap between the UK and other advanced economies has widened since the financial crisis. To place this in perspective, French, German and US workers were on average producing some 20 per cent more output than UK workers in 2015 and had the UK productivity performance matched its pre-downturn trend, labour productivity would be some 15 per cent higher by 2015, making UK the worst performer of any G7 economy on this metric (ONS, 2017).
Weak productivity growth is closely tied to low household real income growth. Household real personal disposable income was more or less stagnant in the period immediately following the crisis from 2009 to 2013 and it was not until 2015 that households achieved annual income growth that matched the pre-crisis historical average. Lacklustre productivity undoubtedly explains some of the weakness in income growth, but there are a number of other competing cyclical and structural explanations. These include a fall in the reservation wage because of lower debt servicing costs on mortgages, globalisation and its impact on wage bargaining and immigration into the UK particularly from Eastern Europe (Reference BlanchflowerBlanchflower, 2015).
Inflation has been particularly volatile since 2010. CPI inflation peaked at 5.2 per cent in September 2011 and troughed at −0.1 per cent in April and October 2015, triggering a number of explanatory letters from the Bank of England's Governor to the Chancellor, but inflation overall averaged 2.2 per cent over this period which of course, is not too far from Bank of England's target of 2.0 per cent. A more complete story of domestic inflation dynamics must include a comment on wages. At a time when CPI inflation was in line with the target, nominal wage growth averaged just 1.6 per cent, which is not only lower than headline inflation, it is also below the 1998–2008 average of 5.2 per cent. UK households have experienced a sudden and sharp drop on real consumer wage.
Household spending was the main contributor to GDP growth from 2012 to 2016 once the drag on real income from inflation receded, with growth in excess of 2 per cent since 2014. The recovery in real personal disposal income was a key driver, but households also saved less. The saving ratio peaked in the third quarter of 2010 at 8.3 per cent and has since followed a downward path with the 2016 average of just 4 per cent. Household incomes are once again under pressure, mainly because of the post-referendum sterling depreciation and its impact on consumer price inflation. We do not expect real per capita household consumption to reach its pre-recession level until 2020 (figure A2).

Figure A2. Per capita consumer spending
Asset prices, most notably house prices, responded quickly to a favourable policy environment for risk assets, namely tight fiscal and ultra-accommodative monetary policy. The official ONS house price index shows a 26 per cent increase over the past 5 years and on this measure house prices are some 13 per cent above the pre-crisis peak reached in fourth quarter of 2007. Activity and house price inflation eased in the second half of 2016 because of the hike in Stamp Duty on second homes and buy-to-let properties and less generous tax deductions for buy-to-let properties. The most recent Bank of England rate cut and asset purchases is acting to support an otherwise subdued housing market.
The trade-weighted exchange rate has been volatile since the Great Recession compared with its recent history. The exchange rate fell by around 23 per cent in 2007/8, and then appreciated by some 20 per cent from 2013–15 before depreciating by 11 per cent in response to the EU referendum last year. The UK has been running a persistent trade deficit over this period of somewhere between 1.5 per cent and 3 per cent of GDP. The large depreciation associated with the Great Recession was not enough to swing the trade balance from deficit to surplus mainly because the gain in competitiveness from the depreciated currency was offset by weak growth dynamics in UK's major export markets, most notably the Euro Area.
The UK, in common with much of the rest of the advanced world, allowed monetary policy to do most of the heavy lifting as fiscal stimulus was withdrawn from the economy. Bank Rate hit a near effective floor in the first quarter of 2009 and has remained there until August last year when the MPC nudged the policy rate lower by another 25bp to just 0.25 per cent, in response to the UK vote to leave the EU. The Bank of England also purchased bonds worth £375 billion as part of the Asset Purchase Facility by end-2012 and announced further stimulus in the form of additional government and corporate bond purchases and also introduced a Term Funding Scheme to ensure that the cut in the Bank Rate is fully passed through in August last year. The Bank of England holds some 30 per cent of the stock of outstanding government debt.
The fiscal deficit peaked at around 10 per cent of GDP in 2009/10 and has dropped to just 2.6 per cent in 2016/7 which is similar to the level prior to the onset of the financial crisis. The fiscal consolidation programme was heavily skewed towards spending cuts rather than tax increases and consistent with that Total Managed Expenditure fell from 45 per cent to 39 per cent of GDP over this period while current receipts rose from 35 per cent to 37 per cent. Both ratios are close to pre-crisis levels.
Although tax and spending ratios are close to pre-crisis levels, overall public debt rose rapidly to 90 per cent of GDP. The UK fiscal debt ratio is the 6th highest of 26 advanced economies and the fiscal deficit is the 5th largest of 35 advanced economies (Reference EmmersonEmmerson, 2017).
The government has repeatedly slipped on its fiscal deficit and debt targets over this period mainly because economic growth forecasts have turned out to be too optimistic. Instead of inflicting the economy with a more severe austerity programme, the government responded by changing the fiscal rules. Target dates for debt reductions were initially delayed and then abandoned and targets for the deficit were also postponed. Chancellor Hammond pledged at the last Autumn Statement to eliminate the fiscal deficit ‘as early as possible in the next Parliament’ – a goal post that has likely changed after Prime Minister May unexpectedly announced an early General Election.
Although the Bank of England's inflation mandate did not change over this period, the MPC itself has amended its forward guidance for monetary policy since it was first introduced in 2013. The 7 per cent unemployment rate threshold was altogether abandoned a year later in 2014 and replaced by more generic guidance not to dissimilar from the period prior to the introduction of forward guidance where the path for the policy rate will the driven by developments in the economy rather than any particular macroeconomic variable.
This box was produced with funding from the Nuffield Foundation as part of its work to ensure public debate in the run-up to the General Election and is informed by independent and rigorous evidence. It was produced by Amit Kara.Monetary conditions
At their August 2016 meeting, the MPC voted to loosen monetary policy in the wake of the vote to leave the EU. Alongside a 25 basis point cut in interest rates, these policy measures included an expansion of the Bank's balance sheet, through the purchase of £60 billion of gilts and £10 billion of sterling non-financial corporate bonds purchases. By the end of April 2017, the Bank's Asset Purchase Facility (APF) had completed these additional purchases. Further expansions in the Bank's balance sheet will now stem from use of the Term Funding Scheme, a liquidity scheme for which the cost of banks is determined by changes in the position of their lending to the real economy.
The policy package was announced around the point when interest rate expectations were at the lowest level in recent years (figure 7). Subsequently, we have observed a tightening in the market expectations of interest rate developments. At the shorter end of the instantaneous forward overnight indexed swap (OIS) yield curve expectations have moved little over the past three months. Looking more than a year out, expectations appear to have softened. Overall, these figures are consistent with a first interest rate rise being pushed back from August 2019 to April 2020, more in-line with expectations that were formed in the latter part of 2016.
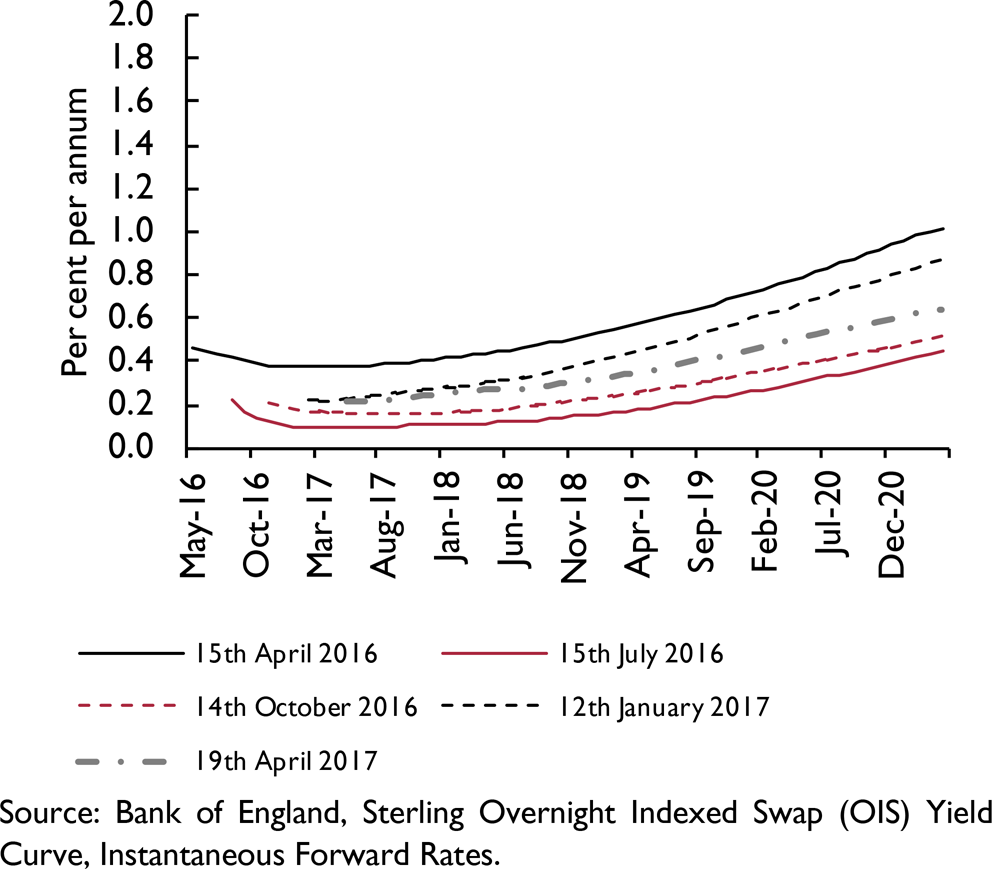
Figure 7. Interest rate expectations
We deviate from market expectations in the conditioning assumptions underpinning this forecast. We assume that a majority on the MPC will vote to raise interest rates once the UK has left the EU, more than six months earlier than current market expectations. After this point, interest rates will gradually rise, reaching 2 per cent in the latter half of 2022. The MPC have stated that once interest rates reach 2 per cent, they will stop reinvesting the proceeds from maturing gilts held by the APF. Given the APF's current portfolio, this implies approximately £153 billion of gilts mature and need to be reinvested in the government bond market between now and the third quarter of 2022. Beyond 2022 we assume that the Bank's balance sheet shrinkage occurs naturally, rather than via sales to the secondary bond market.
But the risk to the outlook stems from interest rates rising sooner than we have assumed, not least because the near term inflationary profile presents a significant challenge to the MPC. At its March 2017 meeting, Kristin Forbes voted for an interest rate rise. Communications suggest other MPC members may well be persuaded to vote for an interest rate rise, subject to economic data outturns (see Reference SaundersSaunders 2017, for example), in coming months, but this is unlikely to be a majority, at least in the short term.
The rate of CPI inflation has already risen above target and we expect this gap to widen further through the rest of this year. We view this as largely a temporary phenomenon, though this manifests as a permanent increase in the price level for an inflation targeting central bank. The MPC members have to grapple with whether above target inflation is simply explained by temporary external factors, or whether there are more persistent factors behind it. On the latter point, data from the labour market paint a relatively benign inflationary environment, with nominal wage inflation subdued. At the same time, the core measure of inflation is already marginally above its long-term average, providing at least some tentative suggestions of pressures in the system.
Ultimately, the MPC is weighing a series of difficult trade-offs, many of which relate to the shock of leaving the EU. While the effect on demand in the short term is less than many had thought, it remains the case that leaving the EU is a shock to the long run of the economy. The question that will increasingly weigh on the MPC is to what magnitude and how quickly does the supply side of the economy adjust to the post-EU equilibrium, and how disruptive to economic activity is this. A transitional arrangement with the EU may smooth this adjustment, but it is unclear that a transitional arrangement is the most likely outcome at present. Such concerns may weigh on the MPC for a considerable time. Indeed it is these persistent policy uncertainties that continue to guide our thinking with regard to how the MPC will react over the next few years.
Prices and earnings
The ONS' headline rate of inflation, which includes the costs of imputed rents from owner occupied housing (CPIH), increased by 2.3 per cent in the 12 months to March, the same annual rate as prevailed in February. For the first time since June 2014, all broad subcomponents contributed positively to the headline rate, with the largest contributions coming from transport and housing services, which grew by 4.4 and 2 per cent on an annual basis and contributed 0.5 and 0.6 percentage point, respectively, to the overall number.
The lack of increase in the annual rate of inflation between February and March goes against the trend that has prevailed since October, where the rate has increased each month by around 0.2 to 0.3 percentage point. While inflationary pressures in March have intensified across a number of CPI subcomponents – most notably food and non-alcoholic beverages, alcohol and tobacco, and clothing and footwear – these are almost entirely offset by a decline in the contribution of the transport component of close to a ¼ of a percentage point to the headline rate relative to February. Although some of the moderation of the contribution of transport prices can be attributed to external factors such as a stronger exchange rate, the majority is a result of developments in airline fares via a calendar effect. The latter has transpired as Easter – during which fares for airline passengers increase markedly – has occurred one month later this year than last year. Consequently we are likely to see a jump in this component in April which will be reflected in the headline number.
Of all the external factors which affect our inflation forecasts, developments in exchange rates are likely to have the largest impact. Sterling, in trade weighted terms, reached its nadir during the middle of October 2016, after which it has steadily appreciated; by 13 April it was 5.3 per cent stronger. The surprise announcement by Prime Minister Theresa May on 18 April, that she would seek an early election on 8 June, led sterling to appreciate a further 1.5 per cent by the end of the day. Incorporating these developments into our forecast means that we now expect exchange rates to be 2.8 and 3.6 per cent stronger in 2017 and 2018 respectively than in our February Review and the new exchange rate path is broadly in line with our expectations immediately after the referendum (see figure 5). This appreciation is expected to weigh on inflation towards the end of this year and through the next, leading to a slightly lower peak inflation rate than we had previously anticipated (see Reference Kirby and MeaningKirby and Meaning (2014) for a discussion of inflation pass through).
Our oil price projections are based on those produced by the Energy Information Agency (EIA), and remain broadly unchanged from our February Review. We expect average annual growth of close to 28 per cent this year which moderates to around 5½ per cent next year. This implies oil prices of around $55 and $60 by the end of 2017 and 2018, respectively.
The impact of the appreciation of the sterling effective exchange rate may already be appearing in the producer input price index which, despite growth of 17.1 per cent in the 12 months to March, has moderated in each month since January when it grew by 20.1 per cent.
Underlying the headline rate, the largest contribution was from crude oil products, which increased in price by 56.1 per cent in the year to March and contributed 6.6 percentage points to input price growth. The same picture has been largely reflected in factory output prices, which grew by 3.6 per cent on the year, marginally down from 3.7 per cent in February. The main driver was petroleum products which contributed 3.3 percentage points to the final number.
Overall we expect the pass-through from the depreciation of sterling to continue throughout this year with inflation peaking in the final quarter of 2017 at 3.4 per cent. This is a downward revision from our previous forecast of 0.2 percentage point and is largely a result of the notably stronger forecasts for sterling. Subsequently, we expect inflation to return gradually towards the Bank of England's inflation target of around 2 per cent in the middle of 2019.
Growth in nominal wages continues to be weak. In the first quarter of this year, average weekly earnings (AWE) excluding bonuses grew by 2.2 per cent when compared with the same three months in the previous year, implying that real incomes were broadly flat. While this remains unchanged from February, it represents a slight moderation from the end of 2016 when, in November, growth of AWE excluding bonuses had peaked at 2.6 per cent. We forecast average nominal wage growth to remain weak throughout this year and next, with average growth of 2.6 and 2.7 per cent respectively. Combined with our forecasts for inflation, this implies that real consumer wages will fall by 0.4 per cent in 2017 before returning to growth in 2018 of 0.2 per cent.
Box B. Financial markets responses to the triggering of Article 50 and other political developments
The British Government triggered Article 50 of the Lisbon Treaty on 29 March. The announcement was widely anticipated and the financial market response was unsurprisingly muted. The road to final exit is long and other news and events since the referendum have caused more pronunced movements in financial markets.
Foreign exchange reaction
As one would expect, sterling exchange rates have been among the most responsive to EU withdrawal related news. Sterling bilateral rates were, however, stable in the week from 27 to 31 March 2017, which is consistent with the foreign exchange market pricing this event in.
But sterling was significantly affected by other political developments as is evident when looking at the 2-months implied volatility (figure B1). The referendum in June is a good example, but as the chart shows, sterling volatility also spiked in response to other news: the Prime Minister's speech at the Conservative Party conference on 2 October 2016, her Lancaster House speech on 17 January 2017, the UK parliamentary approval of the European Union (Notification of Withdrawal) Act on 13 March 2017 and the calling of a general election for 8 June on 18 April 2017. We can also see that the magnitude of the market reaction to these events decreased with time, perhaps because these events did not represent policy shifts, but instead were interpreted as further news about the UK's position on and objectives for the EU withdrawal process. Volatility has now returned to its long-term average.

Figure B1. Sterling 2–months implied volatility index
Equities reaction
The FTSE 100 index has experienced robust growth since the referendum, increasing by 14 per cent between 23 June 2016 and 28 April 2017, and even outperforming by 1 percentage point the S&P 500 over the same period. However, when converted to US dollars, the fall in sterling offset nearly all of the gains in the FTSE 100 (figure B2). The smaller capitalisation index, FTSE 250, was even more negatively impacted by the depreciation of the currency because it is composed of companies more exposed to the domestic market, even though the gap between the FTSE 250 and FTSE 100 has been recently narrowing.
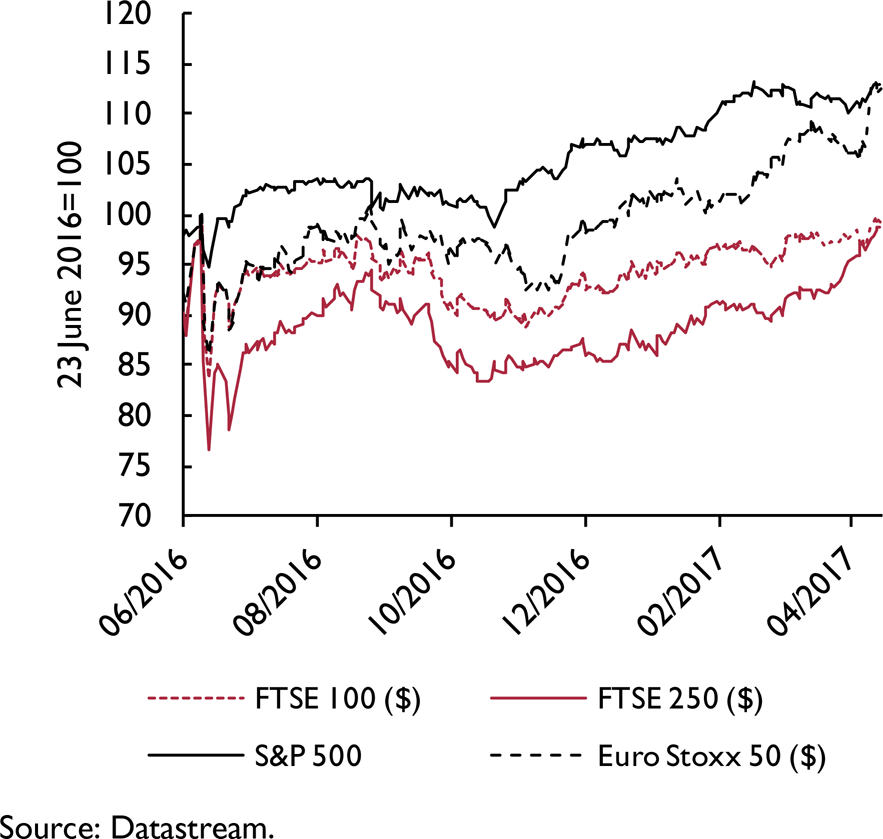
Figure B2. Performance of stock market indices, in US dollars
Government bonds market reaction
During the week when Article 50 was triggered, UK 10-year bonds continued a rally that had started the week before, with yields falling by 7 basis points. However, there was no out-performance of gilts compared to their European peers, as other major European 10-year sovereign bonds also rallied. Since the referendum, the yield on 10-year gilts has been reduced by 48 basis points whereas German and French bonds have increased by 22 and 33 basis points respectively. This can be only partly attributed to movements in sovereign premia which have proved reasonably stable around the triggering of article 50 (Figure B3).

Figure B3. Term premia on 10-year sovereign bond yields
This box was prepared by Cyrille Lenoel and Matteo Ramina.
Components of demand
Output in 2016 grew by 1.8 per cent, unrevised relative to the second estimate of GDP. Growth in output for the year as a whole was unbalanced, with private consumption contributing 1.8 percentage points to GDP while net trade deducted 0.4 percentage point. The ONS's preliminary estimate of GDP suggests that output grew by 0.3 per cent in the first quarter of 2017, the slowest rate of growth since the first quarter of 2016. The moderation in the rate of expansion of GDP can be attributed to a slowdown in output from the service sector. Looking ahead, we expect output growth of 1.7 and 1.9 per cent for this year and next, unchanged from our forecast in the February Review. Figure 8 shows the contributions of the components of GDP to our growth forecast. We expect the contribution from net trade to turn positive this year and next offsetting the decline in the contribution from private consumption. The dynamics of net trade and private consumption are intimately linked as they both hinge on the impact of the recent devaluation of sterling on trade volumes and domestic prices.

Figure 8. Contributions to GDP growth
GDP can be measured in three different ways: the output, the expenditure, and the income approach. In principle, all measures should deliver the same GDP growth figure although in practice this may not be the case due to data limitations. The process of balancing the differences between the three measures relies on supply and use tables which only become available at a two-year lag. For the production of the first estimate of quarterly GDP growth, the ONS uses the output approach. Note that this does not imply that the annual growth rate of GDP matches that of the output approach as estimates from previous quarters are revised making use of a mixture of data from the three different approaches. Recently, the GDP growth figure arising from the expenditure approach to measure GDP has diverged significantly from the other two approaches, see figure 9. As already discussed, that each approach delivers a different figure is not unexpected, what is surprising is the magnitude of the difference; the residual component explains 0.7 percentage point of the headline GDP growth figure. Such a large residual, if it were to be allocated unevenly across the subcomponents of GDP during the balancing process, could be large enough to change our understanding of the recent economic performance.

Figure 9. Real GDP growth
Real consumer expenditure has been the main engine of growth between 2012 and 2016. After growth of 2.8 per cent in 2016, we expect real consumer expenditure growth to soften this year to 1.5 per cent before contracting by 0.1 per cent in 2018, with growth resuming from 2019 onwards. The projected slowdown in real expenditure growth crucially hinges on the inflationary impact of the depreciation of sterling that took place after the referendum. Overall, we forecast real consumer expenditure to contribute 1 percentage point to output growth this year and to deduct 0.1 percentage point in 2018. Combined with demographic developments, average real per capita consumption expenditure grew by 1.4 per cent between 2012 and 2016, a figure that remains well below the average growth rate of 3 per cent that prevailed between 1998 and 2007. Despite sustained growth in real consumer expenditure in excess of population growth, real per capita consumption expenditure remains below the pre-crisis peak reached in the last quarter of 2007, albeit by a small margin of 0.3 per cent. The projected softening in real consumer expenditure implies that real consumption per capita will not reach the pre-crisis peak until mid-way 2020, see figure 10.

Figure 10. Real consumption per capita (in 2013 prices)
After robust growth in excess of 4 per cent since 2010, private sector investment growth has declined markedly in 2016 to 0.4 per cent, with the contraction in business investment of 1.5 per cent partly offset by growth in housing investment of 4.5 per cent. Such a sharp slowdown in the rate of expansion of investment is in all likelihood partly related to the uncertainties emanating from the outcome of the referendum. In the absence of further clarity regarding the outcome of the negotiation process for exiting the European Union, we expect uncertainty to continue to weigh down on private sector investment. Accordingly, we forecast private sector investment to contract by 3.3 per cent this year and to bounce back in 2019 with growth close to 5 per cent as uncertainty dissipates.
Real government consumption has expanded every year since 1997, although in per capita terms it contracted in 2010–11 and in 2013. Our forecast for real government consumption is based on spending plans announced by the government and, in the absence of specific spending envelopes, is based on the assumptions outlined in the Office for Budget Responsibility's (OBR) forecast. The Spring Budget constituted a marginal loosening of fiscal policy relative to policy announced in the 2016 Autumn Statement. Consequently, we have raised our projection of growth in government consumption from 0.9 to 1.2 per cent for this year, which implies a contribution of government consumption to output growth of 0.1 percentage point.
Net exports have been the largest contributor to output growth, on a quarterly basis, in the final quarter of 2016, adding 1.7 percentage points. A key ingredient shaping such a large contribution is the erratic category within the trade statistic, in particular the non-monetary gold component. Non-monetary gold is gold that is not held as a reserve by a monetary authority and is, together with the other goods within the erratic component (aircraft, ships and precious stones, among others), highly volatile. Including erratics, in the three months to December 2016 the deficit in the balance of trade in goods and services declined by around £10 billion, while excluding erratics the deficit declined by £2½ billion. It must be highlighted that fluctuations in non-monetary gold are GDP neutral, meaning that while they do have an impact on the values of the sub-components of GDP they have no impact on the overall GDP growth figure. This is because any change in non-monetary gold recorded in trade statistics is also recorded, with the reverse sign, in the stockbuilding category. Including erratics, net trade has deducted 0.4 percentage point from GDP growth in 2016.
Looking ahead, gains in price competitiveness due to the recent depreciation of sterling combined with a decline in demand for imports induced by a softening in real consumer expenditure will translate into further improvements in the trade balance. However, subdued growth in demand from the UK's main EU trading partners, together with the view that domestic exporters may try to protect profit margins, are likely to weigh on the capacity to expand export volumes. As a result, we expect imports to be the main channel through which the depreciation of sterling will improve the trade balance. We expect net trade to add ½ percentage point to output growth this year, the first positive contribution from net trade since 2011, widening to 1.2 percentage points in 2018.
Household sector
The strong performance of real personal disposable income (real income henceforth) in 2015 has failed to carry over to 2016, with growth halving to 1.5 per cent; a figure close to our forecast of 1.8 per cent growth from our February Review. The weaker than expected data outturn in the fourth quarter of 2016 is explained by a decline in the property income category, where property in this context denotes financial assets rather than ownership of real estate. A combination of rising consumer price inflation induced both by the recent depreciation of sterling as well as the rebound in energy prices, together with a moderation in nominal wage growth, results in a forecast of nearly stagnant real incomes for this year. Subsequently, as pass-through from sterling depreciation is completed and supported by an assumption of a return to meaningful productivity growth, we expect real income growth to pick up at a rate of close to 2 per cent in 2018 and at an average rate of around 2¾ per cent between 2019 and 2023. Taking into account population projections by the ONS, our forecasts imply a decline in real income per capita of ½ per cent this year before growth resumes in 2018, at a rate of close to 1¼ per cent. In the medium term we expect average annual real income per capita growth of just over 2 per cent.
House price inflation has softened during the first quarter of 2017. According to our preferred measure of house prices, the UK house price index published by the ONS and the Land Registry, house price inflation was 5.8 per cent in the twelve months to February 2017. This rate, although robust, is weaker than the average annual growth rate of 7.3 per cent last year. The pattern of a moderate slowdown in the rate of house price inflation is congruent with leading indicators such as the Halifax and Nationwide house price indices. According to Halifax, house prices have increased, on a twelve month basis, by 2.8 per cent in March 2017, which compares to an average growth rate of 7.7 per cent during 2016. Nationwide reports house price inflation, on a twelve month basis, of 2.5 per cent in April 2017, which compares to an average growth rate of 4.9 per cent during 2016.
Data from the Royal Institution of Chartered Surveyors (RICS) show that both buyer enquiries and instructions to sell have been declining since November 2016, indicative of an expectation that market activity will be subdued. Price expectations have remained broadly constant since December 2016, see figure 11, which is consistent with an expectation of declines in both demand and supply. After robust growth in house prices of 7.7 per cent in 2016, we expect house price inflation to moderate this year to 5 per cent and to stagnate in 2018, driven by the decline in demand attributed to the erosion of real incomes.

Figure 11. Buyer enquiries, instructions to sell and price expectations (net balance, SA)
After a surge in activity in March 2016, partly driven by the April 2016 increase in Stamp Duty tax for buy-to-let properties and second homes, and the subsequent sharp drop in April 2016, data on the volume of residential property transactions from HM Revenue and Customs shows activity has resumed and almost reached prereferendum levels, see figure 12. In the six months prior to the referendum, transactions averaged 106,000 while the average since January 2017 has been 103,000. Data from the February 2017 Bank of England Money and Credit report portray a slightly more muted picture of activity. Mortgage approvals for house purchases have been rising steadily from a trough of 61,000 in August 2016 to 68,000 in February 2017. This, however, remains below the two-year peak reached in January 2016 of 73,000, see figure 12.

Figure 12. Residential property transactions and mortgage approvals for house purchase (thousands, seasonally adjusted)
The spread between household borrowing and deposit rates has increased gradually from a low of 2.11 percentage points in the second quarter of 2012 to 3.44 percentage points in the final quarter of 2016. The rise in the spread was driven by deposit rates falling at a faster pace than borrowing rates. This is likely to reflect credit institutions seeking to widen their profit margins by passing, to a greater extent, the decline in Bank Rate to deposit rates rather than to borrowing rates. However, as borrowing rates have also been declining, income gearing – the share of income households devote to interest payments – has remained at historical lows, see figure A5. Since the Bank of England cut Bank Rate by 25 basis points in August last year, time deposits have declined by 28 basis points as of February 2017, floating rates on secured credit have declined by 25 basis points and fixed rates on secured credit by 17 basis points.
Private consumption expenditure contributed 0.4 percentage point to quarterly output growth in the final quarter of 2016. While in the third quarter private consumption was driven by expenditure on services, with expenditure on goods making little to no contribution, in the fourth quarter this profile reversed. The March 2017 Retail Sales release, which provides a timely indicator for household consumption, comprising around one third of total private expenditure, suggests consumer expenditure declined in the first quarter of 2017. Retail sales data, on a volume basis, have been strong since August 2016, with growth rates exceeding 1.3 per cent on a quarterly basis until December 2016 when retail sales growth softened to 0.8 per cent. In the first quarter of 2017 the index declined by 1.4 per cent, which, together with the 1.5 per cent decline that occurred in the three months to February 2017, represents the largest drop since February 2010.
In light of the available information, we expect a slowdown in consumer expenditure growth. Underpinning this is weak real income growth alongside a declining contribution from the housing wealth effect. For a more detailed explanation of the outlook for consumption the reader is referred to Box C. After robust growth of 2.8 per cent in 2016, we forecast consumer expenditure growth to soften to 1.5 per cent in 2017 and to contract by 0.1 per cent in 2018 before growth resumes in 2019.
The UK's household saving rate, including the adjustment for changes in household's net equity holdings in pension funds, declined in the last quarter of 2016 to 3.3 per cent, 2 percentage points lower than that of the third quarter of 2016. This is the lowest saving rate since data records began in 1963. The sharp decline can be traced back to a rise in expenditure against the backdrop of declining real incomes. Stripping out the adjustment for changes in household's net equity holdings in pension funds, a measure that becomes closer to the amount of cash left in households' pockets after all expenditure has taken place, the saving ratio has declined to 0 per cent in the last quarter of 2016, 1.1 percentage points below the level that prevailed in the third quarter of 2016.
After reaching a peak of 160 per cent in the first quarter of 2008, household debt to income ratio declined to just below 137½ per cent in the third quarter of 2015. Recently, as a result of consumer expenditure growth outpacing real income growth, the stock of debt to income has picked up and reached 141.2 per cent for the year as a whole in 2016. Given our projections for consumer expenditure and real income growth, we forecast the household debt to income ratio to peak at 141¾ per cent this year before it starts to decline in 2018, reaching 136 per cent in 2021. Consumer credit, has in fact, recovered strongly over the past three years, driven in large part by dealership car finance, a recent innovation in financing a car purchase. Such robust growth in non-bank finance focused on a specific consumer durable raises questions with regard to the sustainability of such growth rates as well as possibly presenting financial stability challenges to regulators.
Supply conditions
The unemployment rate stayed at a near 12-year low of 4.6 per cent in the three months to February, while the employment rate reached an all time high of 74.6 per cent. The number of economically inactive also fell over the same period. We expect unemployment to increase slightly this year, averaging 5.0 per cent, before rising further to 5.2 per cent next year. Despite declining unemployment rates, wage growth has been sluggish over the past few years. This can be explained in part by the poor productivity performance of the UK economy following the recession.
Labour productivity, in terms of output per hour, grew by 0.4 per cent in the fourth quarter of 2016 compared to the previous quarter, to reach a level 1.1 per cent higher than the first quarter of 2008, immediately prior to the downturn. This represents stronger productivity growth than compared with recent quarters, but is below the 2000–7 average of ½ per cent. One factor often cited as a possible contributor to the UK's productivity puzzle is capital shallowing as firms have substituted labour for capital, perhaps due to labour becoming relatively cheap, thus perpetuating the cycle.
Job-to-job flows, which measure the number of people who remained in employment over the quarter but are in a different job, are part of an efficiency enhancing reallocation process since they generally result from voluntary quits for better, higher paid jobs. The job-to-job flow rate declined markedly after the onset of the recession but has been on an upward trend since late 2009, approaching pre-recession levels in the third quarter of 2016, although the rate fell in the following quarter (figure 13).

Figure 13. Job-to-job flows (ages 16–69)
Following the recession, growth in earnings was, until recently, even more subdued than productivity growth. Figure 14 shows that although output per worker fell by considerably more than real average weekly earnings in 2009, earnings continued to decline until 2014. Average real weekly earnings growth peaked at 2.4 per cent year-on-year in the second quarter of 2015, but has since declined to 1 per cent in the final quarter of 2016.
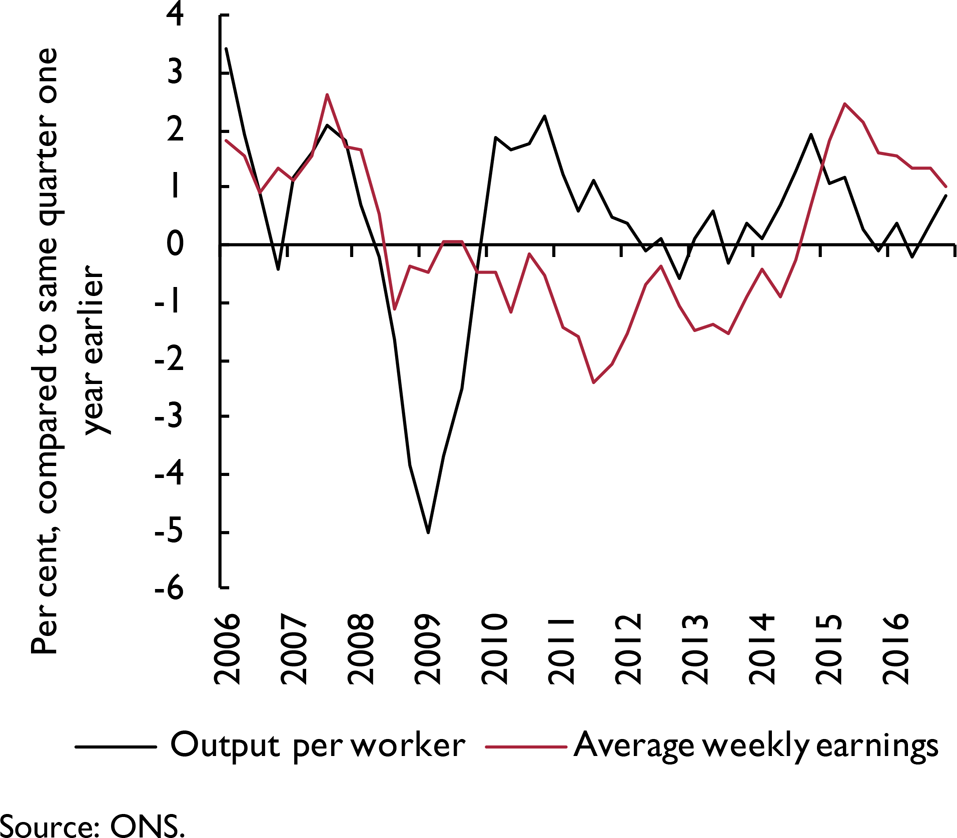
Figure 14. Growth of output per worker and average weekly earnings
The apparent lack of upward pressure on wages as unemployment has fallen is indicative of a downward shift in the equilibrium unemployment rate, that is the rate of unemployment that is consistent with stable inflation. The Bank of England's Monetary Policy Committee has revised its estimate of the equilibrium unemployment rate down from around 5 per cent to around 4½ per cent, see Inflation Report February 2017. Possible reasons for a reduction in the equilibrium unemployment rate include an increasingly educated population, a higher average age of the workforce, and tax and benefit reform that incentivise the transition from unemployment to employment.
The ONS classifies underemployed workers as those aged 16 and over and in employment who want to work more hours and are available to do so within two weeks. Similarly, overemployed workers are those who wish to reduce their hours worked. The underemployment rate, expressed as a proportion of total employment, has been declining since mid-2014 to reach 8.1 per cent in the final quarter of 2016. This remains significantly above the 2002–7 average of 6.7 per cent and indicates that some degree of slack remains in the labour market. The underemployment rate minus the overemployment rate turned negative in the second half of 2014 and was minus 2 per cent in the final quarter of 2016. Since this measure does not take into account the number of hours by which workers wish to increase or decrease their workload, it is difficult to infer much from this figure alone. In context, this is again considerably smaller in magnitude than the average of minus 3.7 per cent in 2002–7.
The Bank of England's Agents' Summary of Business Conditions reports that recruitment difficulties have increased slightly this year. Agents' scores are on a scale of −5 to +5, with a positive score indicating greater recruitment difficulties in the most recent three months compared to the situation one year earlier. This measure increased to 1.2 in January and 1.4 in February from an average of 1.1 in the final quarter of 2016. This is approaching the pre-recession average of 1.5 in 2000–7. This modest increase in recruitment difficulties despite very low unemployment rates is consistent with a reduction in the equilibrium unemployment rate. At present, we do not know whether EU citizens will continue to have access to the labour market following the UK's exit from the EU. A reduction in net migration would likely exacerbate recruitment difficulties. The assumption underpinning our forecast is that the population grows in line with ONS' principal projection, and does not assume decreased inward migration from the EU. This eventuality presents a key downside risk to our output forecast.
Investment intentions for the coming twelve months in both manufacturing and services picked up in February, indicating a modest increase in spending over the next year and may reflect a reduction in uncertainty about economic prospects in the near term (figure 15). However, these remain perilously weak compared to pre-recession averages. According to the Bank of England's Agents' Summary of Business Conditions, lack of clarity surrounding the UK's future trading relationships seems to be weighing on longer-term investment plans for some firms. The availability and low cost of credit has been supportive of investment but the sterling cost of some investment goods has risen due to recent exchange rate developments. Over the next couple of quarters we expect business investment volumes to fall before expanding from the end of 2017 onwards.

Figure 15. Investment intentions
Box C. Outlook for the consumer
Consumer spending has been buoyant throughout 2016, even during the period of heightened uncertainty following the referendum. Understanding why this has been the case will enable us to understand how the consumer spending pattern will evolve in the face of the pronounced pickup in inflation.
A key determinant of consumption is contemporaneous real personal disposable income (RPDI), that is real income post tax. This relationship is depicted in figure C1. As would be expected the co–movements of these series are positive. However, on a quarterly basis, RPDI is more volatile than consumption, suggesting that households smooth consumption in the face of temporary adverse shocks.
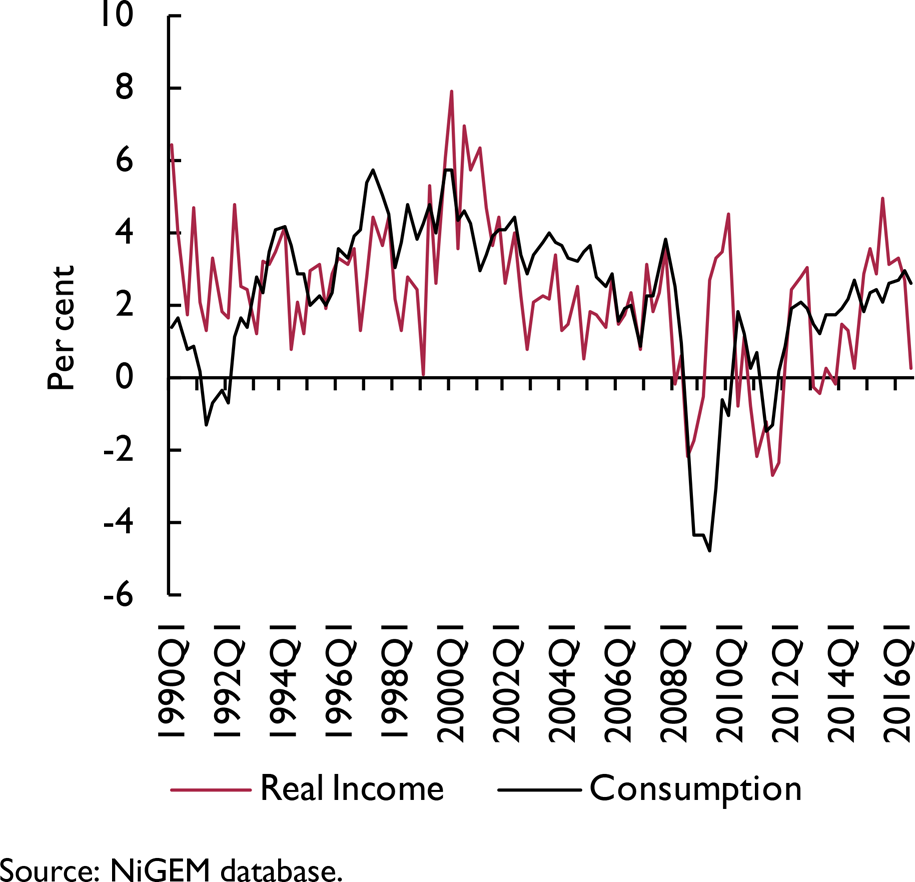
Figure C1. Consumption and real disposable income growth
An early explanation of household consumption was proposed by Reference KeynesKeynes (1936), who suggested that income was the main driver and the marginal propensity to consume from income is less than 1. Furthermore, he proposed that consumption had autonomous and secular components which drove the long and the short run respectively. There are a number of key critiques which can be applied to this theory. For example, it is noted that as incomes increase, the proportion that is consumed tends to decline. Additionally, this theory suggests there is no role for households to plan for the future, rather consumption is purely based on contemporaneous income. Finally, the consumption function implies that income and consumption in each period must move in the same direction, which as figure C1 shows is clearly not the case, at least in the short term.
An alternative theory which deals with some of these criticisms is Reference FriedmanFriedman's (1957) permanent income hypothesis (PIH). According to this theory, households consume a constant proportion of their expected permanent or long–run average income. This implies that households, when faced with a temporary shock which affects their income in the short run but not their permanent level of income, will reduce their consumption expenditures less than proportionally to the size of the temporary income shock. This leads to smoother consumption than would be implied by Keynes' theory. A second result from PIH is that, if households face uncertainty around future incomes, it will lead to an increase in the saving rate (Reference LelandLeland, 1968); this is known as precautionary saving.
The income effect on households is likely to be somewhere between the PIH and Keynes theorem, as it is improbable that households can fully differentiate between the permanent and temporary components of a shock. Furthermore, other factors such as financial market impairment may stop households from being able to smooth completely negative shocks to income.
As shown in figure C1, the experience of the UK during the ‘Great Recession’ was of a sharp fall in consumption, while RPDI fell less than proportionally to consumption, most likely as a result of increased precautionary saving. The subsequent recovery in RPDI was protracted, contracting on a year–on–year basis from the final quarter of 2010 to the final quarter of 2011, with a significant period of close to the historical average growth returning towards the end of 2014. The key element to the weakness of RPDI during this period was due to nominal wages, which grew on average by approximately 1 per cent annually between the end of 2010 and 2014, compared with 5⅓ per cent on average between the start of 1997 and the beginning of 2007. Furthermore, nominal wage growth remains significantly below the historical average with growth in 2015 and 2016 of just 1.3 and 2.9 per cent respectively. The broad picture of consumption during this period was also weak, only drawing close to the pre–recession average of around 3 per cent in 2015 and 2016. A key determinant of consumption going forward is therefore likely to be how nominal wages develop relative to inflation. If nominal wage growth remains sluggish as in recent history this will slow the growth of RPDI and therefore likely lead to a slowing in consumption.
While the path of RPDI is likely to determine the broad trend in consumption, a second facet is households' propensity to consume. As described earlier, changes in the propensity to consume can be affected by changes in households' uncertainty illustrated in figure C2, which plots the saving rate (adjusted for net equity holdings of households and insurance firms) alongside the unemployment rate, which we are using as a proxy for income uncertainty. As the figure shows, as unemployment increased with the onset of the recession, the saving rate jumped to around 6 per cent of GDP from 0.5 per cent in the previous quarter. The increase in precautionary saving implied by figure C2 accounts for a large proportion of the difference between RPDI and consumption during the recession. As such if households become more uncertain about their future incomes this may lead to an increase in precautionary saving and therefore a reduction in consumption.
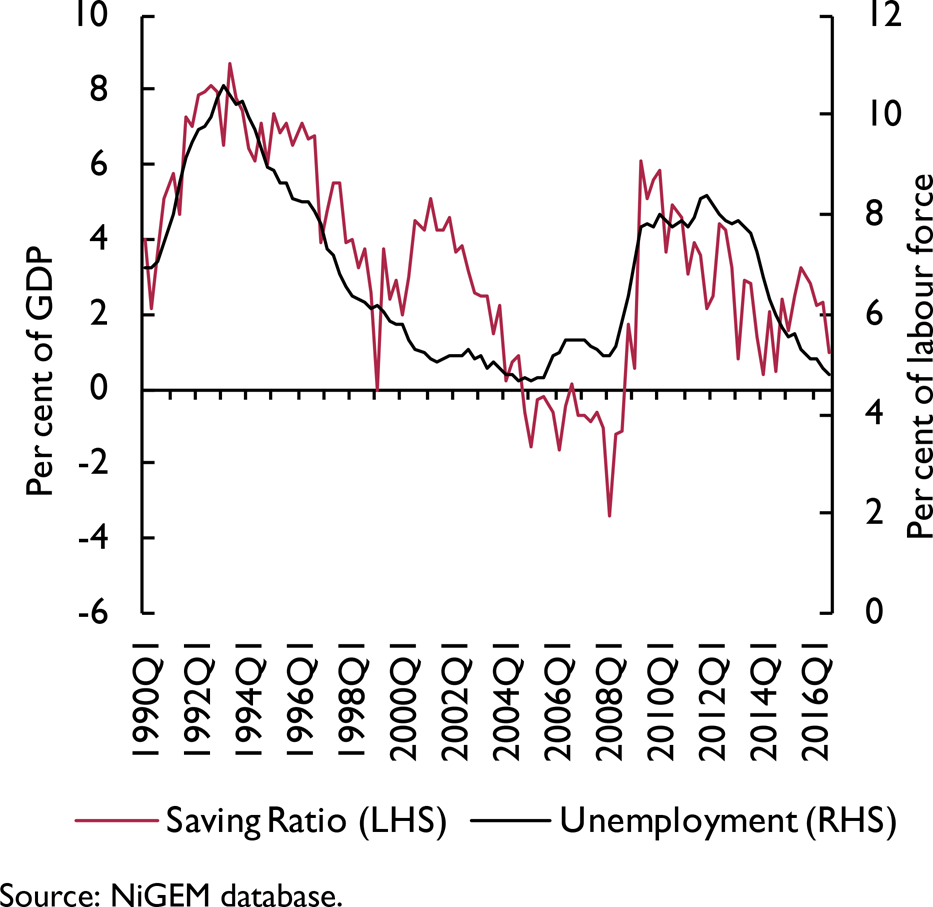
Figure C2. Saving ratio and unemployment
A final possible determinant of consumption presented here is the level of household indebtedness. As figure C3 shows, household debt peaked in the first quarter of 2008 at 160 per cent of income and has since fallen to around 140 per cent of income in the final quarter of 2016. Household debt is still large but sustainable, given the continuation of the exceptionally low interest rate period, and current communication from the Bank of England suggests that this will persist into the medium term. A tail risk around this is that a sharp interest rate rise would put pressure on household budgets which could lead to a fall in consumption. Furthermore, should interest rate rises lead to household debt becoming non–sustainable, the resulting increase in defaults could lead to financial intermediaries increasing the risk premia applied to household loans restricting the ability of households to smooth consumption.
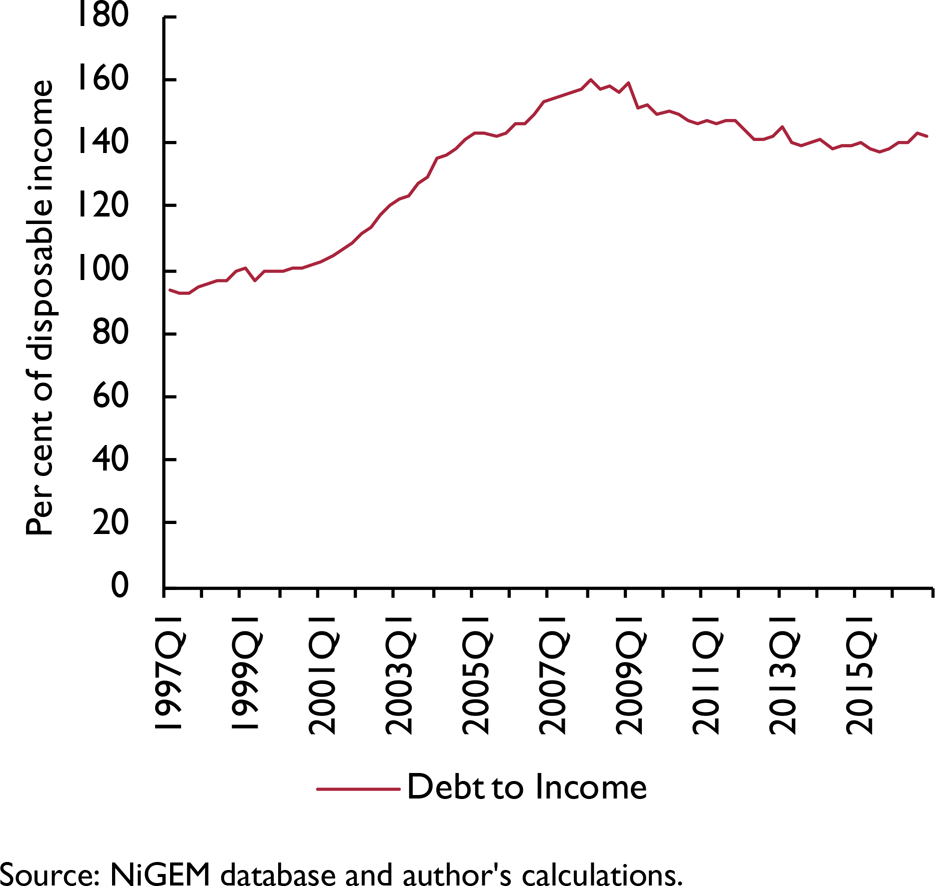
Figure C3. Household debt to income ratio
The previous paragraphs provided a brief description of the likely drivers and risks around the future path of household consumption. As consumption statistics for the UK are produced quarterly, it is useful to have statistics produced at a greater frequency to provide an early indication of consumption behaviour.
The retail sales index is one such indicator; it is released on a monthly basis with around a one month lag from the end of the calendar month. Retail sales therefore represent the earliest official indicator available to help gauge household consumption purchases. Like consumption, retail sales growth was weak for a significant number of years after the Great Recession, picking up in 2014 and intensifying thereafter with annual growth in excess of 4 per cent in 2015 and 2016. This trend appears to have come to an abrupt halt in the first quarter of 2017, when the volume of retail sales contracted by 1.4 per cent. This is the first quarterly contraction since the fourth quarter of 2013 and the largest since the first quarter of 2010, which suggests that consumption in the first quarter will be weak. There are a number of caveats when interpreting aggregate consumption behaviour from this series, firstly, the volume of retail sales represents one third of the consumption basket, and does not distinguish between sales which are recorded as exports in national accounts, i.e. purchases from retailers by foreign tourists. A second point to mention is that the contemporaneous correlation between these two series is relatively weak at around 0.4, with retail sales, especially post 2010, being significantly more volatile.
A second set of interesting indicators are found in survey series, especially those which focus on the outlook for the consumer. A selection of these, which attempt to deal with different aspects of the consumer outlook and different time horizons, contemporaneous and one year ahead, are illustrated in figure C4. Although, unlike the retail sales data, surveys do not constitute hard data, they have the advantage that they are timelier, published with no lag at the end of the calendar month. One thing to note from figure C4 is that each of these, despite the alternative expectational content, co–move strongly. When comparing the forward looking series on economic outlook and personal financial situation against the contemporaneous consumer confidence we find correlations of 0.73 and 0.85 respectively, which may indicate only limited forward looking content. However, against the quarterly path of real consumption, the confidence and personal financial situations have reasonable contemporaneous correlations of 0.6 and 0.52 respectively, suggesting that they provide at least some information in which to gauge the direction of consumption.
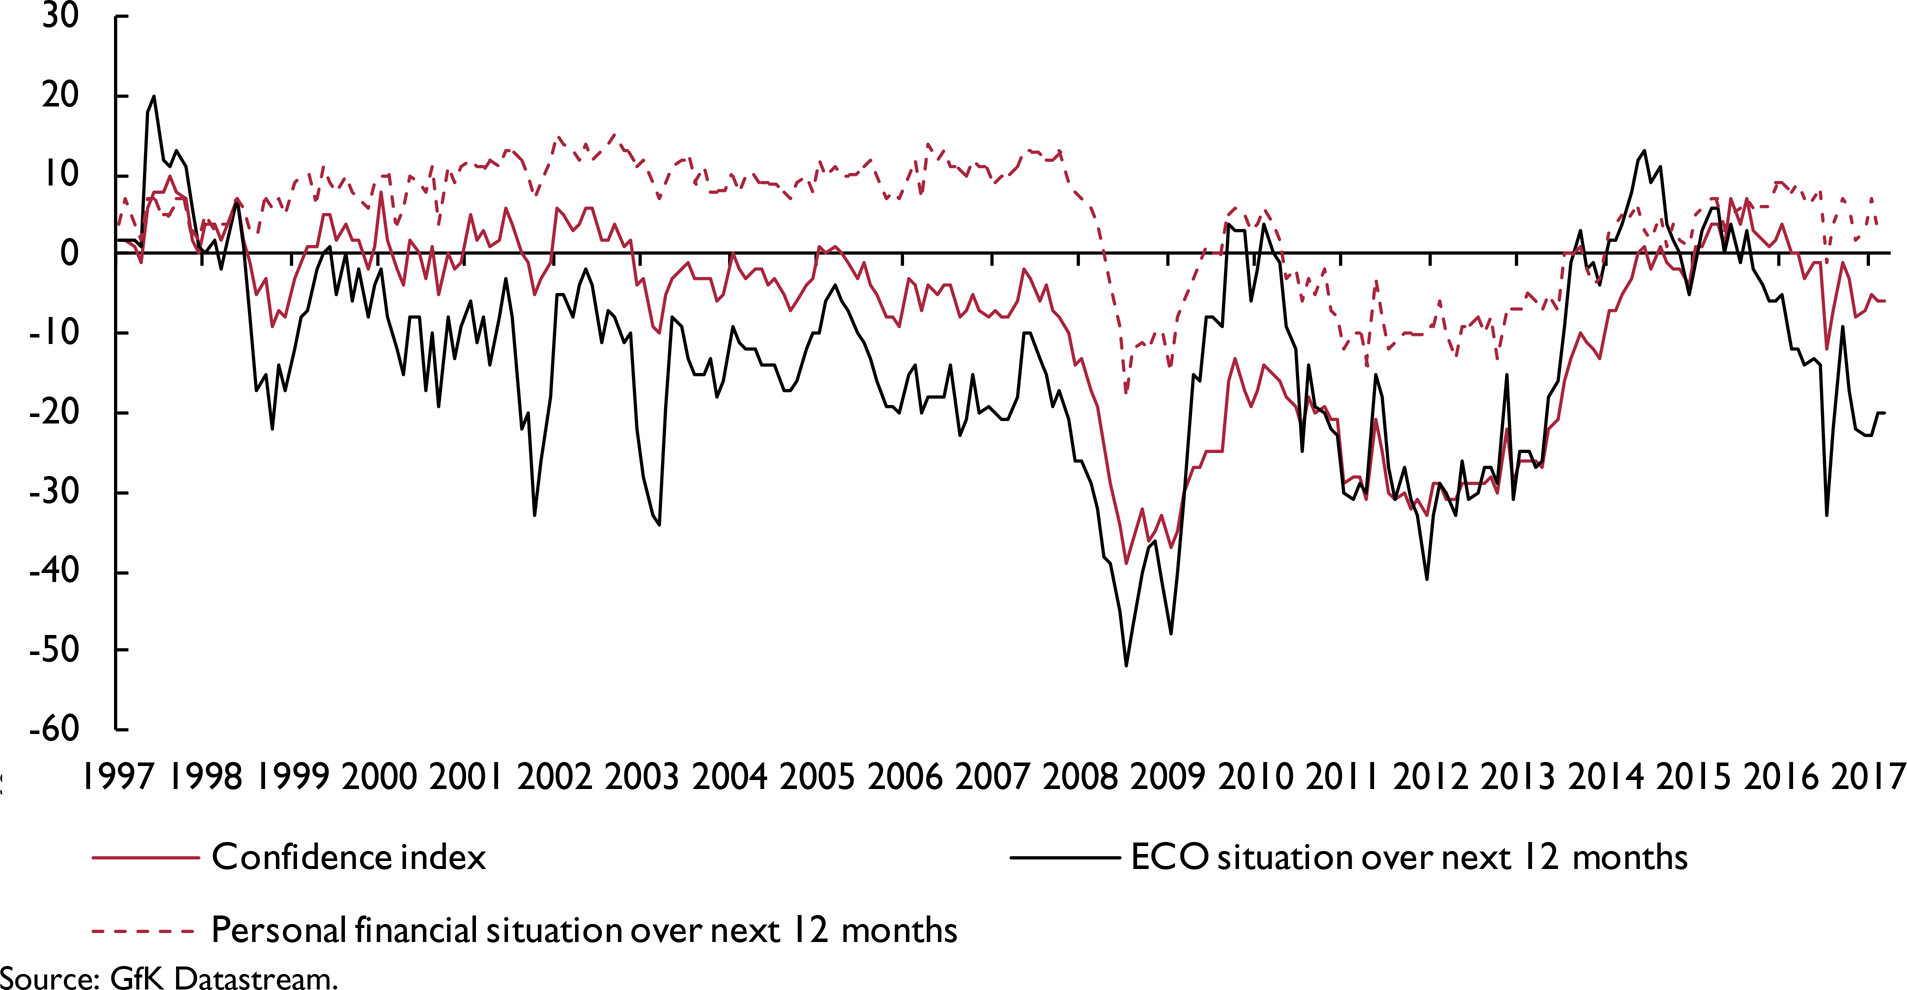
Figure C4. Consumer surveys
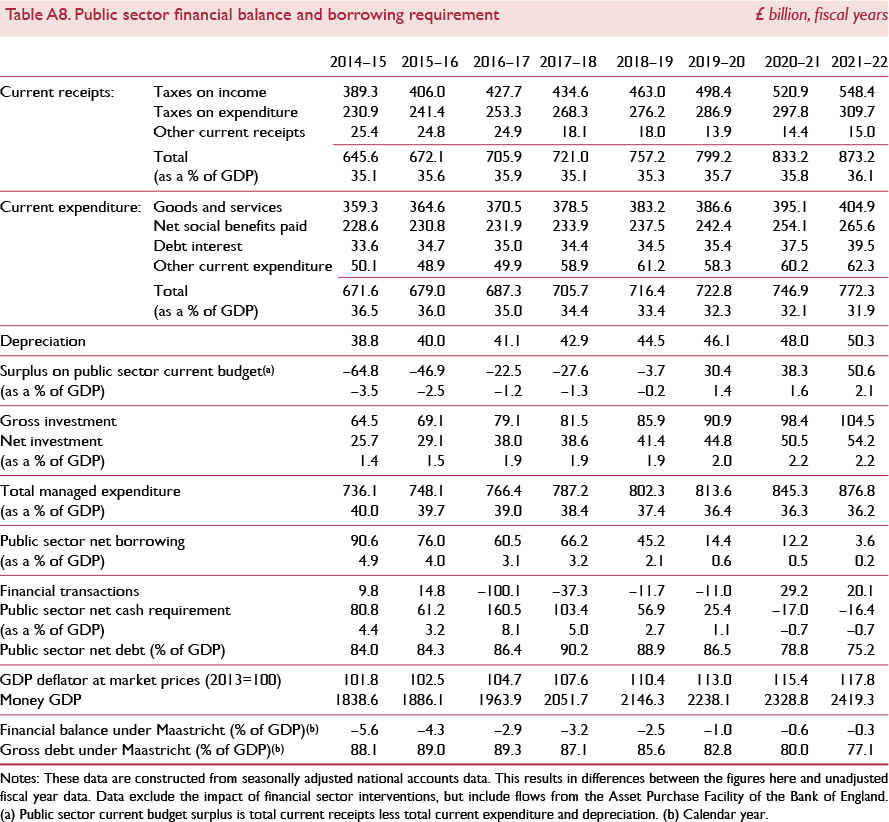
Public finances
The ONS has released statistics for the fiscal year 2016–17 which indicate that public sector net borrowing (excluding public sector banks) decreased by £20.0 billion to £52.0 billion, compared with the previous fiscal year; this is the lowest net borrowing since the fiscal year ending March 2008. Public sector net debt (excluding public sector banks) was £1,729.5 billion at the end of March 2017, equivalent to 86.6 per cent of GDP, an increase of £123.5 billion compared to March 2016. The central government net cash requirement, which represents the cash needed to be raised from the financial markets over a period of time to finance the government's activities, increased by £0.4 billion to £61.1 billion, the highest central government net cash requirement since the fiscal year ending March 2015.
Our fiscal forecasts are based on spending and taxation plans announced in the Spring Budget 2017. We use the spending assumptions outlined in the OBR's most recent Economic and Fiscal Outlook. Tax receipts and interest payments are determined endogenously within our model. Plans to increase the National Insurance contribution from self-employed people were announced in the Spring Budget but subsequently dropped following opposition due to the apparent contravening of a 2015 general election manifesto commitment not to raise National Insurance, income tax or VAT. We have adjusted our tax assumptions accordingly.
The Spring Budget contained few significant spending or taxation announcements. It did however include measures aimed at reducing tax avoidance, including the introduction of penalties for tax professionals who assist others in avoiding tax, and rules preventing businesses from converting capital losses into trading losses. A reduction in the tax free dividend allowance from £5,000 to £2,000 and the introduction of a sugar tax are also expected to increase tax revenue.
The Bank of England's TFS provides an alternative source of funding to UK banks. Through this scheme, the Bank will provide loans of up to £100 billion in total to eligible banks and building societies at rates close to Bank Rate for four years. The newly created central bank reserves are classified by the ONS as public sector net debt. However, the Bank will pass on the interest charged on these loans to the Treasury, reducing public sector net borrowing. This implies an increase in public sector net debt to GDP of around 5 percentage points, were the scheme to be utilised in full. Current uptake has reached just under £60 billion.
Our projections for public sector net borrowing have been revised downwards slightly from our February Review. We expect the deficit to decline throughout our forecast period, from 3.2 per cent of GDP in the 2017–18 fiscal year to 0.2 per cent in 2021–2. Public sector net debt to GDP is expected to peak at 90.2 per cent in 2017–18, after which growth in nominal GDP exceeds that of government borrowing. We forecast public sector net debt of around 75 per cent of GDP in 2021–2, due to a combination of low borrowing, stable nominal GDP growth and ending of the TFS.
On average the UK paid £7.1 billion per year, net, into the EU between 2010 and 2014. In the absence of any information on the likelihood of the UK remaining in the single market, our current assumption is that from the second quarter of 2019, the UK will no longer make a net contribution to the EU budget. This assumption introduces considerable upside risk to our public sector net debt and borrowing forecasts.
Irrespective of whether the UK continues to contribute to the EU budget there is a potential contribution from the UK that forms part of the ‘divorce settlement’. According to the EU Commission this is one of the first items on the negotiating agenda. With a precise number to be determined, this poses a further risk to the outlook for the public finances. If a financial liability is determined by the negotiated withdrawal then the seriousness of the impact on the UK's public sector borrowing and debt profiles will be determined by the timescale over which this obligation is met.
Saving and investment
The balance of payments of the current account measures the amount of finance required by the economy in order to fund domestic investment plans. The current account can be decomposed using two different approaches. Table A9 shows the disaggregation into the saving and investment positions of three broad sectors of the economy: household, corporate and government. Alternatively, it can be decomposed via the respective underlying balances: the trade balance, defined as the difference between the value of exports and imports; the primary income balance, which captures earnings on foreign investments minus payments to foreign investors; and the secondary income balance, which informs us about the transfers between the UK and other countries. This decomposition is illustrated in figure 16.

Figure 16. Current account decomposition
Since the final quarter of 1998, the UK has consistently run a current account deficit. Between the first quarter of 1998 and the first quarter of 2012, the deficit on the current account was broadly stable, averaging 2.1 per cent of GDP. Since then, the deficit has widened significantly and averaged 4.3 per cent of GDP. The largest post Second World War current account deficit was reached in the final quarter of 2013 at 6 per cent of GDP.
The trade balance, remained broadly stable, averaging just under 2 per cent of GDP beween 2014 and 2016 compared to an average of 2.4 per cent of GDP since 2001. However, a closer look into the components of the trade balance shows there have been two competing forces; on the one hand, the deficit on the balance of trade in goods has been widening on a continuous basis since 1998, while on the other, the surplus on the balance of trade in services has also widened, partially offsetting the deficits of the former.
The key driver of the deterioration of the current account balance has been the primary income balance. Historically, it has recorded a surplus for the UK economy; from the first quarter of 1955 to the first quarter of 2012, it averaged 0.4 per cent of GDP. However, in the second quarter of 2012 this shifted to a deficit and reached a nadir of 2.6 per cent of GDP in the final quarter of 2015, the largest recorded. While the underlying cause of this deterioration remains largely unexplained, a possible explanation is based on a redomiciling effect (see Reference FitzgeraldFitzgerald, 2013, and Reference LaneLane, 2015), where firms relocating their operational headquarters across country borders may increase debits to foreign countries, thus lowering the primary income balance, without actually shifting activity. Reduced rates of return from foreign assets may have also lowered the income credits accrued from foreign assets held.
In the final quarter of 2016, the current account deficit declined markedly to 2.4 per cent of GDP, from 5.3 per cent in the previous quarter. This represents the smallest deficit recorded since the second quarter of 2011. There was an improvement in all broad subcomponents of the current account. The deficit on the primary income balance fell to 0.2 per cent of GDP from 0.9 per cent in the third quarter of 2016, as a result of an increase in credits coming from earnings on foreign direct investment (FDI) and a decline in debits. The secondary income balance shrank marginally to 1.3 per cent of GDP from 1.4 per cent. The trade balance provided the largest contribution. The balance of trade in services improved by 0.4 percentage point to 5.4 per cent of GDP, while the deficit on the balance of goods improved by 1.7 percentage point to 6.4 per cent of GDP.
Given the sharp depreciation of the pound following the referendum, an improvement in the trade balance may not be unexpected, as UK exporters gain in price competitiveness. However, a key underlying component of this improvement is the erratics component of the goods balance, specifically, non-monetary gold (see the Demand Conditions section of this Chapter), which explains around 1/3 of the increases in exports, with a further 20 per cent being attached to an increase in exports of oil goods.
ONS data on trade for the first two months of this year suggest that this hasn't continued into the first quarter. The erratic component has returned to deficit, exports of goods have fallen slightly and imports have increased. In fact, the sum of the deficits of the trade balance for January and February is already greater than that of the final quarter of 2016, suggesting that, at least for the first quarter, we will see the current account deficit widen again.
As mentioned in both the November 2016 and February Reviews, the effect of the sharp depreciation of sterling has had a sharp impact on the UK's net international investment position, through revaluation effects. As a result of the depreciation, the value of assets denominated in foreign currency has increased markedly while those denominated in sterling are unchanged. Accordingly, in the final quarter of 2015 the net international investment position (NIIP) recorded a deficit of 4.6 per cent of GDP which, by the final quarter of 2016, had turned into a record surplus of 23.7 per cent of GDP, predominantly due to exchange rate developments. Although this is likely to fall somewhat as a result of the appreciation of sterling since October, the increase was in excess of what we had envisaged and we have therefore revised up our forecast. We now expect the NIIP to be 10.8 and 7.9 per cent of GDP on average this year and next respectively, which compares to 6.3 and 4.7 from our previous forecast. Consequently, within the primary income balance, we should see the rate of expansion of credits outpace that of debits, and as a result we expect the primary income balance to return to surplus in the middle of 2017 and to continue to improve thereafter. For 2017 and 2018, we expect an average surplus of 0.1 and 1.4 per cent of GDP, respectively.
Overall, we expect a general improvement in the current account balance throughout this year and next. Alongside the improvement in the primary income account balance, we expect there to be an improvement in the trade balance, as a result of weak growth in imports arising from tepid domestic demand as well as a moderate pick-up in export growth driven by the gains in price competitiveness. The deficit on the trade balance is expected to be around 1.9 per cent of GDP this year and to improve to 1.1 per cent of GDP in 2018. These are broadly in line with our February forecast. Together this implies that we expect a deficit on the balance of payments of the current account to be 3.2 per cent this year, falling to 1.3 per cent in 2018.
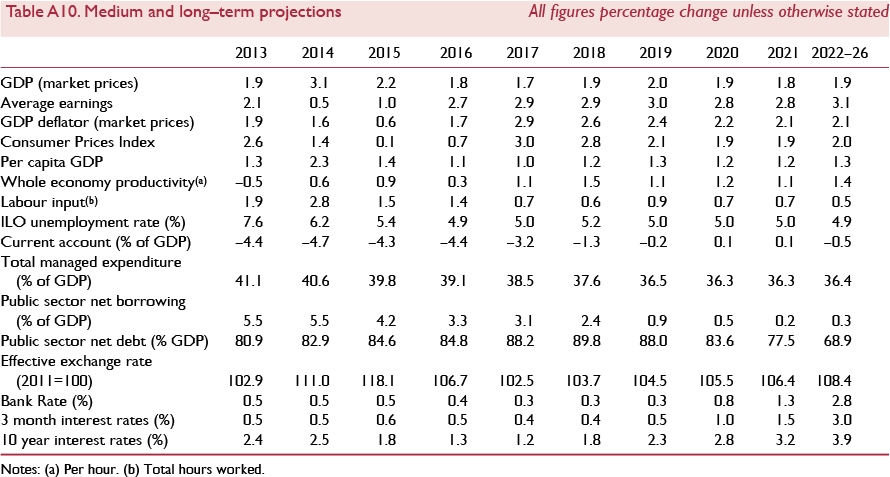
Medium-term projections
In table A10 we outline our view of how the UK economy transitions from its current disequilibrium. As with our previous Reviews, after the referendum on the UK's relationship with the European Union, the nature of the trading relationship between the two parties is likely to define the long-run equilibrium of the economy. This picture has been further complicated by the upcoming General Election on 8 June, the result of which will likely provide greater details about the negotiating position of the UK. However, in the absence of further information, we maintain our assumption that the modal path in the long run centres around an EFTA type agreement (see Reference Ebell and WarrenEbell and Warren, 2016, for further details). As the negotiations unfold and the relative positions of the UK and EU become clearer we will update our assumptions accordingly.
Alongside the uncertainty surrounding the exact long-run position of the economy, the path to this equilibrium is also uncertain, as shocks, which are unpredictable by definition, buffet the economy away from this path. We chose to depict this uncertainty in the form of fan charts; figure 2 shows that there is a 0.1 probability of growth less than 0.8 and a probability of 0.1 of growth greater than 2.7 in 2017.
The most significant change in our forecast since the February edition of the Review is once again that of the exchange rate as measured in trade weighted terms. The effective exchange rate reached its nadir in October and has since appreciated. Following the announcement of the upcoming general election, the effective exchange rate jumped and stabilised around 1 per cent above the level prior to the announcement. Accordingly we have revised our forecast for exchange rates upwards by 2.8 and 3.6 per cent this year and next when compared with our February forecast. The new path implies that, on average, in 2017 the exchange rate will be 3.9 per cent lower than it was in 2016, but will appreciate by 1.2 per cent in 2018, and then between per cent per year on average through to 2026.
The path of the exchange rate has implications for consumer prices, since it affects the cost of imported goods and services. Due to the stronger outlook for the pound, we have revised down slightly our projections for consumer price inflation, which we expect to peak at around 3.4 per cent in the final quarter of 2017, compared with 3.7 per cent in our February forecast. As the pass-through from the depreciation in the middle of 2016 completes, we expect inflation to return towards the Bank of England's mandated 2 per cent inflation target, reaching 2.1 per cent in 2019. Between 2022 and 2026 we expect consumer prices to average 2 per cent per annum.
Our forecast for average earnings remains broadly unchanged in comparison with our forecast from February. We expect average earnings to remain relatively subdued, with growth of 2.9 per cent this year and next, and to continue to grow at this rate thereafter. Between 2022 and 2026 we forecast average wage growth of around 3 per cent per annum.
Our inflation forecast implies that, in the near term, real wages will contract in 2017 and remain flat in 2018 before returning to a long-run path of real wage growth of around 1 per cent per annum between 2022 and 2026. We expect this to have a near-term impact on domestic demand, especially on consumption, which is expected to grow by 1.5 per cent this year, revised upward from 1.2 per cent due to a strong data outturn in the final quarter of 2016, before being broadly flat next year. As real income growth returns we expect consumption to pick up, growing by around 2.4 per cent per annum between 2022 and 2026.
Given the expected moderation in household consumption and the fact that, despite the recent appreciation, the exchange rate still remains significantly lower than prior to the referendum, we forecast an improvement in the current account balance. We expect this improvement to manifest itself in both the trade balance and the primary income balance. The improvement in the trade balance occurs as import volumes are expected to be flat in 2017 and contract by around 2 per cent per annum in 2018. Despite the gains in competitiveness for exporters, we project only moderate export growth of around 1.8 per cent per annum. Overall, we expect the trade balance to improve from a deficit of 1.9 per cent of GDP in 2017, to a deficit of 0.4 per cent of GDP in 2019. From there, as import growth picks up, the deficit once again widens. From 2022–6 we forecast the deficit of the trade balance to be around 1.5 per cent of GDP.
The primary income balance is expected to achieve surplus in the latter part of 2017, reaching 1.4 per cent of GDP in 2018. Between 2022 and 2026 we forecast the surplus on primary income to average 2.5–3 per cent of GDP. This implies the current account balance will improve in each year to 2019, at which point it will reach balance. Thereafter, the widening deficit on the trade balance leads to a moderate deficit which averages around 0.5 per cent of GDP from 2022–2026.
While the underlying components of the domestic and external sectors are marginally different from our February forecast, our path from GDP remains unchanged. We forecast relatively subdued growth this year and next, of 1.7 and 1.9 per cent per annum respectively, and for output to continue to grow at around its potential rate, which we estimate to be about 2 per cent per annum through to the end of our forecast period.
We expect unemployment to increase slightly in the near term, from a low of 4.7 per cent in the first quarter of 2017 to approximately 5.3 per cent in the first quarter of 2018. Underlying this is the assumption that real wages are downwardly flexible as implied by our wage forecasts. Should labour market participants seek to protect wages rather than employment we would expect to see a greater increase in unemployment. From 2019 onwards we forecast unemployment to return to its equilibrium level of around 4% to 5 per cent, where it remains throughout our forecast period.
A key risk to our forecast remains the poor performance of productivity. Whole economy productivity was sluggish in 2016 with growth of only 0.3 per cent per annum, significantly below our February forecast of 0.7 due to revisions. As a result we have revised our projections for productivity growth down this year to 1.1 from 1.4 per cent per annum, after which it remains broadly unchanged from our February forecast. Between 2022 and 2026, we forecast whole economy productivity growth of around 1V per cent per annum, which still remains low compared to history; for example, between 1998 and 2007, productivity grew on average 2.2 per cent per annum.
Our fiscal forecasts remain broadly consistent with those in February, with government net borrowing falling throughout our forecast period from 3.1 per cent of GDP in 2017 until 2021 when it stabilises, between 2022 and 2026 we expect government net borrowing to average between ¼ and ½ per cent of GDP. This implies that public sector net debt will peak in 2018 at close to 90 per cent of GDP, before gradually declining thereafter. Between 2022 and 2026 we forecast government net debt to average around 70 per cent of GDP.
Our forecasts for monetary policy remain unchanged from our February forecast. We expect the Bank of England to look through the short-term spike in inflation generated by the depreciation of sterling from the middle of 2016, and to keep interest rates unchanged at 0.25 per cent. Thereafter we project interest rates to rise slowly, at on average 50 basis points per year. This implies that between 2022 and 2026 the Bank of England's policy rate will average 2.8 per cent.
Box D. Political economics
On the eve of the Brexit referendum, Reference Armstrong and PortesArmstrong and Portes (2016) said that a vote to leave the EU would alter the course of British and European history. One year later, this seems no exaggeration.
Members of Parliament voted by 498 to 114 in favour of the European Union bill which enabled the Prime Minister to trigger Article 50 of the Lisbon Treaty. This starts the process of withdrawing from the EU by March 2019. The only exceptions to this timetable are if member states unanimously agree to extend the timetable or the UK withdraws its notice to withdraw (although this may require a ruling over whether this is permissible). The Secretary of State for Scotland was the only Member of Parliament to vote for the Government and the bill.
In her speech to the Conservative Party conference in October last year, the Prime Minister interpreted the Brexit vote as a demand to limit immigration from the EU and to leave the jurisdiction of the European Court of Justice (ECJ). As the ECJ adjudicates over EU treaties, it is the final arbiter of matters concerning Single Market rules. The Prime Minister's interpretation means that the UK would be leaving the Single Market. This is despite some of the most prominent pro–Brexit campaigners making the case that the UK would remain part of the Single Market.
A second independence referendum?
The UK parliament has full legal authority over issues of sovereignty. Therefore, the outcome of the EU referendum applies to the whole of the UK, irrespective of the voting in each of the constituent nation states. Moreover, before the Scottish independence referendum in September 2014 it was agreed by all sides that it was a ‘once in a generation’ vote and that the outcome would be respected. From this perspective, there would seem to be no reason for a second independence referendum. However, the Scottish National Party (SNP) changed its position in its manifesto for the 2016 Scottish Parliament elections. The SNP's manifesto said that ‘the Scottish Parliament should have the right to hold another referendum. … if there is a significant and material change in circumstance that prevailed in 2014, such as Scotland being taken out of the EU against our will’. The SNP won 63 of the 129 elected seats in the Scottish parliament.
In the EU referendum 62 per cent of Scots voted in favour of ‘Remain’. Given the stated aim of the SNP, the issue of EU membership and independence may have been conflated in some voters' minds. Those who want a second referendum might have been more inclined to have voted ‘Remain’.
In December 2016, the Scottish government published a report making the case for staying in the Single Market as a second–best option to EU membership. Its proposal that the UK should remain in the European Economic Area and the Customs Union flatly contradicts the stated UK policy of leaving the jurisdiction of the European Court of Justice. Its alternative proposal is that Scotland (and possibly Northern Ireland) would remain in the Single Market while the rest of the UK leaves the Single Market. This would imply two sets of regulations, most likely customs checks and two different ultimate courts.
Political legitimacy
All unions require political legitimacy to survive. How might this have changed with Brexit? Scotland's First Minister has argued that the lack of effective consultation by the Prime Minister and the UK government's preference for a ‘hard Brexit’ is contrary to the wishes of Scotland and a material change in circumstances. On 28 March, the Green Party and SNP together voted 69 to 59 in favour of seeking permission from the UK Parliament to grant the Scottish Parliament powers to hold a second independence referendum before spring 2019. The Prime Minister has pushed back, stating that ‘now is not the time’.
There are reasons to question the political legitimacy of the Westminster parliament deciding the post Brexit policy without reflecting on regional preferences. First, on leaving the EU the UK will re–establish its own WTO schedule of tariffs and quotas. This is most likely to be through a process of rectification (effectively, copy and pasting) of the EU's schedule. Thereafter, the UK will be able to charge lower effective tariffs (WTO schedules are an upper bound) and negotiate, or even unilaterally, set a lower tariff schedule.
However, commercial policy (also called trade policy) has a direct counterpart with domestic policy. For example, a tariff is a combination of a production subsidy and a consumption tax. Changes in commercial policy have domestic consequences, or changes in domestic policy can have consequences for commercial policy. This matters because industries are not uniformly distributed across the UK. Therefore, some regions may gain or lose more than others. The map in figure D1 below shows the regions where the labour force is employed in sectors with more than 10 per cent effective tariffs – and therefore with most to lose.

Figure D1. Labour force facing EU tariffs above 10 per cent
Second, some economic powers have been devolved to sub–central government. For example, fisheries and farming policies are largely devolved to Scotland. Yet changes in commercial policy would contradict these devolved powers and may change the intended direction of policy. The tradition of the Sewel Convention is that permission of the Scottish Parliament (or another sub–central parliament) would be sought. But this would effectively hand local Parliaments a veto over commercial policy.
Third, politics between Scotland and the rest of the UK has become increasingly polarised. The morning after the Scottish independence referendum, Prime Minister Cameron opted for introducing ‘English Votes for English Laws’ over reconciliation. Reference Armstrong and EbellArmstrong and Ebell (2015) note that the large imbalance in economic power may result in a loss of economic efficiency. The outcome of the forthcoming General Election may be even greater polarisation in politics north and south of the border. There is possible common ground whereby the UK returns to European Free Trade Area membership, which would also be agreeable to the Scottish government.
Economic consequences
The consensus among economists is that there will be an economic cost to Brexit (see Reference Armstrong and PortesArmstrong and Portes, (2016). Some economists have argued that if Scotland remains in the Single Market this cost could be avoided and so there is a “much stronger” economic case for independence than in 2014. If the UK leaves the Single Market, its regulations and tariffs are likely to diverge from the EU over time. An independent Scotland would have to decide between being in a single market with the UK or the EU (assuming this would be politically viable) but not both.
The EU is the largest single market in the world. Yet trade, investment and migration between Scotland and the rest of the UK is far higher than with the rest of the EU. Scottish Government experimental non–oil trade data show that 63 per cent of Scotland's exports are to the rest of the UK and only 16 per cent to the rest of the EU. Scotland trades more outside of Europe than with the EU excluding the UK. The total amount of Scotland's non–oil external trade (including to the rest of the UK) is larger than its national output. Therefore, trade and regulatory barriers would matter to Scotland's prosperity.
Exports between Scotland and the rest of the UK are mostly in services. Exports from Scotland to the rest of the EU are divided between services and goods. Free Trade Agreements are much easier for goods than for services. Even the deepest trade agreements have limited coverage of the service sector. Migration flows between Scotland and the rest of the UK are also 50 per cent higher than with the rest of the world. Based on the amount and type of bi–lateral trade it is more important that Scotland maintains an economic union with the UK than the rest of Europe.
In the 2014 referendum the lack of credible currency plan proved to be a critical weakness. In a series of papers Armstrong and Ebell (e.g., Reference Armstrong and EbellArmstrong and Ebell, 2014) showed how high levels of public debt combined with using the currency of another sovereign state can lead to unstable equilibria. This instability argument is more powerful for nations with large financial systems, persistent borrowing needs and a significant amount of output dependent on the vagries of international markets.
Even though there is no pooled EU debt, the UK must honour its share of financial commitments taken collectively with EU partners. If Scotland leaves the UK the least that would be expected is that Scotland takes its fair share of existing UK debt. Prior to the last referendum, a population share of public sector net debt would be equivalent to 70 per cent GDP and the estimated fiscal deficit of a separate Scotland of 8 per cent of GDP (including a geographic share of North Sea oil). The comparable figures for 2015–16 are an 83 per cent net debt ratio and a 9.5 per cent fiscal deficit including North Sea oil. The key figures have deteriorated over the past two years.
The currency options for an independent Scotland are at least as great a challenge. Prior to the 2014 referendum, it was reported that former Bank of England Governor King was sympathetic to an independent Scotland continuing to use Sterling. In a recent Newsnight interview he made clear that this would be a currency board arrangement, rather like Panama or Hong Kong. The former has had 17 IMF programmes while the latter has delivered fiscal surpluses every year except one since 1983. If Scotland were to receive a population share of foreign exchange reserves this would only cover 9 per cent of retail deposits.
Another option is that an independent Scotland could re–introduce the Scottish pound (or a modern equivalent). However, advocates ought to point out whether they would expect the currency to appreciate or depreciate against the UK pound. The combination of high fiscal deficits, a large debt issuance programme and greater transaction costs from trading with the rest of the UK (not to mention trade restrictions) and a worse recent productivity record all suggest that the Scottish pound would devalue versus the UK pound. This may be the price of independence.
Neverendum?
The relative performance of Scotland's economy since the independence referendum is disappointing. The Scottish government's experimental National Accounts data presented in figure D2 shows output per head in Scotland relative to the UK (including Scotland) rebased to the date of the referendum. The Scottish economy performed relatively well in the two quarters after the referendum but in the subsequent seven quarters has failed to grow. The divergence with the UK is becoming marked. This is the onshore output and not directly affected by the fall in oil prices. To make this point another way, figure D3 shows the evolution of house prices on the same basis. The malaise in Scotland's economy appears to go beyond energy services.

Figure D2. GDP per head
Figure D3. House prices (2014Q4=100)
In the May 2015 General Election, the SNP achieved an extraordinary landslide winning 56 of the 59 elected seats. This is an increase of 50 seats in five years. The dominance of the SNP may have meant that the prospect of a second referendum never really receded. There is a possibility that the uncertainty and economic challenges mentioned above weigh on the economy. The Canadians introduced the term ‘neverendum’ to describe the ongoing uncertainty and cost of successive independence referenda in Quebec. Given that the Prime Minister has made clear that now is not the time for a second referendum it may well be that the uncertainty persists for some time.
Appendix – Forecast details
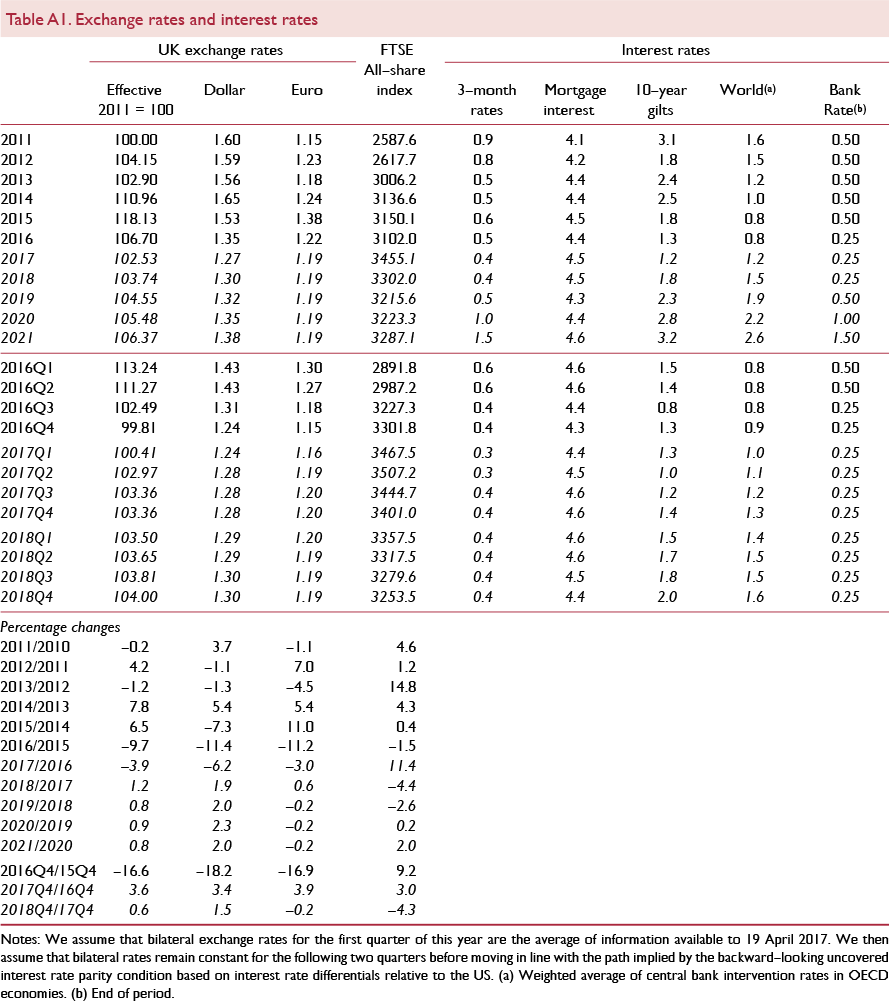
Figure A1. Household inflation expectations for the year ahead have edged up

Figure A2. Private and public sector nominal wage growth remain subdued
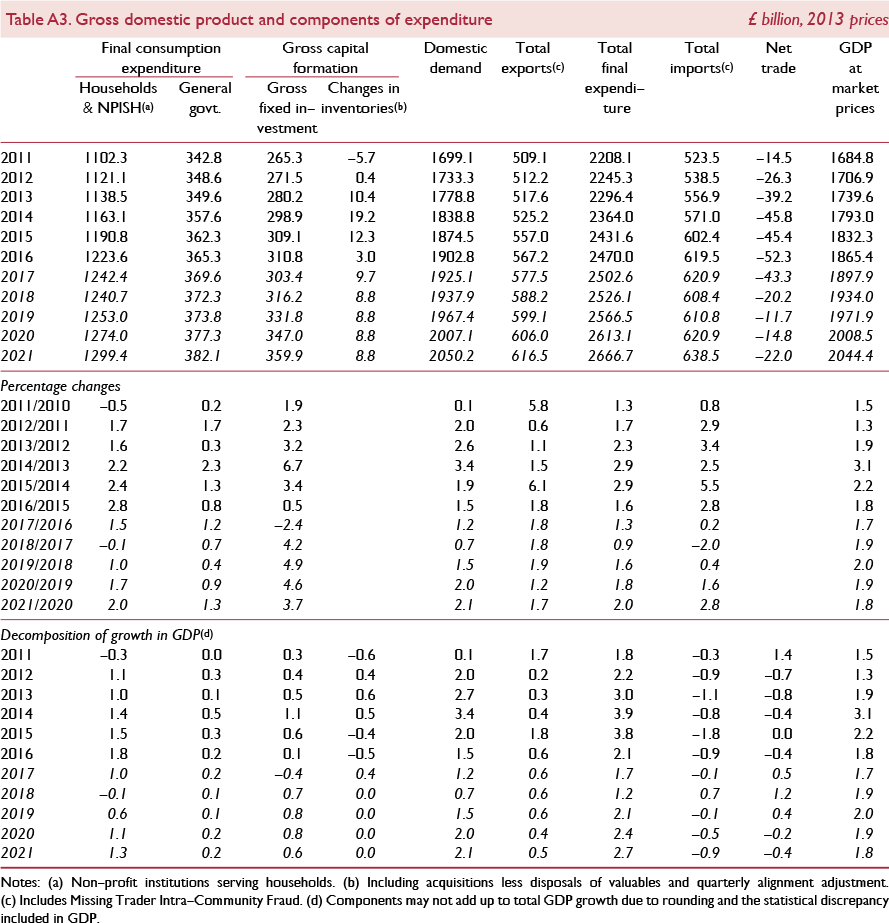
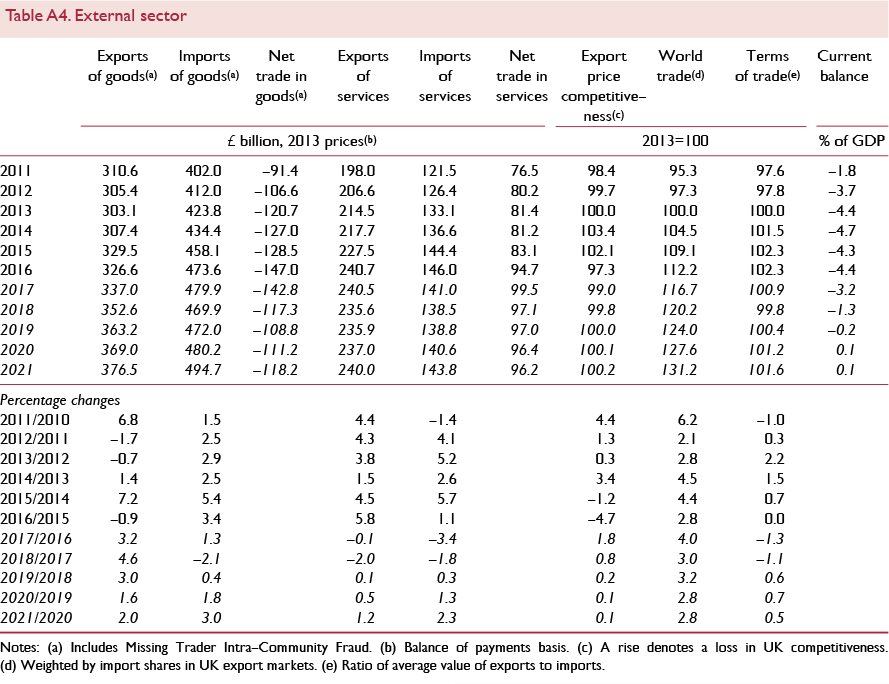

Figure A3. Goods exports volumes to the EU are close to levels last seen in 2007

Figure A4. Per capita consumer spending is expected to reach its pre–recession peak in 2020 (2007Q4=100)
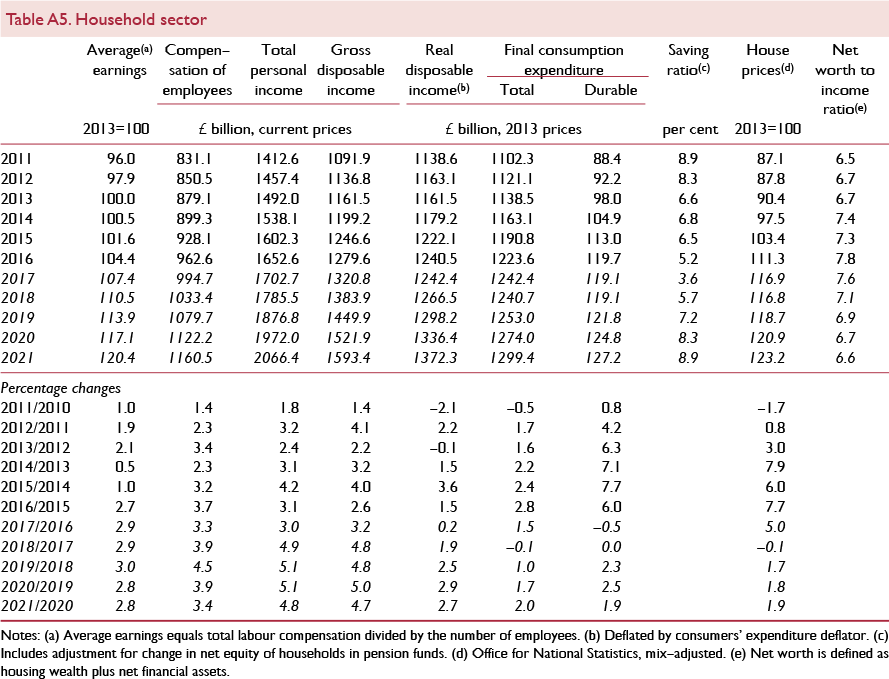

Figure A5. Household income gearing

Figure A6. We expect households' propensity to save to rise over the medium term (per cent of gross disposable incomes)
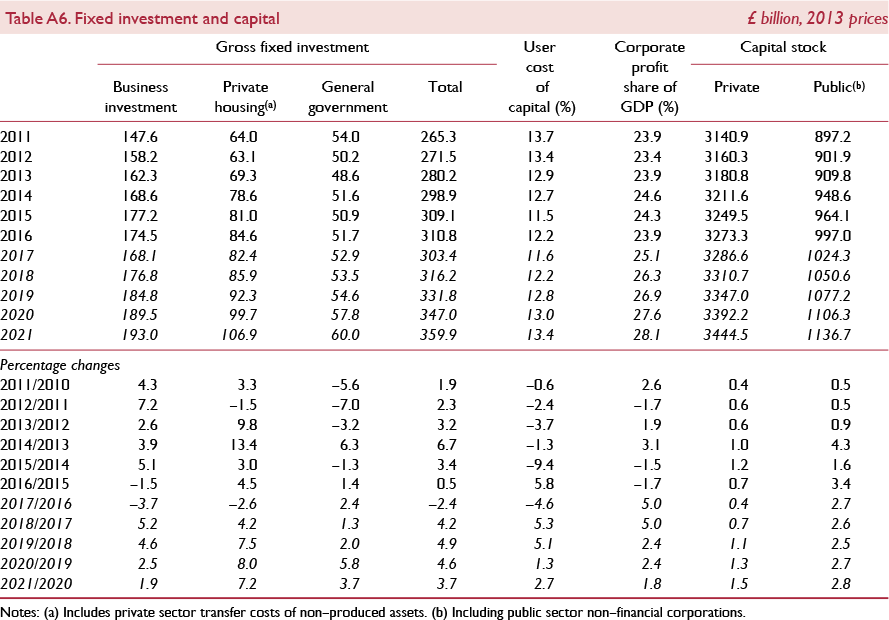
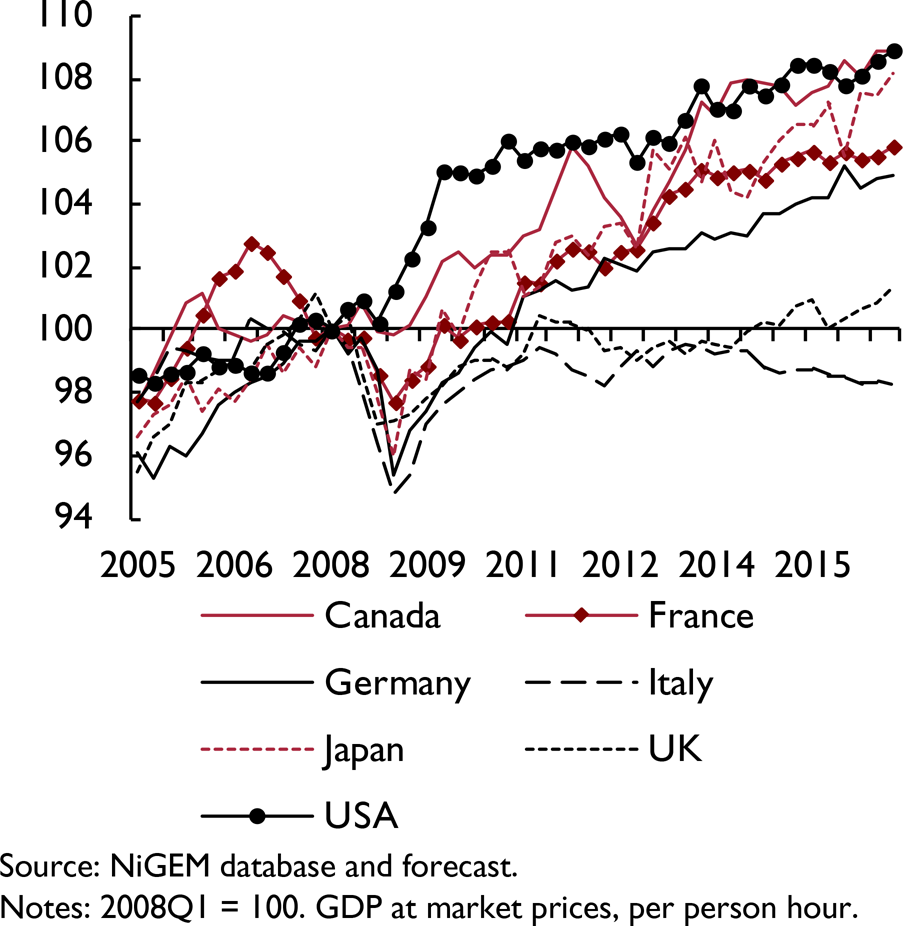
Figure A7. Productivity in the UK has just surpassed pre–recession levels
Figure A8. National saving rates (per cent of GDP)
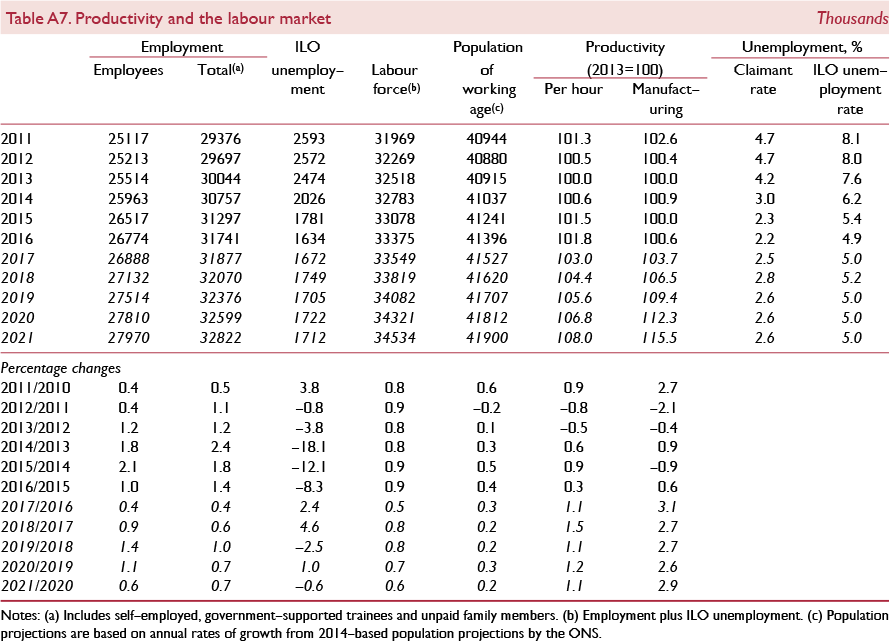
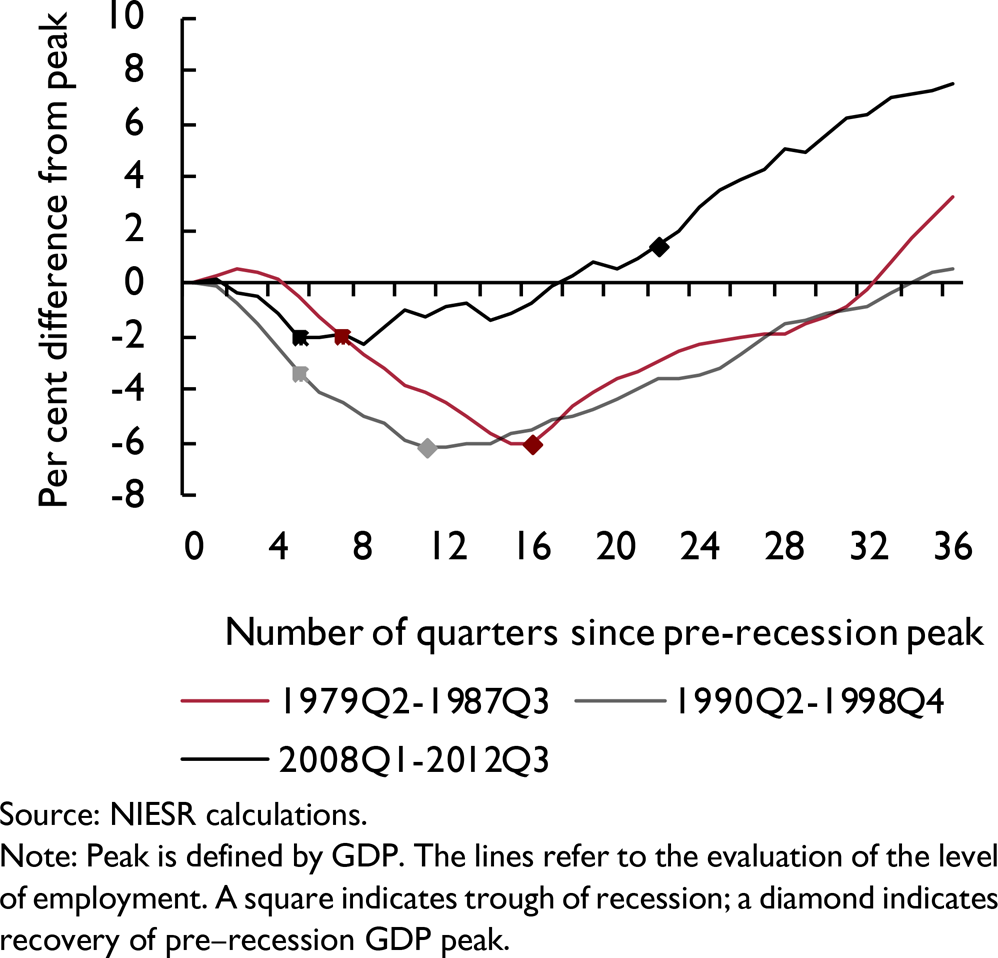
Figure A9. In 2017Q1 GDP was 8.8 per cent higher than its pre–crisis peak and employment is estimated to be 7.4 per cent higher
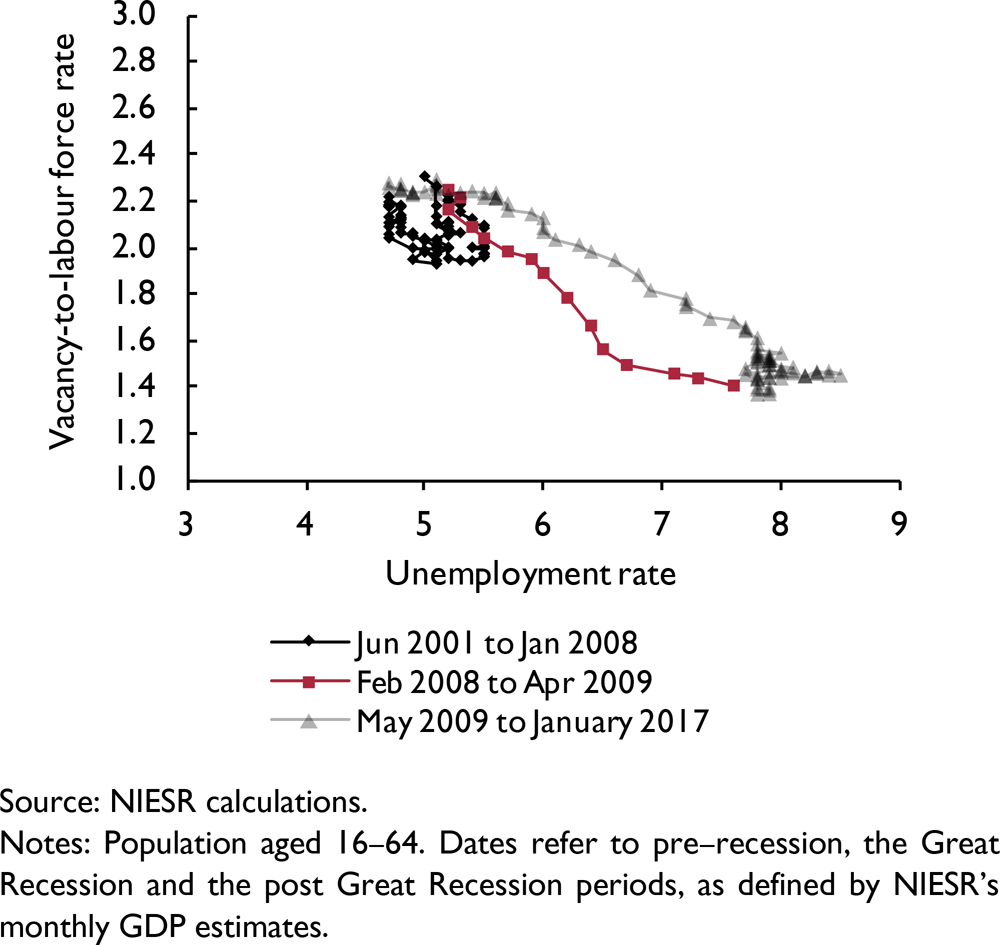
Figure A10. The Beveridge curve