


1. Background
In natural ice masses the most important and common state of deformation is arguably a combination of approximately bed-parallel shear and vertical compression. For deformational flow with a stationary boundary, a region of simple shear is associated in an essential way with bulk transport of ice in glaciers, ice sheets and ice shelves, and this is generally accompanied by normal deformations associated with increasing velocities along the flow and divergence or convergence transverse to the flow.
For a coordinate system with x and y horizontal and z vertical, and corresponding component velocities (u, v, w), simple shear deformation in the x direction can be characterized by du/dz = c where we note that the horizontal planes on which the forces generating shear deformation act do not rotate, while compression normal to these planes is described by dw/dz = k, where c/2 and k are the respective shear and vertical compressive strain rates. The compressive flow may be confined or unconfined, and quite generally the accompanying horizontal normal strain rates are ![]() and
and ![]() where the factors involving ζ indicate the proportions of the deformations in the horizontal directions, relative to the rate of vertical compression. Note that ζ = 1/2 corresponds to uniaxial compression in the z direction, while ζ = 1 corresponds to longitudinally confined compression in the experiments reported here (Fig. 1).
where the factors involving ζ indicate the proportions of the deformations in the horizontal directions, relative to the rate of vertical compression. Note that ζ = 1/2 corresponds to uniaxial compression in the z direction, while ζ = 1 corresponds to longitudinally confined compression in the experiments reported here (Fig. 1).
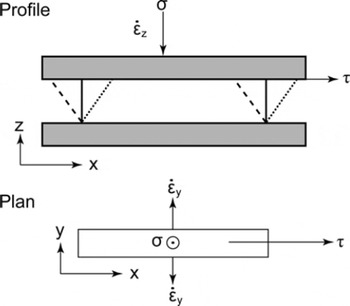
Fig. 1. Diagrammatic representation of the ice creep test configuration for long rectangular prism ice samples in horizontal shear combined with vertical compression, confined in the direction of flow but free to extend in the transverse direction. The solid and dotted lines in the profile view show the respective initial and final shapes of the initially rectangular deformation samples. The dashed lines indicate the initial profile of the ‘back cut’ parallelepiped samples.
The generalized flow relation for ice involving the second invariants of the stress deviator and strain-rate tensors (Reference NyeNye, 1953; Reference GlenGlen, 1958) provides a useful formulation for the interactions between the individual stress and strain-rate components for isotropic ice. This relation is not expected to apply for anisotropic ice, as indicated by Reference NyeNye (1953) and Reference GlenGlen (1958). Furthermore, it is found that under deformation, isotropic polycrystalline ice exists only transitorily, up to and through a brief period of secondary creep which lasts for only a few per cent strain around the minimum strain rate (Reference Budd and JackaBudd and Jacka, 1989). With continued deformation, strong anisotropic crystal orientation fabric patterns develop. These appear to be uniquely determined by the deformation, recrystallization and rotation, while their development is accompanied by an increase in creep rate for both shear and compression. Ultimately these processes of deformation, recrystallization and rotation reach a dynamic equilibrium, resulting in a steady state of tertiary creep and a statistically stable fabric pattern and crystal size distribution (Reference Budd and JackaBudd and Jacka, 1989). Previous analyses of combined compression and shear tests showed that the minimum creep rates for isotropic ice are well described by Glen’s relation between the second invariants (Reference Li and JackaLi and Jacka, 1996; Reference Li, Jacka and BuddLi and others, 1996). Separate compression and shear experiments have shown that the steady-state tertiary flow rates that develop at large strains (once the anisotropic crystal structure is well developed) are higher than the transient minima displayed by the initially isotropic ice, with different amounts of enhancement. A robust relation exists between the second invariants of the stress and strain-rate tensors, which can be described by an enhancement factor for the octahedral (root mean square of the principal tensor deviators) shear strain rate (relative to the minimum strain rate). For a fixed value of the octahedral stress, Reference Li, Jacka and BuddLi and others (1996) showed that this enhancement factor increased smoothly from compression alone to shear alone, with the increasing fraction of shear relative to compression.
This paper presents and analyses in detail the shear and compression component ice flow relations, utilizing laboratory experiments covering the secondary (minimum isotropic) and extending to steady-state tertiary creep flow under combined shear and compression loads. The motivation for this series of experiments was to study those flow properties of anisotropic polycrystalline ice relevant to describing the flow in natural ice masses.
A variety of models for ice deformation have been proposed to describe the influence of anisotropy, as discussed in reviews by Reference MarshallMarshall (2005) and Reference Gagliardini, Gillet-Chaulet, Montagnat and HondohGagliardini and others (2009). The treatments can be divided into two classes. The majority of models (e.g. Reference LileLile, 1978; Reference Azuma and Goto-AzumaAzuma and Goto-Azuma, 1996; Reference Svendsen and HutterSvendsen and Hutter, 1996; Reference Gagliardini and MeyssonnierGagliardini and Meyssonnier, 2000; Reference ThorsteinssonThorsteinsson, 2001; Reference GödertGödert, 2003; Reference Morland and StaroszczykMorland and Staroszczyk, 2003; Reference Gillet-Chaulet, Gagliardini, Meyssonnier, Montagnat and CastelnauGillet-Chaulet and others, 2005; Reference Placidi and HutterPlacidi and Hutter 2006; Reference Placidi, Greve, Seddik and FariaPlacidi and others, 2010) take the instantaneous state of crystal orientations as an independent ingredient in the rheological model, typically involving (directly or indirectly) a summation of the response of individual crystals. For such models, the separate task of simulating the evolution of crystal orientation fabrics must also be performed to enable their utilization in ice-sheet modelling. As recognized by Reference MarshallMarshall (2005), an alternative approach (e.g. Reference Li, Jacka and BuddLi and others, 1996; Reference Warner, Jacka, Li, Budd, Hutter, Wang and BeerWarner and others, 1999; Reference Wang, Warner and BuddWang and others, 2002) is to concentrate on the description of the steady tertiary flow, where the situation is arguably more straightforward. This is our approach. While we make some connections with the character of the anisotropic crystal fabrics that were obtained for the tertiary flow state, our main emphasis here is on directly linking the component stresses and strain rates, since the relevant fabrics in steady-state tertiary flow are not independent of the flow and the stress regime.
For clarity we provide the following outline of the presentation. Firstly we review the early attempts to relate various laboratory and field observations of ice deformation, leading to the formulation of the Glen–Nye second-invariant power law flow relation for ice, based on independent laboratory tests of compression alone and shear alone. Next we consider the stress configurations for our tests here, which involve shear combined with normal compression, and their connection with more common tests involving compression or shear alone. We then discuss how our tests correspond to the predominant stress configurations occurring in ice sheets. We only give a brief description of the apparatus and experimental approach since they have been presented previously. Since this paper builds on earlier work we also draw attention to previous analyses of some aspects of these tests and related experiments. Even though the crystallography is not the focus of this paper, we show a representative set of the steady-state tertiary fabrics that develop from the initially isotropic distribution of c-axes. Next, the new results for the strain rates for the individual shear and compression components are discussed, including the effect of changes in each component stress on the strain rates of the other component. This leads to a formulation of the flow relations for the individual components, as well as for the second invariants or octahedral stress and strain rates for this configuration. A cautionary note is given on any inappropriate use of minimum strain rates in combined stress experiments since the smaller component is usually still in the primary anelastic stage when the octahedral minimum occurs. Finally we show that a scalar function formulation of the flow relation also fits the data well, can be readily generalized to stress situations beyond the present tests, and is here proposed for ease of use in numerical modelling of ice masses in general.
1.1. The historical basis for the flow law of ice developed from independent compression and shear tests
The pioneering work of Reference GlenGlen (1952, Reference Glen1953, Reference Glen1955, Reference Glen1958) and Reference SteinemannSteinemann (1954) established the power law form of the flow relation for ice, largely from separate series of tests on polycrystalline ice with randomly oriented crystals, in either unconfined compression or simple shear. Although they recognized that higher tertiary strain rates and anisotropy developed at high strains, the relations for secondary flow rates for isotropic ice tended to be used as the standards against which studies of the flow of natural ice masses were compared.
That is to say, for an applied unconfined (uniaxial) compressive stress σz
and secondary strain rate ![]() and for shear stress τxz
and secondary shear strain rate
and for shear stress τxz
and secondary shear strain rate ![]() , the following independent relations were established from the tests:
, the following independent relations were established from the tests:
where n, k
c
and k
s are (for a fixed temperature) empirical constants determined independently from compression and shear tests respectively. In the convention used here for stress tensor components, σij
, the first subscript indicates the direction of the stress component and the second is the direction of the normal to the plane over which it acts. A similar convention applies for the strain-rate components ![]() (Reference BatchelorBatchelor, 1967). Although Reference SteinemannSteinemann (1958a, Reference Steinemannb) also carried out some combined stress tests, the data obtained were not adequate to clearly establish the comparative relations between compression and shear rates for the same stresses.
(Reference BatchelorBatchelor, 1967). Although Reference SteinemannSteinemann (1958a, Reference Steinemannb) also carried out some combined stress tests, the data obtained were not adequate to clearly establish the comparative relations between compression and shear rates for the same stresses.
For the application of the laboratory ice flow data to the analysis of the observed shear rates through the thickness of a glacier, Reference NyeNye (1953) proposed that the flow rates of ice in compression and shear might be related through the use of a more general relation between the second invariants of the strain-rate tensor, ![]() and the deviatoric stress tensor, sij
. Reference GlenGlen (1958) provided a theoretical basis for this type of generalized flow relation by analysing the necessary constraints and conditions on flow. He also pointed out a possible generalization of Nye’s isotropic flow relations, and indeed attempted to analyse Steinemann’s combined stress experiments for failures of the isotropic flow law. The data, however, were inadequate to establish a clear result. In brief, to examine Glen’s relation for isotropic ice, for a stress tensor σij
with principal stresses σ
1, σ
2, σ
3 it might be expected that the mean normal stress,
and the deviatoric stress tensor, sij
. Reference GlenGlen (1958) provided a theoretical basis for this type of generalized flow relation by analysing the necessary constraints and conditions on flow. He also pointed out a possible generalization of Nye’s isotropic flow relations, and indeed attempted to analyse Steinemann’s combined stress experiments for failures of the isotropic flow law. The data, however, were inadequate to establish a clear result. In brief, to examine Glen’s relation for isotropic ice, for a stress tensor σij
with principal stresses σ
1, σ
2, σ
3 it might be expected that the mean normal stress,
(where −p is the hydrostatic pressure) is not important for the deformation of incompressible materials like ice. The experimental results of Reference RigsbyRigsby (1958) indicated that provided the temperature conditions are referred to the pressure-melting point this appears to be the case for ice, and it will be assumed to apply here.
The deviatoric stress tensor is given by
where δij is the Kronecker delta (δij = 1 whenever i = j and δij = 0 whenever i ≠ j). The relevant second invariants are represented by
where the Einstein summation convention (summation is taken over repeated subscripts) is implied.
Reference JaegerJaeger (1969) defines a plane whose normal has direction cosines ![]() relative to the principal axes. This plane is known as the octahedral plane as eight planes, all equally inclined to the principal axes and which combined describe an octahedron, can be defined. By definition, the normal stress on the octahedral plane is the mean normal stress and does not contribute to deformation (Reference JaegerJaeger, 1969). Therefore it is the shear stress acting on the octahedral plane, referred to as the octahedral shear stress, τ
o, that causes deformation, where
relative to the principal axes. This plane is known as the octahedral plane as eight planes, all equally inclined to the principal axes and which combined describe an octahedron, can be defined. By definition, the normal stress on the octahedral plane is the mean normal stress and does not contribute to deformation (Reference JaegerJaeger, 1969). Therefore it is the shear stress acting on the octahedral plane, referred to as the octahedral shear stress, τ
o, that causes deformation, where

Being the root-mean-square (rms) value of the principal stress deviators, τ
o is an appropriate scalar measure of a generalized stress magnitude. In the following we abbreviate τ
o to octahedral stress for clarity. Similarly the octahedral (shear) strain rate, ![]() , is given by
, is given by

Note that Reference NyeNye (1953) used the less physically relevant ‘effective’ shear stress and strain rate (square roots of the second invariants in Eqn (5) above), which are simply related to the octahedral values by

The Nye proposal that the ice flow law depends only on the second invariant of the stress deviator tensor gives rise to a relation of the form
where for constant conditions (e.g. temperature and impurity content, etc.), B is a function only of the scalars I 2 or τ o. This type of generalized relation was then used as a basis to unify the different types of laboratory tests (e.g. compression and shear) and to reconcile them with the observed deformation rates of glaciers.
For a power law form of the flow relation with degree n the separate relations for unconfined compression only and shear only, of the form of Eqns (1) and (2), can be considered as special cases of the more general relation involving the second invariants given by
where k o is an empirical constant. In this case the function B is given by
and Eqns (1) and (2) may be represented, for shear, by
and, for unconfined compression, by
so that k s and k c in Eqns (1) and (2) can be related to k o, given the stress situation, through Eqns (6), (7), (9) and (10), for the special cases of shear alone and uniaxial compression alone. As already indicated, this simple attempt to connect the different modes of deformation to a common octahedral flow parameter (independent of the nature of the proportions of applied stresses) fails in tertiary flow.
1.2. Stress configurations for combined shear and compression
As discussed earlier, the predominant flow regime in large ice masses consists of a shear flow in which the plane of the shear does not rotate (typically being aligned with the ice velocity), combined with compression (or extension) normal to the plane on which the forces generating the simple shear act. For this stress and rotation situation, there are a range of possibilities for the remaining two normal deformations. As examples of the different modes of deformation under combined shear and compressive stresses we discuss two cases: uniaxial (or unconfined) compression, which connects with the earlier simple stress tests; and longitudinally confined compression, which applies to the present set of laboratory tests, and (approximately) to tests on hollow cylinders as described, for example, by Reference SteinemannSteinemann (1954).
Great store is often set by expressing ice flow relations in a manifestly coordinate-invariant form. While the physics of the situation must be invariant under general coordinate transformations, much of the present work deals with anisotropic flow and particular combinations of stresses, so there is great utility in choosing an appropriate reference frame. The Cartesian coordinate reference system we use in describing our experiments has been specifically chosen to align with the symmetries of the sample shapes and reflects the orthotropic symmetries implied by the pattern of applied compressive and shear stresses. As we shall see, it also corresponds approximately with the reflection symmetries of the steady-state induced ice crystal orientation fabric patterns. However, it should be noted that for polycrystalline ice deforming under a shear stress, the fabric pattern passes through non-orthotropic stages during the progression from an initial isotropic fabric to a tertiary single maximum (e.g. Reference Kamb, Heard, Borg, Carter and RaleighKamb, 1972; Reference DuvalDuval, 1981), and through stages where the symmetries of the fabric pattern are not fully aligned with those of the applied stresses. There are generally no residual rotational symmetries in our combined shear and longitudinally confined compression tests. Clearly, if confronted with a physically analogous stress configuration in a differently oriented reference frame (e.g. in a flow-modelling situation), it would be straightforward to rotate our component flow relations into that frame – but it would be erroneous to simply assume that the component flow relations presented here necessarily have simple generalizations to arbitrary arrangements of stresses; that would constitute simply guessing at the remaining elements of the viscosity or fluidity tensors.
While laboratory experiments provide control over the applied stresses, the deviatoric normal stresses must be inferred. For the present discussion we assume the flow relations satisfy the following condition: that in a reference frame aligned with the orthotropic symmetries implied by the pattern of applied stresses and any concomitant induced ice crystal fabric patterns, the vanishing of a strain-rate component indicates the vanishing of the corresponding deviatoric stress. Some more exotic flow relations do not necessarily satisfy this condition (e.g. the Reiner–Rivlin form explored by Reference GlenGlen (1958) and more recently re-examined by Reference MorlandMorland (2007)).
Shear combined with unconfined compression
For the case of simple shear τxz = τ on the horizontal x-y plane, combined with unconfined simple compression σz = −σ in the vertical (z) direction, the stress tensor takes the form

For the initially statistically isotropic, randomly oriented polycrystalline ice of our laboratory samples we assume that the mean normal stress is
so that the deviatoric stress and strain-rate tensors, sij
and ![]() respectively are
respectively are

in terms of the shear strain rate ![]() and the vertical compressive strain rate
and the vertical compressive strain rate ![]() . The octahedral stress is
. The octahedral stress is

and the octahedral strain rate ![]() for combined shear and unconfined compression is given by
for combined shear and unconfined compression is given by

It could be argued that the application of shear changes the symmetry and that for tertiary flow with anisotropic crystal orientation fabrics it is inappropriate to assume a priori that the extensive normal deviatoric stresses and strain rates in the longitudinal (x) and transverse (y) directions continue to be equal. For the present work we do not actually consider combined stress situations with unconfined compression so that we need not insist on the point here. Rather, these relations are presented here to connect with the single stress results mentioned above. For unconfined compression alone (τ = 0) or simple shear alone (σ = 0), the octahedral invariants (Eqns (17) and (18)) become ![]() and
and ![]() for τ = 0, and
for τ = 0, and ![]() , and
, and ![]() for σ = 0.
for σ = 0.
The flow relation, Eqn (10), reverts to the power-law dependence on the individual stresses of Eqns (1) and (2), through Eqns (12) and (13) respectively, and allows the empirical constants k o, k s and k c to be related (Reference Budd and JackaBudd and Jacka 1989) :

For n = 3 this gives
Early attempts to confirm these propositions (Reference GlenGlen, 1958; Reference SteinemannSteinemann, 1958a) were unsuccessful. The review of Reference Budd and JackaBudd and Jacka (1989, fig. 5) showed a closer agreement between theoretical and experimentally derived k values, with a residual factor-of-two discrepancy. The origin of this disagreement was later identified as an error in the strain-rate calculations of Reference GaoGao (1989). These corrected values were reported by Reference Li, Jacka and BuddLi and others (2000). Importantly, these relations can be used to examine whether in addition to a cubic dependence on stress, the deformation tests for unconfined compression alone and for shear alone also conform to the second-invariant postulate of Reference NyeNye (1953) via Eqn (10).
To address these two important questions a compilation of minimum strain rates from independent shear tests and unconfined compression tests on isotropic laboratory ice at −2°C, including the previous results from Reference JackaJacka (1987), Reference GaoGao (1989; now corrected), Reference LiLi (1995) and Reference Budd and JackaBudd and Jacka (1989) is shown in Figure 2. These results show the slopes on log ![]() axes are indicative of n = 3 and also, more convincingly than previous studies, the separations appropriate for Eqns (20). Both sets of values are also shown converted to octahedral stress and strain rates, and illustrate the convergence of the data towards a common line (with slope n = 3) in agreement with the Reference NyeNye (1953) second-invariant postulate. These data indicate a value of k
o = 5.5 × 10⁻⁶ s−1 Mpa−3, at minimum creep for this test temperature (−2°C). The dependence of k
o on temperature has been given in detail by Reference Budd and JackaBudd and Jacka (1989), with Reference Jacka and LiJacka and Li (1994) showing that the implied creep activation energy also increases by almost an order of magnitude from temperatures above −10°C to the pressure-melting point.
axes are indicative of n = 3 and also, more convincingly than previous studies, the separations appropriate for Eqns (20). Both sets of values are also shown converted to octahedral stress and strain rates, and illustrate the convergence of the data towards a common line (with slope n = 3) in agreement with the Reference NyeNye (1953) second-invariant postulate. These data indicate a value of k
o = 5.5 × 10⁻⁶ s−1 Mpa−3, at minimum creep for this test temperature (−2°C). The dependence of k
o on temperature has been given in detail by Reference Budd and JackaBudd and Jacka (1989), with Reference Jacka and LiJacka and Li (1994) showing that the implied creep activation energy also increases by almost an order of magnitude from temperatures above −10°C to the pressure-melting point.

Fig. 2. Minimum strain rates from deformation tests for shear alone (![]() crosses), and uncomfined compression alone (
crosses), and uncomfined compression alone (![]() open squares) as functions of the individual stress, and the corresponding octahedral (
open squares) as functions of the individual stress, and the corresponding octahedral (![]() versus τo) relation (open circles), confirming a Glen-type creep power law with exponent n = 3. All tests were performed at −2°C. The sloping lines have all been drawn with n = 3, to show more clearly the ratios expected for K
s (dotted line), k
c (dashed line) and K
o (solid line) in Eqns (20), from the logarithmic spacings of the parallel lines.
versus τo) relation (open circles), confirming a Glen-type creep power law with exponent n = 3. All tests were performed at −2°C. The sloping lines have all been drawn with n = 3, to show more clearly the ratios expected for K
s (dotted line), k
c (dashed line) and K
o (solid line) in Eqns (20), from the logarithmic spacings of the parallel lines.
Shear combined with confined compression
For combined stress tests in the laboratory, some problems arise regarding the uniformity of stress and strain rate throughout the ice sample. The sample shapes most suitable for tests in compression alone differ from those most suitable for shear alone. For the combined tests a compromise is needed. A convenient form of combined stress configuration is that described by Reference Li, Jacka and BuddLi and others (1996), using samples which are long in the shear (x) direction and short in the vertical (z) and cross (y) directions, as shown in Figure 1. Because of their shape, under horizontal shear (τxz = τ) and vertical compression (σz = −σ), these samples are observed to be effectively confined in the xdirection and free to flow in the y direction. The combined stress configuration can then be described (under similar assumptions to the preceding section) by

since
and

Accordingly, if, for confined compression alone, the flow relation is given by a power law similar to Eqn (1) but with a different constant, k cc, i.e.
then the following relations between the constants for shear, confined compression and octahedral values apply in place of Eqns (19) and (20) for the unconfined case:

which, for n = 3, gives
Thus the strain rate for confined compression is expected to be reduced relative to unconfined compression (for the same compressive stress σ) by the factor given by

which, for n = 3, gives
The importance of these k values is to illustrate the considerable difference between strain rates at the same stress for different stress configurations. The difference between the strain rates (represented by these flow parameters) for the same stresses in these different stress configurations provides a further check on the flow law exponent (n = 3) and the second-invariant hypothesis.
2. The Predominant Stress Situations in Ice Masses
In ice sheets the predominant mode of deformation is an approximately horizontal shear with strain rate increasing towards the bed. In accumulation areas that are near to steady-state mass balance, there is a net divergence of ice flux, and the horizontal shear is typically accompanied by vertical compression and horizontal longitudinal or transverse extensive strain rates. The relative magnitude of the longitudinal ![]() and transverse
and transverse ![]() extensive or compressive strain rates depends largely on the divergence or convergence of the flowlines. In the laboratory this range of possibilities can be studied by examining the special extreme cases such as unconfined compression (in which
extensive or compressive strain rates depends largely on the divergence or convergence of the flowlines. In the laboratory this range of possibilities can be studied by examining the special extreme cases such as unconfined compression (in which ![]() ), compression confined in the longitudinal direction
), compression confined in the longitudinal direction ![]() and compression confined in the transverse direction
and compression confined in the transverse direction ![]() . Only the first two of these cases are considered in the laboratory tests presented here, since the capability to conduct experiments configured in the third case
. Only the first two of these cases are considered in the laboratory tests presented here, since the capability to conduct experiments configured in the third case ![]() has only recently been established with our experimental apparatus and no results are yet available. In these experiments the laboratory measurements focus on the combination of an applied shear stress τ with an independent compression σ normal to the plane in which the shear load is applied (Fig. 1).
has only recently been established with our experimental apparatus and no results are yet available. In these experiments the laboratory measurements focus on the combination of an applied shear stress τ with an independent compression σ normal to the plane in which the shear load is applied (Fig. 1).
For field deformation situations with a dominant shear plane that does not rotate, it may be useful to examine the strain rates in terms of independent normal and shear components, which can be related to laboratory studies involving combined normal and shear stress experiments. Nevertheless the flow patterns and rotations must also be taken into account. For example, in unbounded ice shelves, vertical compression is usually associated with longitudinal and transverse extensions, while for bounded ice shelves this vertical compression is typically combined with a transverse shear strain rate which tends to increase from zero near the central flowline to a maximum towards the sides. Even at the margins of ice streams, the combination of horizontal and transverse shear should produce a resultant non-rotating shear plane. In these various field situations, for nonlinear flow laws, the shear stress and strain rates are dependent on the compressive stress and strain rates, and vice versa. Also, in the field situations where large strains prevail, the ice can be expected to have developed a strongly anisotropic crystal fabric whose nature depends on the deformation pattern (e.g. Reference BuddBudd, 1972; Reference Russell-Head and BuddRussell-Head and Budd, 1979; Reference Budd and JackaBudd and Jacka, 1989; Reference DurandDurand and others, 2007; Reference Gow and MeeseGow and Meese, 2007).
Our aim is to examine the relations between the shear and compression components in combined stress situations. We start with laboratory-made statistically isotropic polycrystalline ice and consider both flow at minimum strain rate, in which the ice is still isotropic, and tertiary flow in which strong polycrystalline anisotropies have developed.
The present work shows that confined compression alone and simple shear alone have different tertiary flow rates for equal deviatoric stresses (τ = σ/2), even though the corresponding second and third invariants are also equal. Accordingly, any proposal to describe the relative component flow rates without recourse to other indicators (e.g. crystal orientation data) must be expected to depend on the boundary conditions or platen constraints as well as the stress configuration, and not just on the invariants of the stress tensor. This corresponds to considering strain rates and rotation rates, i.e. the ‘movement picture’, involving the complete velocity field and its spatial derivatives. These conditions also determine the steady-state crystal orientation fabrics, which evolve with the developing tertiary flow rates. It should be noted that the only form of anisotropy of concern here is that which develops in conjunction with the tertiary deformation. This may be referred to as the ‘compatible anisotropy’.
The importance of the movement picture, including the distinction between simple shear and plane pure shear for the formation of crystal orientation fabric patterns, was recognized long ago (e.g. Reference BuddBudd, 1972; Reference Kamb, Heard, Borg, Carter and RaleighKamb, 1972; Reference DuvalDuval, 1981). Reference DuvalDuval (1981) referred to the plane normal to the velocity gradient in simple shear situations as the ‘permanent shear plane’, and commented on its connection with the developing concentrations of crystal orientations. Thus for the deformation properties of ice in tertiary flow it is necessary to consider not only the stress and strain-rate tensors but also the patterns of flow and the rotations associated with the boundary conditions of ice-sheet flow or the platen constraints of the apparatus in laboratory experiments. In this context, the permanent or non-rotating shear plane is one on which the forces generating a shear act.
3. Experiments and Laboratory Apparatus
The apparatus and laboratory techniques used for these experiments have been discussed previously in several papers (e.g. Reference Li and JackaLi and Jacka, 1996, Reference Li and Jacka1998; Reference Li, Jacka and BuddLi and others, 1996, Reference Li, Jacka and Budd2000; Reference Treverrow, Budd, Jacka and WarnerTreverrow and others, 2012), but a few important points regarding the choice of samples for combined shear and compression tests need to be made here.
The same apparatus can be used for unconfined compression alone, confined compression alone, simple shear alone, or either type of vertical compression in combination with horizontal simple shear. Figure 1 shows a schematic representation of the applied stresses. For unconfined vertical compression the most appropriate sample shape is the vertical axis cylinder, because of the axial symmetry of the stress and strain-rate fields. Although some shear tests and combined compression and shear tests have been carried out with cylindrical samples, the most appropriate sample shapes for shear alone tests are the long rectangular prisms with the elongation in the direction of shear. This type of sample shape is also suitable for confined compression tests with the confinement in the shear (x) direction (cf. Fig. 1).
A large number of long-term tests have now been carried out with these types of samples, reaching tertiary flow rates, in simple shear alone, confined compression alone and simple shear combined with confined compression. The results presented here were accumulated over many years. Table 1 lists the group of experiments discussed here. These experiments, originally described in part by Reference Li, Jacka and BuddLi and others (1996) and Reference Warner, Jacka, Li, Budd, Hutter, Wang and BeerWarner and others (1999), were carried out at −2°C and were continued to steady-state tertiary flow generally at >20% strain. All tests used the same laboratory-made initially randomly oriented polycrystalline ice, produced using the method of Reference Jacka and LileJacka and Lile (1984). Table 1 contains details from a reanalysis of these experiments and lists stress, strain and strain-rate data for both the shear and compression components and the corresponding octahedral values, as well as details of the stress configuration and applied stresses.
Table 1. Results of combined shear and compression ice deformation experiments. Sample dimensions: length, L, width, W, height, H, and, for cylindrical sample, diameter, D. Stresses: compressive stress, σ, shear stress, τ, octahedral stress, τ
o. Combined stress shear variable: r
s (Eqn (37)). Minimum strain rates: compressive, ![]() , shear,
, shear, ![]() , octahedral,
, octahedral, ![]() ; tertiary strain rates: compressive,
; tertiary strain rates: compressive, ![]() , shear,
, shear, ![]() , octahedral,
, octahedral, ![]() ; final octahedral strain, ε
o, final, Samples were initially isotropic, and temperature for all tests was −2°C. The blanks in the table correspond to the zero-stress components in the compression-alone and shear-alone tests, or indicate where data were not available
; final octahedral strain, ε
o, final, Samples were initially isotropic, and temperature for all tests was −2°C. The blanks in the table correspond to the zero-stress components in the compression-alone and shear-alone tests, or indicate where data were not available

The influence of sample size and crystal size on flow rates has been examined previously (e.g. Reference JackaJacka, 1984, Reference Jacka1994; Reference Jacka and LiJacka and Li, 1994). Separate experiments have been carried out to examine the effects of sample shape and distortion on the results (Reference Li, Jacka and BuddLi and others, 2000). Here a few points following from that work are noted. When horizontal shear tests are commenced with a rectangular prism sample, some vertical contraction results. This has been reduced by using longer samples and also by starting with a vertical parallelogram cross-section shape, which then passes through the rectangular shape before deforming further towards a parallelogram shape with continuing shear. This technique, referred to as starting with a ‘back-cut’ (Fig. 1), starts with slight vertical extensive strain rate and passes through a zero vertical strain rate before going to vertical contraction at even larger shear strains. The magnitude of these vertical strains and strain rates decreases with relative length of the sample. Only a few ‘back-cut’ samples have been included in the data of Table 1, so in the analysis of the results the small vertical strain rates in experiments with very low compression loads need to be treated with caution, as discussed later.
At the end of each experiment the sample was removed from the apparatus, and horizontal thin sections cut. These were mounted on glass slides for grain size and crystallographic c-axis orientation measurements. Some examples of c-axis orientation measurements plotted on equal-area Schmidt diagrams (lower-hemisphere projections) are discussed below, although the main analysis will be directly in terms of the combined stresses, rather than the compatible fabrics.
4. Ice Crystal Orientation Fabrics
In several earlier series of compression and shear tests, sequences of crystal orientation fabric measurements were made to explore the dependence of fabric development on cumulative strain (Reference Jacka and MaccagnanJacka and Maccagnan, 1984; Reference Gao, Jacka, Budd and GuoGao and others, 1989; Reference LiLi, 1995). These results show negligible change from the initial isotropic structure up to about 1–2% strain. From 2% to 10% strain there is relatively rapid recrystallization giving clear well-established fabric patterns by 10%. Extending to 20% strain strengthens the fabrics, which tend to a steady state in orientation and crystal size with the continuing tertiary flow. These changes have been well studied in the laboratory to temperatures below −15°C.
A representative set of fabrics resulting from different laboratory tests is shown in Figure 3, with corresponding data on some statistical characteristics in Table 2. Figure 3 shows the fabrics for: randomly oriented laboratory ice (Fig. 3a), single-component stress tests (Fig. 3b–d) and the combined stress tests of Table 1 (Fig. 3e and f). These fabrics illustrate confined compression alone (Fig. 3b) with two maxima at co-latitude angles centred on co-latitude ∼41°; unconfined compression (Fig. 3c) with a small circle girdle with mean co-latitude angle ∼36°; shear alone (Fig. 3d) with a single maximum; and two cases of combined shear and confined compression (Fig. 3e and f) which show intermediate composite fabrics, higher shear with lower compressive deviator (Fig. 3e) and deviators of equal magnitude (Fig. 3f). All these tertiary creep fabrics have enhanced concentrations towards the vertical compared with the initial uniform distribution (Fig. 3a). The median co-latitude angles, φ 1/2, for these fabrics are given in Table 2. The representative fabrics in Figure 3 are also in accord with results from previous laboratory studies of compression, shear and combined shear and compression. For example, Reference Kamb, Heard, Borg, Carter and RaleighKamb (1972) applied torsion to hollow cylinders to produce shear and combined this with an axial normal compression (analogous to our shear with longitudinally confined compression) to study fabric development to large strains. Figure 18 of Reference Kamb, Heard, Borg, Carter and RaleighKamb (1972) presents a schematic of the pattern of change in combined stress situations from compression dominant to shear dominant. Similar results, and the establishment of a strong single maximum at large shear strains, have been presented by Reference DuvalDuval (1981), Reference Bouchez and DuvalBouchez and Duval (1982), Reference Budd and JackaBudd and Jacka (1989) and Reference Li, Jacka and BuddLi and others (2000). Reference BuddBudd (1972) and Reference Budd and JackaBudd and Jacka (1989) also show there is close agreement between the fabrics determined from laboratory experiments and those observed in ice from the field under similar deformation conditions. Note that the fabrics for the combined stress tests tend to have somewhat reduced concentrations near the vertical compared with those for simple shear alone, but are more concentrated towards the vertical than in either of the compression-only samples.

Fig. 3. Crystal orientation fabrics for horizontal (x-y) sections, with x in the shear direction as shown in Figure 1. The units of the applied compression, σ, and shear, τ, are MPa. The total accumulated octahedral strain, ε o, is given below for each sample. (a) Randomly oriented laboratory-made ice (ε o = 0%). (b) Two-maximum fabric generated by confined compression alone (ε o = 15%). (c) Girdle fabric generated by unconfined compression alone (ε o = 22%). (d) Single-maximum fabric generated by shear alone (ε o = 101 %). (e) Fabric generated by large shear and smaller confined compression deviator (test 24, ε o = 28%). (f) Fabric generated by comparable shear and confined compression deviator (test 22, ε o= 43%). All experiments were conducted at −2°C. All crystal orientation fabric diagrams are lower-hemisphere Schmidt equal-area plots, with (a–d) from previously published tests.
The magnitude of the co-latitude angle, φ, is not the most appropriate indicator of the resistance of a crystal to horizontal shear. Crystals at a certain (small) angle, say φ, from the vertical in the transverse (z-y) plane are expected to have less resistance to the shear in the x direction than crystals with the same co-latitude angle φ in the longitudinal (x-z) plane. Therefore the mean angles from the vertical of the projections of the c-axis directions in the (x-z) plane, ψ, and the (y-z) plane, χ, are also shown in Table 2. The table includes (1) the means, ![]() , and (2) the standard deviations, SD φ, for the co-latitude angles, (3) the median co-latitude angle, φ
1/2, which encloses half the c-axis directions measured in a thin section, (4) the differences between the median angles and 45°, i.e. (45° − φ
1/2), the first quartile of c-axis angles φ nearest the pole, φ
1/4, (5) the mean modulus of the (y-z) plane component,
, and (2) the standard deviations, SD φ, for the co-latitude angles, (3) the median co-latitude angle, φ
1/2, which encloses half the c-axis directions measured in a thin section, (4) the differences between the median angles and 45°, i.e. (45° − φ
1/2), the first quartile of c-axis angles φ nearest the pole, φ
1/4, (5) the mean modulus of the (y-z) plane component, ![]() , and (6) the mean modulus of the (x-z) plane component,
, and (6) the mean modulus of the (x-z) plane component, ![]() .
.
Without integrating the resistance over all the individual crystals in the sample aggregates in the manner discussed by Reference LileLile (1978, Reference Lile1984) or Reference Azuma and Goto-AzumaAzuma and Goto-Azuma (1996), these orientation angle statistics provide at least a qualitative indication of the expected relative resistance of these polycrystalline aggregates to vertical compression and horizontal shear. For example, the combination of the difference of the median co-latitude from 45° and the standard deviation may provide a useful indication of resistance to vertical compression. Considering the fabrics presented in Figure 3, the above would indicate, from the values for (45°−φ 1/2), that the fabrics resulting from the two compression-dominated experiments (Fig. 3b and c) should show the least resistance to compression, followed by the initial laboratory ice with near random distribution (Fig. 3a). The three samples that had been subjected to shear (Fig. 3d–f) might be expected to be more resistive to compression in direct relation to the shear fraction (Eqn (29) below), but in combined stress tests we find that this is not necessarily the case. In fact the compressive strain rate in these combined stress configurations is shown to increase through to tertiary creep as the strong central fabric (Fig. 3e) develops.
Conversely the resistance to shear in the x direction might be assessed from the angles φ
1/4 and ![]() . These suggest the least shear resistance would occur for the shear-only sample (Fig. 3d), followed by the other sheared samples incorporating some compression, then the compression-alone samples and finally the initial laboratory ice. Note that the compressed ice confined in the direction of shear (Fig. 3b) develops a fabric with a small value of
. These suggest the least shear resistance would occur for the shear-only sample (Fig. 3d), followed by the other sheared samples incorporating some compression, then the compression-alone samples and finally the initial laboratory ice. Note that the compressed ice confined in the direction of shear (Fig. 3b) develops a fabric with a small value of ![]() (15°), and should offer less resistance to shear. Note also that, for the samples from the combined stress experiments, the fabrics change from nearly isotropic (e.g. Fig. 3a) at minimum strain rate, to fabrics apparently more resistive to compression in tertiary flow (e.g. Fig. 3e), even though at the same time the compressive component strain rate is increasing, as shown in Figures 4, 5 and 6b. Explaining this situation in tertiary flow might prove a challenge to models of ice flow that are solely driven by considerations of crystal orientation fabrics (e.g. Reference Azuma and Goto-AzumaAzuma and Goto-Azuma, 1996; Reference ThorsteinssonThorsteinsson, 2001), but it is naturally accommodated by the flow relations presented later in this paper.
(15°), and should offer less resistance to shear. Note also that, for the samples from the combined stress experiments, the fabrics change from nearly isotropic (e.g. Fig. 3a) at minimum strain rate, to fabrics apparently more resistive to compression in tertiary flow (e.g. Fig. 3e), even though at the same time the compressive component strain rate is increasing, as shown in Figures 4, 5 and 6b. Explaining this situation in tertiary flow might prove a challenge to models of ice flow that are solely driven by considerations of crystal orientation fabrics (e.g. Reference Azuma and Goto-AzumaAzuma and Goto-Azuma, 1996; Reference ThorsteinssonThorsteinsson, 2001), but it is naturally accommodated by the flow relations presented later in this paper.

Fig. 4. Time series of strain rates for individual shear and compression components, and corresponding octahedral values. All experiments were conducted at −2°C. The rms fractional deviation, v, of the cubic spline curve from the experimental strain-rate values (Eqn (32)) is given for each fit to component and octahedral values: (a) high shear stress (τ = 0.48 MPa), low compression (σ = 0.16 MPa) (test 2); (b) comparable shear and compression deviator (τ = 0.49 MPa, σ = 0.98 MPa) (test 22); (c) high-compression deviator, low shear stress (σ = 0.98 MPa, τ = 0.245 MPa) (test 18).

Fig. 5. Progress of individual component and octahedral strain rates as a function of the corresponding component strains for the experiments shown in Figure 4. All experiments were conducted at −2°C. The rms fractional deviation, v, of the cubic spline curve from the experimental strain-rate values is given for each fit to component and octahedral values.

Fig. 6. The influence of incrersing each component stress on the other components strain rate. (a) T he influence of increasing normal compression stress on the shear strain rate. Shear strain-rate curves, (![]() versus octahedral strain, ε
o) are shown for a fixed shear stress (τ = 0.49 MPa) and rainree values of the confined normal stress (σ = 0,0.98, 1.96 MPa) (tests 1, 22 and 16 respectively). (b) The influence of increasing horizontal shear stress on the vertical compressive strain rate. Compressive strain-rate curves, (
versus octahedral strain, ε
o) are shown for a fixed shear stress (τ = 0.49 MPa) and rainree values of the confined normal stress (σ = 0,0.98, 1.96 MPa) (tests 1, 22 and 16 respectively). (b) The influence of increasing horizontal shear stress on the vertical compressive strain rate. Compressive strain-rate curves, (![]() versus octahedral strain, εo
) are shown for a fixed confined normal stress (σ = 0.49 MPa) for three values of the shear stress (τ = 0.061, 0.245, 0.420 MPa) (tests 14, 15 and 4 respectively). The increases in the component tertiary strain rates expected for the combined stress experiments, assuming a Glen-type flow relation, are indicated by the vertical arrows near the right margins.
versus octahedral strain, εo
) are shown for a fixed confined normal stress (σ = 0.49 MPa) for three values of the shear stress (τ = 0.061, 0.245, 0.420 MPa) (tests 14, 15 and 4 respectively). The increases in the component tertiary strain rates expected for the combined stress experiments, assuming a Glen-type flow relation, are indicated by the vertical arrows near the right margins.
Here we are examining the direct relationship between stresses and strain rates for a particular set of experimental stress configurations. In steady-state tertiary creep, the compatible crystal orientation fabric is uniquely determined by the deformation so that fabric can be regarded as an indicator of the flow. A detailed examination of the micro-mechanical processes associated with development of fabrics during deformation is beyond the scope of this work. We also note here that the steady-state tertiary fabrics that develop are independent of the initial fabrics of the ice, which are always overwritten by recrystallization, primarily between 2% and 10% strain. Accordingly, for tertiary flow we would only need to consider the steady-state compatible fabrics as described here. In a similar fashion we need not discuss crystal size here since it is not an independent influence on tertiary flow for clean ice. Rather, steady-state crystal size is determined by stress, as shown previously by Reference Jacka and LiJacka and Li (1994).
5. Results from Previous Combined Shear and Compression Tests
A shorter series of combined shear and compression tests (included in the data presented here) was used by Reference Li, Jacka and BuddLi and others (1996) to examine how well the flow relation based on the second invariants held for both minimum (isotropic ice) flow rates and tertiary (anisotropic) flow rates. Those tests were carried out at a constant octahedral stress (τ o = 0.4 MPa), with different relative amounts of shear and compression for different tests, ranging from confined compression alone to shear alone.
The results for minimum strain rate showed that a common octahedral strain rate occurred (allowing for scatter) for all combinations of shear and compression at that common octahedral stress, supporting the Glen flow law for isotropic ice in terms of the octahedral values through Eqns (10) and (23). That work was extended by Reference Li and JackaLi and Jacka (1996), to show that the flow law for octahedral values held for flow rates at minimum creep, under combined shear and compression over a wide range of octahedral stresses, and shear and compression component stresses, with the power law exponent, n = 3 (these experiments form part of the dataset reanalysed here). From the complete set of minimum strain rates presented in Table 1 we obtain an average value for the octahedral flow rate parameter at minimum creep of k o = 5.9 × 10⁻⁶ s−1 Mpa−3, or k o = 5.6 × 10⁻⁶ s−1 Mpa−3 if an extreme outlying value is discarded. This is in good agreement with k o = 5.5 × 10⁻⁶ s−1 Mpa−3 deduced from the simpler shear-alone and unconfined-compression-alone experiments reported in Section 1.2.
For tertiary flow rates in the combined shear and compression experiments at fixed octahedral stress (τ o = 0.4MPa, data also included here), Reference Li, Jacka and BuddLi and others (1996) found a monotonic increase in octahedral strain rate, with increasing dominance of the shear stress component. This gave an enhancement factor, relative to the minimum octahedral strain rate, increasing from about E C = 3, for longitudinally confined compression alone, to about E s = 10–12, for shear alone. Reference Li, Jacka and BuddLi and others (1996) found that the variation between these two extremes could be parameterized in terms of the compression and shear fractions λ c and λ s, defined (for shear and longitudinally confined compression) by

These can also be expressed in terms of the stress deviators (s zz = −S = −σ/2 and sxz = τ) as

For an arbitrary combination of shear and longitudinally confined normal compression stress with compression fraction λ c, an empirical expression for the corresponding tertiary octahedral flow rate enhancement factor, E o(λ c), was provided by Reference Li, Jacka and BuddLi and others (1996):

It was found from the experiments thst the time sseries for the octahedral strain rate, ![]() , considered as a function of octahedral strain, ε
o, showed a clear minimum at ε
o ∼ 1%, and a well-established steady tertiary octahedral strain rate at ε
o ∼ 10−20%. Between minimum and tertiary strain, anisotropic ice crystal orientation fabrics also developed, with patterns related to the shear and compression fractions (Reference LiLi, 1995), similar to those illustrated in Figure 3.
, considered as a function of octahedral strain, ε
o, showed a clear minimum at ε
o ∼ 1%, and a well-established steady tertiary octahedral strain rate at ε
o ∼ 10−20%. Between minimum and tertiary strain, anisotropic ice crystal orientation fabrics also developed, with patterns related to the shear and compression fractions (Reference LiLi, 1995), similar to those illustrated in Figure 3.
Although relations between octahedral stress and strain rates in combined stress experiments were established in these studies, the relations between the individual shear and compression components were not addressed. The presentation of detailed results and analysis of the relationships between these separate component strain rates for shear and compression in combined stress tests is the principal object of this paper. (Some analyses of component flow relations were briefly presented by Reference Warner, Jacka, Li, Budd, Hutter, Wang and BeerWarner and others (1999), as mentioned below.)
6. Time and Strain Series for Individual Shear and Compression Strain-Rate components
The time and strain series for the separate component strain rates for shear, ![]() , and confined compression,
, and confined compression, ![]() , as well as the octahedral strain rate,
, as well as the octahedral strain rate, ![]() , are shown in Figures 4 and 5 for three typical cases chosen from the data set to represent
, are shown in Figures 4 and 5 for three typical cases chosen from the data set to represent
-
1. high shear and low compression deviators (test 2),
-
2. comparable shear and compression deviators (test 22),
-
3. high compression and low shear deviators (test 18).
The series in Figure 4 are shown as functions of time, while the corresponding time series for strain rates as functions of the accumulated component strains (or octahedral strain ε o, as appropriate) are shown in Figure 5. Further time series of shear strain rates (Fig. 6a) and compressive strain rates (Fig. 6b) are presented from the dataset to show the influence of increasing compressive stresses on shear flow and vice versa. Once again, the examples are chosen to cover the three classes of stress regime listed above, as indicated in the Figure 6 caption.
The time-series data presented here (including Figs 4–6) are a re-analysis of experimental data from Reference Li, Jacka and BuddLi and others (1996) and Reference Warner, Jacka, Li, Budd, Hutter, Wang and BeerWarner and others (1999). The low recording frequency of sample displacement during these experiments translates into creep curves with relatively few data points. To aid determination of minimum and tertiary strain rates (Table 2) and to improve the clarity of Figures 4–6, cubic spline fitting has been used to generate curves of best fit for each experiment. In Figures 4–6, v is the rms fractional deviation of each strain-rate observation, ![]() , from the corresponding fitted value,
, from the corresponding fitted value, ![]() .
.

Typically, v ∼ 0.05; in all cases where higher overall values occur, they are caused by discrepancies between the curve of best fit and data during either primary or secondary (minimum) creep. Viewed alone, the correspondence between the curve of best fit and the data during tertiary creep is high for all experiments. The decrease in tertiary creep rates, at strains exceeding ∼10%, for some experiments in Figures 4 and 6 is related to a decrease in the applied stresses with increasing strain. This arises from the combined influence of sample distortion, due to the Poisson effect, and the application of constant loads, which are based on the initial sample dimensions.
Reference Li and JackaLi and Jacka (1996) showed that, for this type of combined stress test, the minimum octahedral strain rate follows a Glen-type cubic dependence on the octahedral stress. The strain-rate minima for the individual components do not follow such a relation, and, particularly in the case of widely differing component deviators, the minimum for the smaller component may occur while still in the anelastic range of strain for that component. Consequently the component tertiary strain-rate enhancements will be examined here with reference to the more regular octahedral minimum strain rates. In Figure 6 all component strain-rate time series are plotted as a function of the octahedral strain to maintain synchronicity.
There are two important points to note regarding these time series. First, when the component deviators are different the minimum strain rates are generally reached at different times for each component (Fig. 4). Because of the differing strain rates this means that for a given experiment the minima are also generally reached at different component strains (Fig. 5). The time of occurrence of the minimum strain rates tends to be set by the dominant strain-rate component, or rather by the octahedral rate. Second, for high shear and low compression (e.g. Fig. 4a), the enhancement for the tertiary shear strain-rate component (ratio of tertiary to minimum octahedral strain rates) tends to be high (cf. data in Table 1). For high compression (e.g. Fig. 4c) this enhancement in the shear rate tends to be less. In Figure 6a, which demonstrates the influence of increasing normal compressive stress for a fixed shear stress, the tertiary shear strain rates increase with increasing compression in basic accord with (or slightly below) the indicated predictions of the Glen flow law (Eqn (12)) for n = 3. However, the tertiary compressive strain rates in Figure 6b show a much stronger influence of increasing shear stress (cf. Table 1) than expected from Eqn (13) with n = 3, with the examples in Figure 6b showing increases around two to three times the expectations, as indicated by the arrows in the figure. That is, it appears that in tertiary flow, shear tends to enhance compression much more than compression enhances shear. These qualitative observations are brought out more clearly and quantitatively in the following sections by examining the interdependence of the shear and compression flow rates implied by the Glen relation.
7. Minimum Strain Rates for Shear and Compression Components
It was shown by Reference Budd and JackaBudd and Jacka (1989) that for single-component experiments the minimum strain rate occurred as a result of the decreasing anelastic strain rate being overtaken by increasing plastic-flow strain rate associated with crystallographic changes. For combined stress experiments, as shown in Figure 4, the minimum strain rates for the shear and compression components (as well as the octahedral strain rate) may occur at different times. The time to minimum is determined primarily by the magnitude of the dominant (or octahedral) stress. This means that a component with a lower strain rate may reach minimum at a smaller component strain (Fig. 5) than the typical 0.5–2% octahedral strain at which the minimum strain rate is reached in the separate individual stress component tests. Consequently the duration of the low strain rates near the minimum may be small (in strain terms) for these cases, lasting less than a few tenths of 1% strain.
In single stress experiments the minimum strain rates provide a useful reference for examining tertiary strain-rate enhancement and are proportional to the octahedral rates anyway. In terms of practical applications, the minimum strain rates for the individual components in a combined stress configuration are not very useful, because of their short strain duration and transitory nature, with transient anelastic processes still active. To make use of the minimum strain rates, it is necessary to consider the full temporal variation of the strain rate under constant stress as well as the initial state of the material and the long-term anelastic response. For ice moving slowly through a varying stress field, if ∼10% strain occurs before there is a significant change of stress regime, then the equilibrium tertiary flow conditions can be assumed, otherwise there could be a lag between the changing stress and equilibrium tertiary flow rate. For the tertiary strain rates, the time dependence becomes unimportant because the steady-state strain rate develops along with statistically steady-state crystal size, orientation fabrics, recrystallization and rotation rates. This makes the tertiary flow rates, for given stress configurations, the most appropriate to use for most field applications where near-steady-state or equilibrium flow conditions apply.
8. Interdependence of Shear and Normal Compression
For the present experimental tertiary creep data the normal and shear stresses can be regarded as independent variables, but in general this does not apply to the corresponding strain rates. For linear stress–strain relations, i.e. n = 1 in Eqns (12) and (13), the shear strain rate is independent of the normal compression, and the compressive strain rate is independent of the shear stress. The experimental data (Table 1) allow us to examine (1) how the shear strain rate (under constant shear stress) varies with increasing normal stress and (2) how the compressive strain rate (under constant normal stress) varies with increasing shear stress.
We begin our examination of the separate shear and compression strain-rate components using the corresponding component flow relations of Eqns (12) and (13) derived from the Glen flow law. For shear alone (σ = 0) and compression alone (τ = 0) we have respectively
and
If the Glen–Nye second-invariant relation holds, then for a constant shear stress τ the addition of compression with deviator S multiplies the strain rate for shear alone, Eqn (33a), by a factor of

Similarly the addition of a shear stress τ to a fixed compressive stress S multiplies the compression rate for compression alone, Eqn (33b), by

In order to test whether the data follow these relations over the full range of experiments (where the ratios τ/S and S/τ can become large), it is convenient to replace the shear fractions λ c and λ s with the ‘angular’ variables r c and r s (collectively ri ) where

and

The value of r s varies from 0 to 1 as θ s ranges from 0 to π/4, while τ/S varies from 0 to ∞. The two angles θ c and θ s are simply related by
and correspondingly
The linear relations between θ
cand θ
s or r
c and r
s allow all the strain-rate data to be plotted against r
c or r
s (as appropriate) on the one diagram, to show the full range of variations of ![]() and
and ![]() , including the data for shear alone (S = 0) and compression alone (τ = 0) (cf. Reference Warner, Jacka, Li, Budd, Hutter, Wang and BeerWarner and others, 1999).
, including the data for shear alone (S = 0) and compression alone (τ = 0) (cf. Reference Warner, Jacka, Li, Budd, Hutter, Wang and BeerWarner and others, 1999).
As discussed above, the minimum strain rates support a constant value of the power index n = 3 for deformations under shear or compression alone, and for the octahedral values for the combined stress experiments. Tertiary rates also support n = 3 for shear or compression alone, but with different enhancements of the octahedral flow rates above minimum creep rate.
In order to examine how the tertiary shear rate, ![]() , is influenced by an increasing compression deviator, S, as a function of S/τ , and how the tertiary compression rate,
, is influenced by an increasing compression deviator, S, as a function of S/τ , and how the tertiary compression rate, ![]() , is influenced by increasing shear stress, τ, as a function of τ/S the variations of the strain rates with τ
3 for
, is influenced by increasing shear stress, τ, as a function of τ/S the variations of the strain rates with τ
3 for ![]() and S
3 for
and S
3 for ![]() may effectively be removed as in Eqns (34) and (35). We can further normalize the corresponding ratios to unity for shear alone and compression alone respectively. This also enables the measurements to be compared with the Glen second-invariant formulation given by Eqns (34) and (35).
may effectively be removed as in Eqns (34) and (35). We can further normalize the corresponding ratios to unity for shear alone and compression alone respectively. This also enables the measurements to be compared with the Glen second-invariant formulation given by Eqns (34) and (35).
In Figure 7, for tertiary flow, the normalized values of the ratios ![]() for shear (crosses) and
for shear (crosses) and ![]() for compression (squares) are plotted on a log scale, against r
c and r
s respectively, corresponding to increasing relative compression, S/τ, and increasing relative shear, τ/S. A similar display of an earlier interpretation of the present data was provided by Reference Warner, Jacka, Li, Budd, Hutter, Wang and BeerWarner and others (1999). Also shown is the single common curve (solid) representing the Glen flow law relations of Eqns (34) and (35), when normalized by the enhancement factors to give a common relative strain rate in shear alone and compression alone (the additional curves shown in Figure 7 are for more general flow relations described later).
for compression (squares) are plotted on a log scale, against r
c and r
s respectively, corresponding to increasing relative compression, S/τ, and increasing relative shear, τ/S. A similar display of an earlier interpretation of the present data was provided by Reference Warner, Jacka, Li, Budd, Hutter, Wang and BeerWarner and others (1999). Also shown is the single common curve (solid) representing the Glen flow law relations of Eqns (34) and (35), when normalized by the enhancement factors to give a common relative strain rate in shear alone and compression alone (the additional curves shown in Figure 7 are for more general flow relations described later).

Fig. 7. The influence of increasing compression on the shear rate, and of increasing shear on the compression rate, for steady-state tertiary flow. The normalized ratios of component strain rates to the cube of the component stress deviators i.e. ![]() for shear and
for shear and ![]() for compression, are shown as a function of the relative increase in the other component stress, through
for compression, are shown as a function of the relative increase in the other component stress, through ![]() for shear strain rate and
for shear strain rate and ![]() for compression. Also shown are the curves for the Glen-type flow relation from Eqns (34) and (35) (solid curve) and curves for the regression models: shear component from Eqn (41) (lighter dashed curve), and for compression from Eqn (42) (lighter dot-dashed curve). The corresponding predictions of the scalar function flow relation from Eqns (54) and (55) (for E
S = 4.5E
C) are shown as the corresponding bolder curves.
for compression. Also shown are the curves for the Glen-type flow relation from Eqns (34) and (35) (solid curve) and curves for the regression models: shear component from Eqn (41) (lighter dashed curve), and for compression from Eqn (42) (lighter dot-dashed curve). The corresponding predictions of the scalar function flow relation from Eqns (54) and (55) (for E
S = 4.5E
C) are shown as the corresponding bolder curves.
Because of the normalization of the strain rates by τ 3 and S 3, the values plotted represent second-order deviations from the cubic relations due to the presence of the other independent stress. Consequently a considerable amount of scatter can be expected from the experimental data over such a broad range of stress. In spite of the scatter, there is a clear indication that the values for compression on average lie well above the curve for the Glen flow law, and that the values for shear lie well below the Glen curve. This means the addition of a shear stress to normal compression increases the tertiary compression rate more than the Glen flow law would give, whereas addition of a compressive stress to shear increases the tertiary shear rate less than the Glen flow law indicates. These deviations are more marked for large values of the angular variables r c and r s.
Recall that both sets of strain rates have been normalized to the respective strain rates for shear alone and compression alone, which corresponds to multiplying the octahedral flow parameter k o in Eqns (34) and (35) by the enhancement factors E s and E c respectively. The fact that E s is ∼4.5 times E c means that without normalization the shear strain-rate data would plot above the compression data in Figure 7 for low values of ri and therefore have a zone of overlap at higher values of ri .
There is relatively little effect of the additional stress in either case, up to values for which the two deviators are nearly equal (r
c = r
s = 0.5), but for large values of the added stress component the relative ratios of the normalized observed compression to shear rates could reach an order of magnitude or more. In practical terms, for any given applied stress deviator, the application of an additional independent deviator to a material obeying a Glen flow law, effectively makes the material appear more deformable to the first applied stress, through the presence of the octahedral stress term, ![]() in Eqns (12) and (13).
in Eqns (12) and (13).
From the results presented here for tertiary flow rates of ice, the addition of shear to compression appears to make the material even more deformable in compression than the Glen flow law indicates, while the addition of normal compression to shear softens the material in shear less than the Glen flow law would indicate. The mechanism for these effects most likely relates to the evolution towards the compatible steady-state tertiary polycrystalline microstructure, including the crystal size, fabric, texture, dislocation density and the rate of recrystallization. Further consideration of these mechanisms is beyond the scope of the present paper. The qualitative remarks above regarding the influences on the individual component flow relations are further quantified in the following section.
9. The Flow Relations for the Individual Shear and Compression Components
The experimental data depicted in Figure 7 were further analysed, to examine the departure from the normalized versions of the Glen relations, Eqns (34) and (35). We considered possible alternative relations by plotting on log– log axes the respective left-hand sides against λ s and λ c. The data indicate that a better-fitting empirical flow relation may be expressed by

and

corresponding to the shear and compression relations
and (provided S ≠ 0)
where ![]() and
and ![]() .
.
This analysis requires some qualification if the compressive stress vanishes, at least to remain within our declared class of relationships between stresses and strain rates, as discussed below.
This has been examined further by separate regression analyses of relations of the type
for the data from Table 1. The analyses give more support for p ≈ 1, q ≈ 2 for the shear strain rate, and p ≈ 3, q ≈ 0 for the compressive strain rate, rather than p = 2 and q = 1 in both cases for the Glen flow law. The relations for the shear and compression rate components can then also be written as

Curves following these relations, normalized to common values for shear alone and compression alone, are shown in Figure 7. The thin dashed curve for shear, and the thin dot-dashed curve for compression pass reasonably well through the shear and compression data points respectively. There is a certain symmetry with respect to the Glen flow relation (solid curve), with the shear strain-rate data points falling about as far below (on the log strain-rate vertical scale) as the compression points lie above. It should be noted that the validity of Eqn (42) for the compressive strain rate is questionable as it has the property that ![]() when S = 0.
when S = 0.
The question now arises as to whether these relations obtained for the individual components of shear and compression strain rates are compatible with the relation for octahedral strain rate in combined shear and compression as determined by Reference Li and JackaLi and Jacka (1996) and Reference Li, Jacka and BuddLi and others (1996).
10. Octahedral Strain Rate in Combined Shear and Compression Revisited
If it is assumed that the expression for octahedral strain rate for these combined shear and compression tests given by Eqn (23) is still appropriate for representing the octahedral strain rate as the rms value of the principal strain rates, then the empirically based relations for ![]() and
and ![]() from Eqns (41) and (42) can be used to evaluate
from Eqns (41) and (42) can be used to evaluate ![]() . In this case, the common flow parameter, k
o, for minimum octahedral strain rate from the separate shear-alone and compression-alone experiments is used together with the respective enhancement factors in tertiary flow relative to that of minimum (E
s and E
c) to give
. In this case, the common flow parameter, k
o, for minimum octahedral strain rate from the separate shear-alone and compression-alone experiments is used together with the respective enhancement factors in tertiary flow relative to that of minimum (E
s and E
c) to give

and

Using Eqn (23) the octahedral strain rate, ![]() , is given by
, is given by

This equation shows how the octahedral strain rate in combined shear and compression would vary from compression alone (λ
s = 0) to shear alone (λ
s = 1) for any combination of S and τ as well as τ
o, for the component flow relations (Eqns (45) and (46)). Since E
S ≈ 4.5E
C, averaged over the entire dataset, the value of ![]() for λ
s = 1 is ∼15% larger than E
s. Thus, the octahedral strain rate for tertiary flow in combined shear and compression increases monotonically from the compression rate (with enhancement E
c )for compression alone, to approximately the shear rate (with enhancement
for λ
s = 1 is ∼15% larger than E
s. Thus, the octahedral strain rate for tertiary flow in combined shear and compression increases monotonically from the compression rate (with enhancement E
c )for compression alone, to approximately the shear rate (with enhancement ![]() ) for shear alone following Eqn (47).
) for shear alone following Eqn (47).
Based on the findings of Reference Treverrow, Budd, Jacka and WarnerTreverrow and others (2012), future combined stress experiments may suggest a downward revision of E S ≈ 4.5E C. Their analysis of shear-alone and compression-alone experiments conducted over a broader range of stresses than considered here suggests E S ∼ 2.3E C. This is attributed to a dependence of E S and E C on τ o and an alteration to the compression experiment method where the influence of the Poisson effect on decreasing the compression deviatoric stress with increasing strain is taken into consideration. This results in slightly higher E C values for a given τ o.
The variation in tertiary creep rate over this full range of the data is illustrated in Figure 8a which shows the (suitably normalized) ratio of the tertiary octahedral strain rate, ![]() , to the cube of the octahedral stress, i.e.
, to the cube of the octahedral stress, i.e. ![]() , plotted against r
s = (2/π) tan−1 (τ/S). In spite of the scatter (which is expected to be large for these second-order effects over such a large range of stresses), the data show a reasonable match to the symmetric trend given by the dashed curve corresponding to Eqn (47). This relation also provides a better fit to the whole dataset than does the previous relation, Eqn (31), originally proposed by Reference Li, Jacka and BuddLi and others (1996).
, plotted against r
s = (2/π) tan−1 (τ/S). In spite of the scatter (which is expected to be large for these second-order effects over such a large range of stresses), the data show a reasonable match to the symmetric trend given by the dashed curve corresponding to Eqn (47). This relation also provides a better fit to the whole dataset than does the previous relation, Eqn (31), originally proposed by Reference Li, Jacka and BuddLi and others (1996).

Fig. 8. (a) Dependence of the (normalized) ratio of tertiary octahedral strain rate, ![]() and the cube of the octahedral stress,
and the cube of the octahedral stress, ![]() (i.e. the effective tertiary flow parameter) on the relative proportions of the shear and compression deviatoric stresses, as described by the variable r
s. From Eqn (56), the ratio
(i.e. the effective tertiary flow parameter) on the relative proportions of the shear and compression deviatoric stresses, as described by the variable r
s. From Eqn (56), the ratio ![]() is normalized to
is normalized to ![]() at τ =0 (r
s = 0). The dashed curve shows the relationship corresponding to Eqn (47) for E
s = 4.5E
c. The solid curve shows the corresponding relation for the scalar formulation from Eqns (56) and (57), i.e. [E
s
τ
2+ E
c
S
2] / [E
c(τ
2 +S
2)] which fits the experimental data well. (b) Dependence of the quantity
at τ =0 (r
s = 0). The dashed curve shows the relationship corresponding to Eqn (47) for E
s = 4.5E
c. The solid curve shows the corresponding relation for the scalar formulation from Eqns (56) and (57), i.e. [E
s
τ
2+ E
c
S
2] / [E
c(τ
2 +S
2)] which fits the experimental data well. (b) Dependence of the quantity ![]() on the stress configuration parameter r
s, where
on the stress configuration parameter r
s, where ![]() is calculated from Eqns (54) and (55) for the shear and compression components respectively, and Eqn (56) for the octahedral strain rate. These values are normalized by
is calculated from Eqns (54) and (55) for the shear and compression components respectively, and Eqn (56) for the octahedral strain rate. These values are normalized by ![]() for r
s = 0. As in (a), the solid curve is given by [E
s
τ
2 + E
c
S
2]/[E
c(τ
2 + S
2)]. The important result from the scalar formulation here is that the individual strain-rate components for shear and compression follow the same relation as τ
o (Eqns (54) and (55)), as would all tensor components. One outlier (test 17) lies off-scale.
for r
s = 0. As in (a), the solid curve is given by [E
s
τ
2 + E
c
S
2]/[E
c(τ
2 + S
2)]. The important result from the scalar formulation here is that the individual strain-rate components for shear and compression follow the same relation as τ
o (Eqns (54) and (55)), as would all tensor components. One outlier (test 17) lies off-scale.
Figures 7 and 8a and Eqns (44–47) summarize how, in steady-state tertiary flow under combined shear and compression, the individual shear and compression component strain rates (and the octahedral strain rate) vary with the individual components of shear stress and normal compression, showing the influences of the magnitude of the octahedral stress and the relative sizes of the components. These results, which include the empirical values of the parameters, can be used directly in modelling studies or in the analysis and interpretation of field studies of ice deformation if the appropriate combination of shear and compressive stresses is encountered.
11. Alternative Formulations of the Flow Relations for Combined Stresses
We have examined a number of alternative forms of the flow relation for combined shear and normal stresses in addition to those represented by Eqns (12) and (13) (Glen’s law) and the empirical fitting (Eqns (41) and (42)) proposed above. As noted previously, shear-alone experiments by Reference Li, Jacka and BuddLi and others (2000) have shown that vertical strain where there is no corresponding deviatoric stress is an experimental artefact that can be avoided through appropriate selection of the sample geometry. Consequently the unresolved problem regarding the nonzero compression rate for shear alone, which is a feature of Eqn (42), deserves further investigation.
One alternative formulation which avoids this problem, while remaining clearly within the class of flow relations for which we can reasonably deduce deviatoric stresses, and which provides a reasonable match to the data, was presented by Reference Warner, Jacka, Li, Budd, Hutter, Wang and BeerWarner and others (1999). In brief, a candidate expression for the octahedral strain rate, which varies with the cube of the octahedral stress and has a monotonic increase in enhancement in tertiary strain rate from E c in compression alone (λ c = 1) to E s in shear alone (λ s = 1), is
This equation can also be written in terms of τ and S by substituting for λ s and λ c.
There is nothing sacrosanct about the use of the octahedral stress in an anisotropic situation and it may be more useful to consider a weighted rms stress of the form

where
Equation (48) for the octahedral strain rate can then be written as
This is then compatible with the individual shear and compression strain rates being given by
and
with ![]() giving Eqn (51). Equations (52) and (53) for the individual components are analogous to Eqns (41) and (42) of the previous formulation and Eqns (12) and (13) for the Glen flow law.
giving Eqn (51). Equations (52) and (53) for the individual components are analogous to Eqns (41) and (42) of the previous formulation and Eqns (12) and (13) for the Glen flow law.
There is also a smooth variation in ![]() from the tertiary enhancement of E
C in compression alone, to E
S in shear alone, with r
c or r
s, similar to that shown in Figure 8a, again giving a better fit to this more extensive dataset than the empirical Eqn (31) obtained from the more limited data of Reference Li, Jacka and BuddLi and others (1996).
from the tertiary enhancement of E
C in compression alone, to E
S in shear alone, with r
c or r
s, similar to that shown in Figure 8a, again giving a better fit to this more extensive dataset than the empirical Eqn (31) obtained from the more limited data of Reference Li, Jacka and BuddLi and others (1996).
The term ![]() , which can be referred to as a weighted mean shear stress, by analogy with τ
o may be considered to play a similar role in the anisotropic tertiary flow law to that which the octahedral stress plays in Glen’s flow law. The expressions for octahedral strain rate and the strain rates for the individual shear and compression components (Eqns (52) and (53)) have similar expressions to the Glen flow law but in terms of
, which can be referred to as a weighted mean shear stress, by analogy with τ
o may be considered to play a similar role in the anisotropic tertiary flow law to that which the octahedral stress plays in Glen’s flow law. The expressions for octahedral strain rate and the strain rates for the individual shear and compression components (Eqns (52) and (53)) have similar expressions to the Glen flow law but in terms of ![]() rather than τ
o, and with different constants for the different components.
rather than τ
o, and with different constants for the different components.
In spite of the similarity to the Glen relations, the description above is a no longer a scalar representation of the flow law of ice, which is not unexpected for anisotropic flow. Indeed, recalling that we are working here with a specific choice of coordinate frame, the two different constants, α = E S 1/3 and β = E C 1/3 could just be regarded as part of a more general fluidity matrix, as seen in that frame. This parameterization of the present experiments might be useful in exploring general tensor viscosity relationships, and in connecting our experiments with flow relations based on crystal anisotropy (e.g. Reference LileLile, 1978; Reference Azuma and Goto-AzumaAzuma and Goto-Azuma, 1996; Reference ThorsteinssonThorsteinsson, 2001; Reference Gillet-Chaulet, Gagliardini, Meyssonnier, Montagnat and CastelnauGillet-Chaulet and others, 2005; Reference Seddik, Greve, Placidi, Hamann and GagliardiniSeddik and others, 2008). The appropriate path to be pursued to construct a general flow relation from the present partial information is less obvious within our framework of considering only compatible tertiary flow situations.
However, we have also developed a scalar formulation of the tertiary ice flow relations, which provides an even closer fit to the present set of experimental data than that presented above from Reference Warner, Jacka, Li, Budd, Hutter, Wang and BeerWarner and others (1999), and which may be simpler to use in numerical modelling.
This formulation, with a non-Newtonian scalar fluidity that contains both nonlinearity and anisotropy in a single common factor via another version of the weighted rms value of the stresses, may be expressed by the following flow relations, which correspond to Eqns (52), (53), (51) and (49) respectively:
and
where

is a new weighted mean stress, and τ o is the octahedral stress.
These relations also match the present data well, including the tertiary shear and compression component strain rates, as seen by the corresponding bolder curves in Figures 7 and solid curves in Figure 8a and b. Figure 8b is similar to Figure 8a, with the addition of experimental data for the separate tertiary shear and compression component strain rates, and indicates that these have a dependence on r
s and level of fit to Eqn (56) similar to those of the octahedral strain rates. Small discrepancies from the data exist at the extremities of Figure 8b (where r
s → 0 and r
s→ 1) with the minor strain-rate components higher than would be expected from a precise scalar fit. This behaviour may be related to the compromised sample aspect ratio chosen for these experiments (as shown by Reference Li, Jacka and BuddLi and others, 2000). Note that if one defines an enhancement function by ![]() , where λ
c is the compressive stress fraction (Eqn (30)), then this provides a particular functional form for a scalar enhancement factor function applicable to the standard Glen flow relation, analogous to that used by Reference Wang, Warner and BuddWang and others (2002) to model the strain rates through the depth of an ice sheet.
, where λ
c is the compressive stress fraction (Eqn (30)), then this provides a particular functional form for a scalar enhancement factor function applicable to the standard Glen flow relation, analogous to that used by Reference Wang, Warner and BuddWang and others (2002) to model the strain rates through the depth of an ice sheet.
A scalar flow relation works so well because in tertiary flow both the shear and compression components are strongly increased by large values of the other stress deviator, even when the developing fabrics might have been supposed to become more disadvantageous (harder glide) for the component in question, as shown by considering Figures 3–5, together with Table 2. Furthermore, most of the asymmetry of the tertiary flow rates for the shear and compression components is well captured by the asymmetry in the expression for T o, with the different values of the single stress enhancement factors, E S and E C.
Table 2. Statistics of ice crystal orientation fabrics (angles in degrees) for fabrics a–f shown in Figure 3. The c-axis angles are measured relative to the x, y, z, axes with z vertical, x along the shear direction and y transverse, as shown in Figure 1. φ is the angle between the c-axis and the vertical (co-latitude).χ is the angle between the vertical and the projection of the c-axis in the (y, z) plane. ψ is the angle between the vertical and the projection of the c-axis in the (x, z) plane. χ = tan−1(tan φ sin θ); ψ = tan−1(tan φ cos θ), where θ is the angle between the projection of the c-axis in the (x, y) plane and the x-axis (i.e. the c-axis longitude, measured from the shear direction). ![]() is the mean colatitude and
is the mean colatitude and ![]() its standard deviation, φ
1/2 is the median angle from the vertical (enclosing 50% of the total number of c-axes) and φ
1/4 is the first quartile angle from the vertical (enclosing 25% of the total axes)
its standard deviation, φ
1/2 is the median angle from the vertical (enclosing 50% of the total number of c-axes) and φ
1/4 is the first quartile angle from the vertical (enclosing 25% of the total axes)

The present results involve horizontal shear and vertical compression confined in the direction of shear, with extension possible in the transverse direction. It would be desirable to rearrange the experimental apparatus to study the compression confined in the transverse direction, i.e. with extension possible only along the shear direction. These two types of confined compression represent extremes, which when combined with unconfined compression should provide a reasonable coverage of the more general situation of an arbitrary amount of transverse extension relative to the longitudinal extension in the line of flow.
Thus far, Eqns (54–57) simply reflect a scalar flow relation that covers the particular stress configurations covered by our experiments, but unlike our earlier suggestions it does offer scope to contemplate possible generalizations. Other authors (e.g. Reference Placidi and HutterPlacidi and Hutter, 2006 and the CAFFE model of Reference Seddik, Greve, Placidi, Hamann and GagliardiniSeddik and others, 2008; Reference Placidi, Greve, Seddik and FariaPlacidi and others, 2010) have also suggested using scalar anisotropic flow relations, generalizing the formulation of Glen and Nye (Eqns (9) and (11)) by introducing dependencies of B, or equivalently an effective tertiary k o, involving the applied stresses and crystal axis orientations. This approach is partly a simplification but is also necessitated by the scarcity of direct laboratory measurements of ice flow responses under combined stresses.
12. Speculations About Generalizing the Scalar Flow Relation
Although experimental data for the other combinations of shear and compression are not yet available, we speculate that a useful generalization of the present scalar anisotropic flow relation might be made for the tertiary flow of ice, for situations involving shear with a non-rotating shear plane, combined with a compression (or extension) normal to that plane and a partition of transverse and longitudinal normal deformations. A major simplification of the scalar flow relation is that ratios of strain rates are equal to ratios of the corresponding deviatoric stresses. Arbitrary stress (or strain-rate) fields can in principle always be resolved to find the shear acting on a non-rotating shear plane (if present) and the stress normal to that plane (Reference JaegerJaeger, 1969). Note that in general there will also be stresses acting within the non-rotating shear plane, including the deviatoric stresses required to counter any normal compression. Since the enhancement of tertiary flow rates above minimum for confined compression alone and unconfined compression alone are approximately the same, we make the assumption that this approximate equality also holds for intermediate degrees of confinement in the longitudinal or transverse directions. Accordingly, by parameterizing the normal deformations in the x and y directions (and hence also the corresponding deviatoric normal stresses) in terms of the compressive strain rate via ζ, where ![]() and
and ![]() , we can extend the expressions of Section 1.2 to treat the more general distribution of normal deformations in the (x, y) plane:
, we can extend the expressions of Section 1.2 to treat the more general distribution of normal deformations in the (x, y) plane:

with octahedral strain rate given by

and corresponding deviatoric stresses given by

This leads us to postulate that the generalization of T o should be the analogous quadratic invariant constructed from the following weighted version of the deviatoric stress tensor (in the specific reference frame of the non-rotating shear plane):

leading to the expression

where τ is the shear stress on a non-rotating shear plane, S is the deviatoric compressive stress acting normal to that plane, and ζ describes the proportions of the normal stress deviators acting longitudinal and transverse to the shear direction. The flow law Eqns (54–56) then hold in this more general case, just by using the more general expression for T o, which of course includes the previous case of Eqn (57) for ζ = 1 and unconfined compression when ζ = 1/2.
We can also speculate that this situation might generalize even further, to completely general stress conditions, as follows. If we identify the unit normal to the non-rotating shear plane by ![]() , then the normal deviatoric stress on that plane has magnitude
, then the normal deviatoric stress on that plane has magnitude ![]() (nisiknk
in terms of components of the deviatoric stress tensor) and
(nisiknk
in terms of components of the deviatoric stress tensor) and ![]() , the shear component of the stress vector acting on that plane, has components
, the shear component of the stress vector acting on that plane, has components ![]() . The essential requirement in constructing an anisotropic scalar flow relation is clearly to distinguish the influence of the shear acting on the non-rotating shear plane. A simple approach might be to simply use
. The essential requirement in constructing an anisotropic scalar flow relation is clearly to distinguish the influence of the shear acting on the non-rotating shear plane. A simple approach might be to simply use ![]() in such a construction, but for consistency with our focus on the role of the movement picture and the non-rotating shear plane we consider a further refinement. The vorticity vector for the flow
in such a construction, but for consistency with our focus on the role of the movement picture and the non-rotating shear plane we consider a further refinement. The vorticity vector for the flow ![]() contains information about the rotation rate, and it must lie in the non-rotating shear plane. Since our interest here is in flow relations at the local material scale, it may be necessary in modelling applications to correct the vorticity for any contributions associated with large-scale rigid-body rotations of ice flow. The local vorticity provides the normal to the plane containing
contains information about the rotation rate, and it must lie in the non-rotating shear plane. Since our interest here is in flow relations at the local material scale, it may be necessary in modelling applications to correct the vorticity for any contributions associated with large-scale rigid-body rotations of ice flow. The local vorticity provides the normal to the plane containing ![]() in which the simple shear acts. More precisely, any component of the shear traction
in which the simple shear acts. More precisely, any component of the shear traction ![]() parallel to the local vorticity does not participate in the simple shear, and can be projected out using the unit vector parallel to the vorticity,
parallel to the local vorticity does not participate in the simple shear, and can be projected out using the unit vector parallel to the vorticity, ![]() , to form the non-rotating shear stress vector:
, to form the non-rotating shear stress vector: ![]() Accordingly, a further generalization of T
o can be envisaged:
Accordingly, a further generalization of T
o can be envisaged:
where τ
o is the octahedral stress and ![]() is the square of the magnitude of the non-rotating shear stress vector. This enables the hypothetical flow relations to be written using this particular weighted rms shear stress (in an arbitrary Cartesian coordinate frame) as
is the square of the magnitude of the non-rotating shear stress vector. This enables the hypothetical flow relations to be written using this particular weighted rms shear stress (in an arbitrary Cartesian coordinate frame) as
covering all the stress deviator and strain-rate components. This naturally reduces to our previous relationships above. It will be interesting to see if it is validated by further experiments and observations. If not, then a more general tensor formulation of fluidity may be required, rather than the scalar relation we present here.
13. Summary and Conclusion
Deformation tests reaching steady-state tertiary flow, in combined shear and normal compression, have now been completed covering a wide range of stresses for each of the individual shear and compression components. The results confirm a cubic relationship between the octahedral stresses and strain rates, and similar relationships apply, with different constants, for the separate shear and compression components in tertiary flow, for fixed values of the ratio of the shear stress, τ, to the compression deviator, S.
At minimum strain rate the results for the octahedral stress and strain rates in the present combined tests, as well as earlier tests with compression or shear alone conform to the relation
with k o = 5.6 × 10⁻⁶ s−1 Mpa−3 at −2°C. It is expected that the results obtained here should carry over to other temperatures through the dependence implicit in the varying activation energy values given by Reference Budd and JackaBudd and Jacka (1989), which were confirmed for single stress tests of shear and compression.
In tertiary flow for the combined stress experiments, the enhancement factor for the octahedral strain rate relative to the common minima in the separate stress experiments increases monotonically from E c ≈ 3 for compression alone to E s ≈ 12 (in these tests) for shear alone.
For the individual component strain rates it has been found that the presence of the other stress component does increase the tertiary strain rate, but the shear strain rate is increased less by the influence of compression than the Glen flow law would prescribe, whereas the compression rate is increased more than expected from the Glen flow law prediction by the addition of shear stress. This means that, for tertiary (anisotropic) flow, shear stress has more effect on the (normal) compression rate than the compression has on the shear rate.
We developed a scalar function formulation of the flow relation for this particular type of deformation. The anisotropic aspects of the tertiary flow, under the conditions of shear and compression in our experiments, are captured using a modified weighted mean stress to provide the nonlinear scalar function. The reason this works so well is that in the progress towards tertiary flow we observed that both shear and compressive strain rates increased at similar rates to the octahedral strain rate. For the particular stress arrangement of our experiments, shear (τ) and longitudinally confined compressive deviator (S), with the following expression for the ‘weighted mean shear stress’,

we can write, in our reference frame, analogously to the Glen flow relations of Eqns (10), (12) and (13),
and
where k o is the octahedral flow relation for minimum creep flow of isotropic ice.
These relations fit the experimental data as closely as our other formulations, with comparative plots shown in Figures 7 and 8a. They clearly revert to the single-stress-test expressions for shear alone or compression alone, if one of the deviatoric stresses goes to zero. The scalar relation is also confirmed by the components following the same curve as the octahedral values (Fig. 8b).
The corresponding laboratory results are not available for shear combined with unconfined compression, or for the more general case of an arbitrary partitioning of the extensive longitudinal and transverse deformations. Nevertheless, in single stress tests, confined and unconfined compression have similar minimum flow rates and tertiary enhancement factors, for the same deviatoric stresses. This led us to propose generalizing the relations above (Eqns (66–68)) to the case of shear, τ, acting in the direction of flow on a non-rotating shear plane, together with compression normal to that plane and extension in both lateral and longitudinal directions, by replacing Eqn (65) with Eqn (61), i.e.

where for a scalar flow relation ![]() .
.
We also speculated that since, in tertiary flow, shear associated with a non-rotating shear plane is enhanced compared to other deformations, a scalar flow relation for general applied stresses and for an arbitrary Cartesian coordinate frame might take the form
where
involves the octahedral stress, τ o, and the square of the component of the shear stress on the non-rotating shear plane, normal to the vorticity vector, τ ′2.
The simplicity of these relations and their similarity to the Glen flow law would make them relatively easy to use in numerical modelling for a broad class of ice flow situations analogous to those of our laboratory experiments, and potentially for more general situations.
It should be clear that although the analysis here has been made largely in terms of stress deviators and strain rates, the complete flow picture, including rotations, needs to be taken into account, which encompasses the developed compatible anisotropy. The horizontal shear plane treated here does not rotate and is not in general a principal shear plane. The confined compression stress state has a similar two-dimensional stress deviator configuration to that for simple shear, but with a different rotation regime.
Finally, the results presented here for the individual strain-rate components in combined shear and compression provide the most appropriate flow relations to use in the analysis of field deformation studies of ice where combined stress situations are the norm rather than the exception. Furthermore for field situations where the accumulated strain is more than about 10–20% under a uniform stress regime the flow should be expected to be in tertiary flow. Thus in the modelling of ice flow, the general occurrence of implicit combined stresses and large strains means it is more appropriate to use flow relations based on results from combined stress experiments and tertiary flow rates, as presented here, with appropriate values of the flow enhancement parameters as given above.
Acknowledgements
This work was supported in part by the Australian Government’s Cooperative Research Centres Programme through the Antarctic Climate and Ecosystems Cooperative Research Centre (ACE CRC). We acknowledge comments on an earlier version of this work. In particular, we thank Leslie Morland for a useful dialogue regarding the inference of deviatoric normal stresses, and Ralf Greve and two anonymous reviewers, whose interpretation prompted us to include our formulation for a scalar anisotropic flow relation. We also thank Scientific Editor Ralf Greve, Throstur Thorsteinsson and an anonymous reviewer for detailed consideration of the paper. T.H.J. thanks Ralf Greve, in addition, for acting as Chief Editor for the paper.


