


Introduction
Soil nutrition status plays a decisive role in crop pollination, floral resources, physiological responses of flowering crops and its productivity (Phillips et al., Reference Phillips, Shaw, Holland, Fry, Bardgett, Bullock and Osborne2018; Tamburini et al., Reference Tamburini, Bommarco, Kleijn, van der Putten and Marini2019). The financial and environmental impacts of inorganic soil fertilization are of concern in modern and sustainable agriculture. Ways to improve fertilizer use efficiency could help in decreasing cost of production as well as protecting ecosystem services such as insect pollinators (Tamburini et al., Reference Tamburini, Lami and Marini2017). Insect pollinators play an important role in the functioning of agro-ecosystems, because they increase the yield and quality of approximately 35% of crops worldwide and are thus fundamental to food security (Melin et al., Reference Melin, Rouget, Midgley and Donaldson2014; Ramos et al., Reference Ramos, Bustamante, da Silva and Carvalheiro2018). The honey bee (Apis mellifera) and other flower visiting insect's contribution to crop productivity generate billions of rand per annum in South Africa (Melin et al., Reference Melin, Rouget, Midgley and Donaldson2014; Masehela, Reference Masehela2017).
Natural ecosystem services and food crop productivity are under threat due to climate change, unavailability of floral resources, agrochemical inputs, pests and diseases, population pressure and soil degradation (Boreux et al., Reference Boreux, Kushalappa, Vaast and Ghazoul2013; Tamburini et al., Reference Tamburini, Berti, Morari and Marini2016; Ramos et al., Reference Ramos, Bustamante, da Silva and Carvalheiro2018). Many studies on plant pollination interactions report that pollination services may be influenced by the availability of floral resources, soil fertility and prevailing climatic conditions, but the findings focus on how the plant community could affect pollinator abundance and diversity (Gess and Gess, Reference Gess and Gess1993; Klein et al., Reference Klein, Vaissie, Cane, Steffan-Dewenter, Cunningham, Kremen and Tscharntke2007; Carvalheiro et al., Reference Carvalheiro, Veldtman, Shenkute, Tesfay, Pirk, Donaldson and Nicolson2011; Mesa et al., Reference Mesa, Howlett, Grant, Didham and Ni2013; Marini et al., Reference Marini, Tamburini, Petrucco-Toffolo, Lindström, Zanetti, Mosca and Bommarco2015). However, the complementary response of pollinations and other factors that influence crop productivity have not been well explored. There are expectations that interactive responses of insect pollination and soil fertilization management on a crop such as sunflower (Helianthus annuus L.) will vary with environmental location and nutrient availability for plant growth.
Soil fertilization could have consequences on plant–insect pollination interactions, possibly by affecting plant physiological functions, and pollinator communities with an increased threat to biodiversity (Schoukens, Reference Schoukens2017; David et al., Reference David, Storkey and Stevens2019). Information about these consequences is needed for various insect pollinated crops. Ramos et al. (Reference Ramos, Bustamante, da Silva and Carvalheiro2018) reported that practices boosting the abundance and diversity of crop pollinators in ecologically intensified farming led to substantial increases in bean productivity (a crop with high nitrogen-demand that benefits from insect pollination). Contrarily, Viik et al. (Reference Viik, Maend, Karise, Laeaeniste, Williams and Luik2012) show that high inorganic soil fertilization is needed for spring oilseed rape to secure more pollinator visitations, leading to increased seed yield and other cross-pollination benefits.
Synergies between soil fertilizer inputs and ecological intensification practices through pollination services lack sufficient research. Tamburini et al. (Reference Tamburini, Lami and Marini2017) gave evidence of nonlinear interactions between crop pollination and nitrogen input on sunflower seed production in Europe. Their findings were contradictory to those of Viik et al. (Reference Viik, Maend, Karise, Laeaeniste, Williams and Luik2012), possibly due to different climatic conditions and crop species used. Therefore, a better understanding is needed of the interactions between pollinator abundance, varying soil available nutrients (especially nitrogen and phosphorus) and sunflower yield under different climatic conditions.
Sunflower, the major oil producing crop in South Africa, depends on insect pollination to yield well. Smallholder and commercial farmers cultivate sunflower, because it thrives in low input systems or marginal environmental conditions due to its temperature, low water and low nutrient tolerance (Department of Agriculture Forestry and Fisheries, 2010). Most common sunflower hybrids exhibit a high level of auto-compatibility. Nevertheless, several studies showed that sunflower hybrids benefit from cross-pollination provided by visiting insects (Chambó et al., Reference Chambó, Garcia, Oliveira and Duarte-Júnior2011; Bartual et al., Reference Bartual, Bocci, Marini and Moonen2018). A number of insects mainly in the orders of Diptera, Lepidoptera, Coleoptera and Hymenoptera have been studied as flowering plant visitors. The honeybee (A. mellifera L.) is the key sunflower visitor and can increase seed yield up to 30% and oil content above 6% in hybrid varieties (Melin et al., Reference Melin, Rouget, Midgley and Donaldson2014). Measures that maximize productivity without impeding the composition of ecosystems are essential for sustainable crop production in South Africa. To achieve this, effective management through better understanding of insect pollination benefits on specific crops is needed (Bommarco et al., Reference Bommarco, Kleijn and Potts2013; Tsiafouli et al., Reference Tsiafouli, Drakou, Orgiazzi, Hedlund and Ritz2017). Interactive responses of varying levels of inorganic soil fertilizer on insect pollination, sunflower physiological growth and yield needs to be explored in order to enhance sustainable crop production under semi-arid conditions. Hence, the objective of this study was to determine the interactive response of fertilizer application and varying insect pollination rates on sunflowers' physiological growth and seed yield.
Materials and methods
Experimental site description
Field trials were carried out during the summer seasons from 11 November to 20 April 2018 and from 28 December 2018 to 13 May 2019 at the research farm of Seotlong Agricultural and Hotel School (28°45′S; 28°85′E, 1660 m asl) located at Phuthaditjhaba, the Free State, South Africa. Different sites on the research farm were used in seasons one and two (Table 1). The region has highly variable climatic conditions with warm to hot months (average annual temperature of 18.4°C) in summer. The winter months can be cold with minimum temperatures of −9.5°C. More than 85% of the annual rainfall (650–850 mm) occurs between September and March (Maloti Drakensberg Transfrontier Programme, 2015). The study sites (Fig. 1) have been used in the past for maize rotated with soybeans and sorghum. This study employed the insect pollinators available in the natural environment. No specific permission was required to conduct this research, because it did not involve endangered or protected species.

Fig. 1. (Colour online) Geographical location of the experimental site at Seotlong Agricultural and Hotel School Free state, South Africa.
Table 1. Chemical properties of soil (0–20 cm) prior to planting at the experimental sites in 2017/18 and 2018/19 seasons

Plant materials and crop management
Sunflower hybrid seeds (cultivar CAP 4000) were obtained from Capstone Seed Company (the Free State, South Africa). Land preparation involved ploughing, disking and rotovating to achieve fine tilth for good seed–soil contact and plots were demarcated manually. The recommended planting density of 25 000–35 000 plants/ha for sunflower under rain-fed conditions was used (Department of Agriculture Forestry and Fisheries, 2010). The seeds were planted at a depth of 25 mm with 1 m inter plot spacing between the plots giving 26 667 plants/ha. The experimental site was 10.1 × 34. 6 m2 (Fig. 2). Three blocks were assigned to each level of fertilizer treatment. Each block (97 m2) contained 12 plots where pollination rates were randomly assigned. Individual plots (4.86 m2) consisted of four rows at a planting spacing of 900 mm between rows and 300 mm within rows (Fig. 2) giving 24 plant stands per plot. The four pollination treatments were replicated three times within a block. Planting in the first season corresponded to the onset of rainfall (occurrence of 25 mm rainfall in 7 days before planting), which is the conventional period for planting sunflower (Department of Agriculture, Forestry and Fisheries, 2010). However, the second planting season was late due to a delay in rainfall. Weeding was done manually.
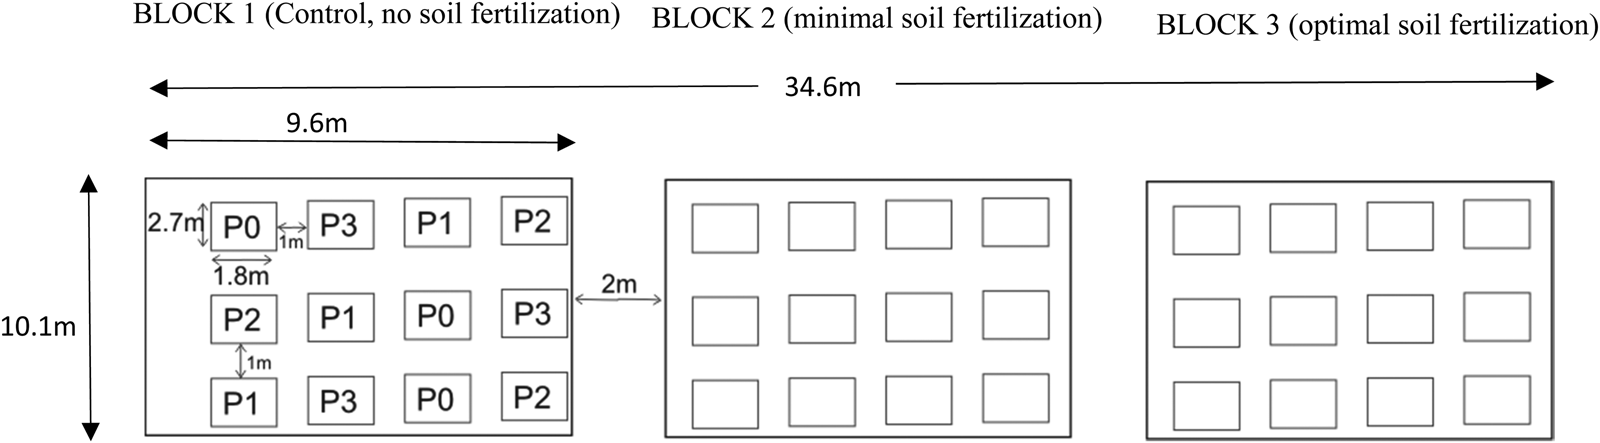
Fig. 2. Experimental design used in the 2017/18 and 2018/19 planting seasons.
P0 = sunflower under 0% pollination rate, P1 = sunflower under 25% pollination, P2 = sunflower under 50% pollination, P3 = sunflower under 100% pollination. Experimental design is 3 × 4 split plot design arranged in RCBD where sunflower, soil fertility levels [control (0 kg/ha N and 0 kg/ha P), minimal (40 kg/ha N: 20 kg/ha P) and optimal (80 kg/ha N: 40 kg/ha P)] and pollination rates (0, 25, 50 and 100%) were factors.
Soil sampling
The soil at Seotlong Agricultural School is shallow and classified as loamy-clay . Prior to planting, composite soil samples (40 samples) were randomly collected from top soil (0–20 cm) and submitted for soil chemical analyses at the soil fertility analytical services section, Department of Agriculture and Environmental affairs, KwaZulu-Natal, South Africa. Soil samples were analysed using rapid procedures described by Hunter (Reference Hunter, Borremiza and Alvarado1975) and Farina (Reference Farina1981) for determination of exchangeable K, exchangeable Ca2+ and Mg2+, while the procedures of Bray (Reference Bray and Kitchen1948) were used for determination of available P. Automated Dumas dry combustion method for total C and N, and Walkley-Black method were used for determination of organic carbon (Walkley and Black,Reference Walkley and Black1934).
Experimental design and layout
Each level of fertility treatment was assigned to a single block. Pollination treatments were randomized with each block, replicated three times. Based on soil chemical results obtained in each season (Table 1), fertilizer application consisted of N and P only, since the soil was not deficient in K. Urea and triple super phosphate granule fertilizers were applied as follows: control (0 kg/ha N and 0 kg/ha P), minimal (40 kg/ha N: 20 kg/ha P) and optimal (80 kg/ha N: 40 kg/ha P). For urea fertilizer, each application rate was split into two equal portions: half was applied through broadcasting in each plot at planting and the remainder was applied as topdressing at 8 weeks after planting (WAP).
Pollination treatments
Pollination treatments were applied when half of the sunflower plants in each plot reached the reproductive stage of R5.3 (30% heads floret open) and R5.6 (60% heads floret open). Within each fertilizer treatment, plots were randomly assigned to four levels of insect pollination (0, 25, 50 and 100% pollination rates). This was done according to sunflower phenology, the onset of the exclusion for 25 and 50% pollination rates was determined as soon as 50% of the sunflower plants in each plot at different soil fertilizations had at least one to two whorls open. The different pollination levels were carried out using pollinator exclusion approach according to Tamburini et al. (Reference Tamburini, Lami and Marini2017) where the number of days that the flowers were exposed to insect pollination were manipulated. This included complete exclusion (0% pollination rate), 1-day visit followed by 3 days of bagging (25% pollination), 1 day visit followed by 1 day of bagging (50% pollination) and all days open to insect visitation (100% pollination rate). Hence, during the hypothetical flowering period of 8 days, insects could visit flower heads 0, 2, 4 and 8 days, for 0, 25, 50 and 100% pollination rates, respectively. Only the 100% pollination rate could be implemented during the 2017/18 season, because the paper bag used did not effectively restrict insects from accessing the whorl especially during the hypothetical 8 days of active flowering periods.
During the 2018/19 season, full exclusion measures were ensured using 600 mm length tulle clothe bags (mesh size 1 mm) which were used to cover the sunflower heads prior to flowering, while other plant parts such as leaves were excluded to reduce any effect on photosynthesis. Bag removal and placement was performed according to the respective pollination treatments between 8.00 and 10.00 a.m. As flower heads expanded during flowering, bags were periodically adjusted to avoid contact with florets.
Plant physiological growth parameters and yield components
The physiological growth parameters were measured prior to the plant shifting to the reproductive stage to validate the effect of fertilization on plants. Observations on growth parameters (plant height and leaf number) and physiological parameters [chlorophyll content index (CCI) and stomatal conductance (gs)] were done on four samples per plant on six randomly selected plants from each sampling plot. The CCI was measured using a portable SPAD meter (SPAD-502-PLUS chlorophyll meter, Konica Minolta, Ramsey, New Jersey, USA) on the adaxial leaf surface. Stomatal conductance was measured from the abaxial leaf surface during midday (12.00 and 14.00 h) using a steady state leaf porometer (Model SC-1, Decagon Devices, USA).
Harvested heads were manually threshed and air dried in the laboratory to <12% moisture content. Yield components such as seed yield (kg/ha), thousand seed weight (kg), fruit weight/head (kg), head diameter (mm) and total biomass (kg/ha) were recorded. An average of six plant stands per plot was used for each parameter. The harvest index was computed as:

Insect sampling and visitation
All insects that touched the floret of the flower were regarded as visitors. An observer walked for 15 min within three plots under the pollination treatments of 25, 50 and 100%, during which insects that touched the reproductive structures of sunflowers were recorded as one visitation regardless of visit duration and numbers of florets touched. All visitors such as bees (Hymenoptera), hoverflies and butterflies (Syrphidae and Lepidoptera) were identified at their family and order levels in the field. Also, other local landscape visitors such as grasshopper (Orthoptera: Acrididae) and ant (Hymenoptera: Formicinae) that visit sunflower flowers in the mountainous agroecosystem were identified. When identification was not possible, the visitor was collected for later identification in the laboratory.
The insect visitation data were collected at the peak of insect visitation which was between 8.00 and 15.00 h with temperatures ≥15°C, no precipitation, dry vegetation and low wind speed (<40 km/h) ( Chambó et al., Reference Chambó, Garcia, Oliveira and Duarte-Júnior2011). When anthesis was completed, tulle bags were placed on all inflorescences in order to prevent damage by birds and to keep the same microclimatic conditions during ripening. The pollinator guild-specific behaviour was controlled according to Tamburini et al. (Reference Tamburini, Lami and Marini2017), where number of inflorescences visited were recorded on a subset of six randomly selected plants during one visitation event, for each pollinator guild (honeybees, beetles, butterflies and hoverflies). The average number of visitation events was then calculated for each guild and it was used to estimate the number of inflorescences visited per plant.
Weather data
Daily weather data were obtained from planting until harvest from an automatic weather station at Uniqwa (Lat 28.5, Long 28.8 and 1699 m asl) managed by the Agricultural Research Council and located at the University of the Free State, QwaQwa which was 1 km from the experimental site. The weather parameters included rainfall (mm), maximum (T x) and minimum (T n) temperatures (°C), maximum (RH x) and minimum (RH n) relative humidity (%) and evapotranspiration (mm).
Statistical analysis
Two standard regression approaches were applied. For models on the yield components and insect visitation, ordinary least squares models were used. These models include only fixed effects and interactions. For plant physiology and growth, linear mixed models were applied as these models also included a random effect (the WAP). The mixed models were fitted using the standard restricted maximum likelihood (REML) approach.
Linear models were used to evaluate the effect of pollination rates, soil fertilization and their interactions on the yield components (fruit head diameter, fruit weight, thousand seed weight, total biomass, seed moisture content and seed yield). The yield components were analysed using Eqn (1):

where F i denotes the intercept for fertilizer i (i = 1…3);P j denotes the Pollination level (0 ≤ P j ≤ 1, j = 1…4) and β P its coefficient; D k denotes the intercept for Date/Year k (k = 1…2); FP ij denotes the Pollination level times an indicator of the Fertilizer and $\beta _i^{FP}$ the corresponding coefficients; FD ik denotes the intercepts for the interaction between Fertilizer and Year; ɛijkl ~ N(0, σ 2) denotes the unexplained random variation around the expected values produced by the factor levels; Y ijkl denotes the observed value obtained with Fertilizer i and Pollination level j in Year k and Replication l (l = 12,3)
The model is implemented as Y i ~ N(x iβ, σ 2) where x i, i = 1…n is a row vector of ones and zeros indicating belonging to a specific level of each factor and factor combination, and β is a column vector of coefficients for each of the elements of x.
The insect visitation rates were analysed using Eqn (3):

where F i denotes the intercept for Fertilizer i (i = 1…3); P j denotes the Pollination level (0 ≤ P j ≤ 1, j = 1…4) and β P its coefficient; D k denotes the intercept for Date/Year k (k = 1…2); FP ij denotes the Pollination level times an indicator of the Fertilizer and $\beta _i^{FP}$ the corresponding coefficients; FD ik denotes the intercepts for the interaction between Fertilizer and Year; ɛijkl ~ N(0, σ 2) denotes the unexplained random variation around the expected values produced by the factor levels; Y ijkl denotes the observed value obtained with Fertilizer i and Pollination level j in Year k and Replication l (l = 1…3).
These models are fitted for each insect type's transformed visitation rate. We transform the counts by adding 1 to all counts, then taking the natural logarithm.
The plant physiology parameters, which consisted of plant chlorophyll content index and stomatal conductivity variables, were analysed using linear Mixed Effects Models, as given in Eqn (4):

where F i denotes the intercept for Fertilizer i (i = 1…3); P j denotes the Pollination level (0 ≤ P j ≤ 1, j = 1…4) and β P its coefficient; D k denotes the intercept for Date/Year k (k = 1…2); FP ij denotes the Pollination level times an indicator of the Fertilizer and $\beta _i^{FP}$ the corresponding coefficients; FD ik denotes the intercepts for the interaction between Fertilizer and Year; ɛijklm ~ N(0, σ 2) denotes the unexplained random variation around the expected values produced by the factor levels; Y ijklm denotes the observed value obtained with Fertilizer i and Pollination level j at the WAP level m in Year k and Replication l (l = 1…3); W m denotes the random intercept for WAP level m (m = 1…3) such that W ~ N 3(0, ΣW) and ΣW is specified to allow for a single correlation parameter (ϕ) between successive levels of W – an AR(1) model. Note that no interaction terms between Pollination and Year can be implemented as only one pollination level was observed in Year 2, causing the intercept of Year 2 to take on the additional role of the dropped interaction terms.
The analysis of plant growth (plant height and leaf number) was done using Eqn (4)

where F i denotes the intercept for Fertilizer i (i = 1…3); D k denotes the intercept for Date/Year k (k = 1…2); FD ik denotes the intercepts for the interaction between Fertilizer and Year; ɛiklm ~ N(0, σ 2) denotes the unexplained random variation around the expected values produced by the factor levels; Y iklm denotes the observed value obtained with Fertilizer i at the WAP level m in Year k and Replication l (l = 1…3); W m denotes the random intercept for WAP level m (m = 1…5) such that W ~ N 5(0, ΣW) and ΣW is specified to allow for a single correlation parameter (ϕ) between successive levels of W – an AR(1) model. All statistical analyses were performed using R (R Core Team, 2021).
Results
Soil and environmental conditions
The soil pH values at both seasons were slightly acidic and were within the optimum pH levels for sunflower production in South Africa (BFAP, 2015). The soil density, extractable K+, total N were not differed at both seasons, while the 2018/19 season had higher organic carbon and K+ compared to soil from 2017/18. The Ca2+, Mg2+ and total cations were more in soil from 2017/18 compared to soil from 2018/19 season. During 2017/18 season, most rainfall was received in March, which decreased rapidly in April. The crop experienced drought during 2018/19 season (January), especially at the seedling stage, while an even distribution of rain occurred in February and March with prolonged rainfall into April. The maximum relative humidity in both seasons showed similar trends while the minimum relative humidity in 2018/19 was a bit higher compared to 2017/18. There was a little or no variations in mean evapotranspiration rates and air temperatures between both seasons, and temperatures were generally conducive for sunflower growth at all growth stages (Fig. 3).
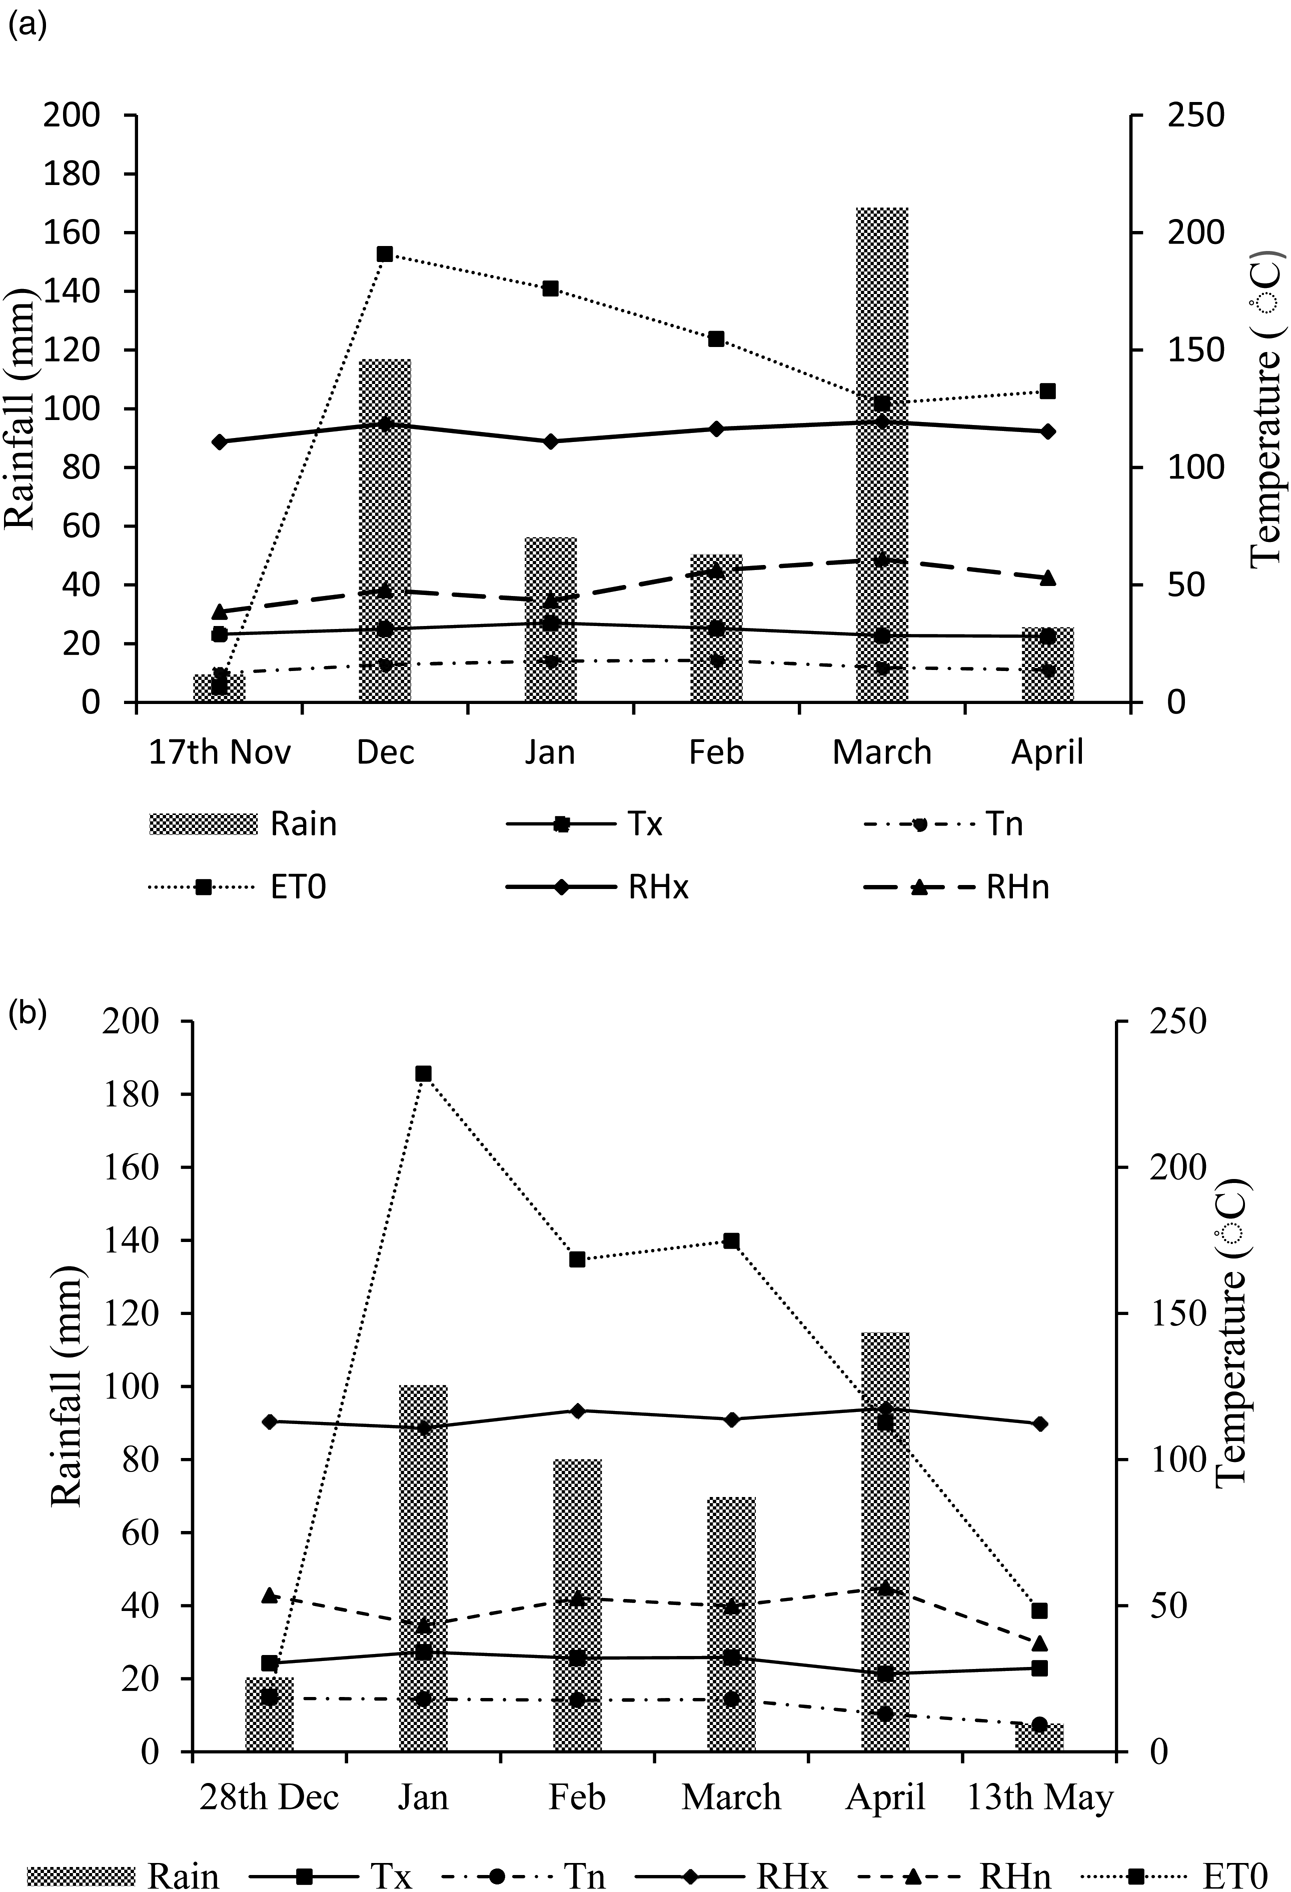
Fig. 3. Weather conditions during (a) 2017/18 and (b) 2018/19 planting seasons. Tx = maximum temperature, Tn = minimum temperature, ET0 = evapotranspiration, RHX = maximum relative humidity and RHn = minimum relative humidity.
Yield components
The discussions of results (both significance and effect sizes) and accompanying figures primarily reflect the year in which complete data were collected. Differences between the complete and incomplete data years are shown and generally found to be statistically insignificant. Still, the results should be seen as a reflection of a specific year with the properties described in the sections pertaining to environmental conditions.
Seed yield increased by both soil fertilization (F 2 = 260.1, P < 0.001) and pollination intensification (F 1 = 114.7, P < 0.001) and these two factors exhibited a strong positive synergy (fertilizer × pollination, F 2 = 12.0, P < 0.001; Table 2; Fig. 4(a)). Specifically, the intensification of insect pollination from minimum to maximum increased seed yield by approximately 0.4 ton/ha on nutrient poor soil and by approximately 1.7 ton per hectare in fertilized soil (Fig. 4(a)). Thousand seed weight was improved by both soil fertilization (F 2 = 118.5, P < 0.001) and pollination intensification (F 1 = 104.3, P < 0.001). Likewise, the two factors displayed a strong positive synergy (fertilizer×pollination, F 2 = 19.3, P < 0.001; Table 2; Fig. 4(b)). Explicitly, the intensification of insect pollination increased thousand seed weight by approximately 12 g on nutrient poor soil, 53 g on moderately fertilized soil, and approximately 93 g in fertilized soil (Fig. 4(b)).

Fig. 4. Colour online. The modelled impact of soil fertilization and insect pollination on (a) seed yield, (b) thousand seed weight, (c) fruit head weight and (d) fruit diameter for the 2018/19 cropping season. The sold lines indicate the expected values, and the dotted lines the 95% confidence intervals for the modelled expected values.
Table 2. Summary of the results for linear mixed effect model of pollination rates, soil fertility levels and their interactive effect on Yield components
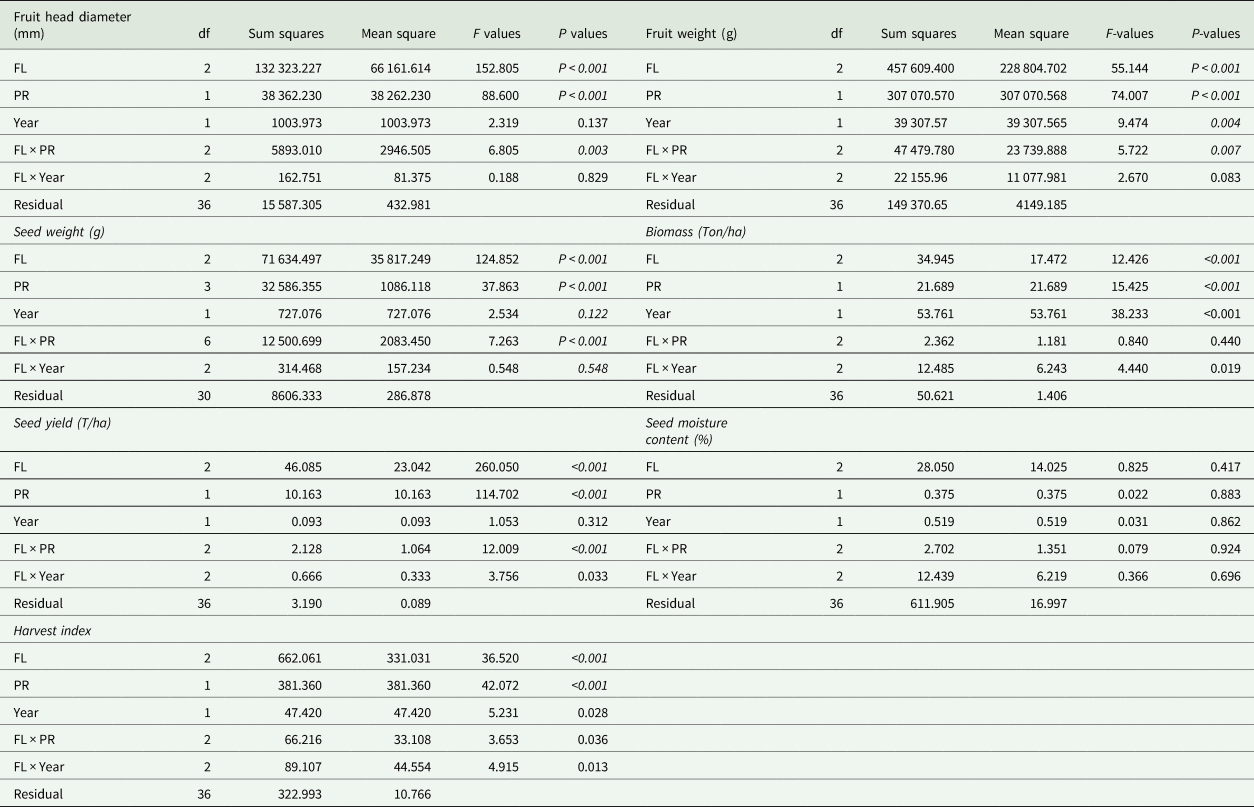
FL, soil fertility levels; PR, pollination rate.
Degrees of freedom (df) for each variable refer to the complexity of the additive curve. P-values in italics are statistically significant (P < 0.05).
Fruit weight was enhanced by both soil fertilization (F 2 = 55.1, P < 0.001) and pollination intensification (F 1 = 74.0, P < 0.001), also exhibited a strong positive synergy (fertilizer×pollination, F 2 = 5.7, P = 0.007). The intensification of insect pollination increased fruit weight by approximately 148 kg/ha on moderately fertilized soil and by approximately 260 kg/ha on optimal fertilized soil (Table 2; Fig. 4(c)). Fruit head diameter was improved by both soil fertilization (F 2 = 152.8, P < 0.001) and pollination intensification (F 1 = 88.6, P < 0.001) and these two factors exhibited a strong positive synergy (fertilizer×pollination, F 2 = 6.8, P = 0.003; Table 2; Fig. 4(d)). Specifically, the intensification of insect pollination increased fruit head diameter by approximately 29 mm per fruit on moderately fertilized soil and approximately 31 mm per fruit in optimally fertilized soil (Fig. 4(d)).
Harvest index increased by both soil fertilization (F 2 = 36.5, P < 0.001) and pollination intensification (F 1 = 42.1, P < 0.001), likewise the synergistic effect between the two factors (fertilizer×pollination, F 2 = 3.7, P = 0.036; Table 2; Fig. 5(a)). The seed moisture content showed no evidence of being influenced by pollination intensification (F 1 = 0.02, P = 0.883) and soil fertilization (F 2 = 0.8, P = 0.417). Similarly, the interaction of two factors exhibited no synergy (fertilizer×pollination, F 2 = 0.1, P = 0.924; Table 2; Fig. 5(b)). Total biomass increased by both soil fertilization (F 2 = 12.4, P < 0.001) and pollination intensification (F 1 = 15.4, P < 0.001). They exhibited no evidence of synergy (fertilizer×pollination, F 2 = 0.8, P = 0.440; Table 2; Fig. 5(c)).
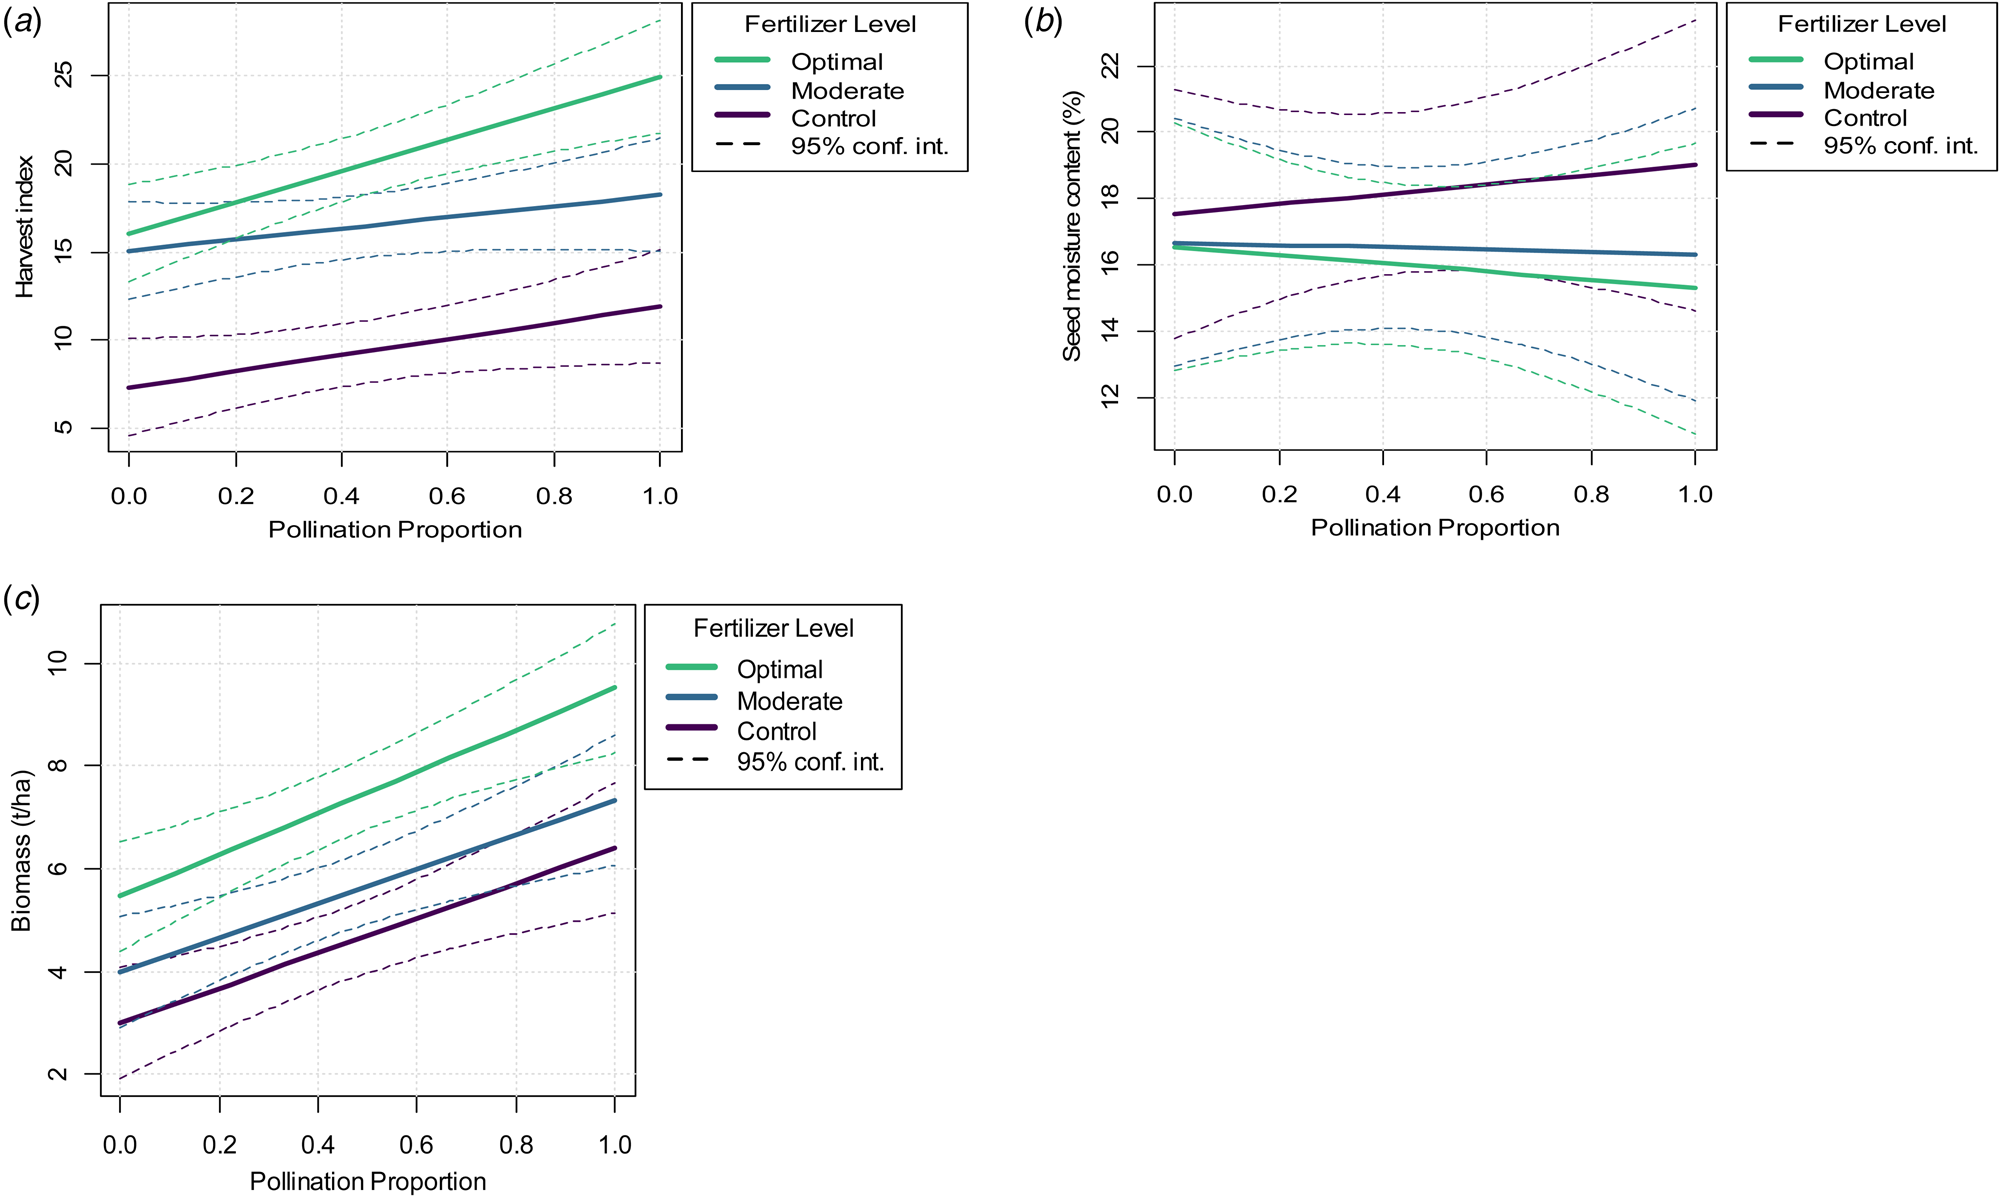
Fig. 5. Colour online. The modelled impact of soil fertilization and insect pollination on (a) harvest index, (b) seed moisture content, (c) total biomass for the 2018/19 cropping season. The sold lines indicate the expected values, and the dotted lines the 95% confidence intervals for the modelled expected values.
Plant physiological growth
As expected, plant growth responded positively to increased applications of fertilizer. The plant physiological growth indices validate the effect of soil fertilization on the physiological growth components. Thus, the explicit results were not reported but included in Table 3 and Fig. 6.

Fig. 6. Colour online. Physiological indices of sunflower (a = chlorophyll content index and b = stomatal conductance) under varying pollination rates and soil fertility levels; growth indices (c = plant height and d = leaf number) under varying soil fertility levels in WAP across the years. The sold lines indicate the expected values, and the dotted lines the 95% confidence intervals for the modelled expected values.
Table 3. Summary of the results for linear mixed effect model of pollination rates, soil fertility levels and their interactive effect on plant physiological growth

FL, soil fertility levels; PR, pollination rate; WAP, weeks after planting.
(df) = Degrees of freedom for each variable. P-values in italics are statistically significant (P < 0.05). All factors were treated as qualitative variables.
Insect visitation
Increase in soil fertilization (F 2 = 15.9, P < 0.001) and pollination intensification (F 1 = 73.6, P < 0.001; Table 4) increased the number of bees (Hymenoptera: Apinae) visitation per plant, but their interaction (F 2 = 1.0, P = 0.399) showed no effect on bee visitation. Specifically, moving from nutrient poor soil to a moderately fertilized soil multiplied the bee visitation by a factor of 1.71 (a 71% increase) and moving from nutrient poor soil to fertilized soil multiplied the bee visitation by a factor of 3.73 (a 273% increase) (Fig. 7(a)). These results are based on 26 residual degrees of freedom out of 35 valid observations.

Fig. 7. Colour online. The modelled impact of pollination services and soil fertilization on insect visitation, (a) bee visitation, (b) butterfly visitation, (c) beetle visitation, (d) grasshopper visitation on sunflowers during the 2018/19 cropping season. The sold lines indicate the expected values, and the dotted lines the 95% confidence intervals for the modelled expected values.
Table 4. Summary of the results for linear mixed effect model of pollination rates, soil fertility levels and their interactive effect on insect visitations

FL, soil fertility levels; PR, pollination rate; WAP, weeks after planting.
df1,2) = Degrees of freedom for each variable. P-values in italics are statistically significant (P < 0.05).
High pollination intensification (F 1 = 33.1, P < 0.001) increased the butterfly (Lepidoptera: Heliconiinae) visitation per plant. While the soil fertilization effect (F 2 = 2.1, P = 0.139) was not significant; their interaction (F 2 = 4.4, P = 0.005) exhibited positive synergy on the butterfly visitation rate (Fig. 7(b)). Beetle (Coleoptera: Coccinellinae) visitation per plant increased with soil fertilization (F 2 = 6.6, P = 0.005; Table 4) and pollination intensification (F 1 = 66.4, P < 0.001; Table 4). These factors did not exhibit a strong positive synergy (F 2 = 1.0, P = 0.369; Table 4). Precisely, pollination intensification multiplied beetle visitation per plant by a factor of 2.63 (a 163% increase) and moving from a nutrient poor soil to a fertilized soil multiplied the visitation by a factor of 1.82 (an 82% increase) (Fig. 7(c)). Grasshopper (Orthoptera: Acrididae) visitation per plant increased by pollination intensification (F 1 = 28.8, P < 0.001) but the soil fertilization (F 2 = 0.7, P = 0.476) and their interaction (F 2 = 0.6, P = 0.568) did not show significant influence on grasshopper visitation (Table 4; Fig. 7(d)).
Hoverfly (Dipera: Syrphidae) visitation per plant increased with pollination intensification (F 1 = 61.1, P < 0.001), but soil fertilization (F 2 = 1.0, P = 0.371; Table 4) did not show significant influence on its visitation. Similarly, the synergy between pollination and soil fertilization (F 2 = 1.0, P = 0.392; Table 4) did not show significant effect on hoverfly visitation (Fig. 8(a)). Ant (Dipera: Syrphidae) visitation per plant increased with pollination intensification (F 1 = 16.8, P < 0.001), but soil fertilization (F 2 = 1.4, P = 0.256; Table 4) and the synergy between pollination and soil fertilization (F 2 = 0.8, P = 0.472, Table 4) did not show significant influence on ant visitation (Fig. 8(b)).

Fig. 8. Colour online. The modelled impact of pollination services and soil fertilization on insect visitation for (a) hoverfly visitation and (b) ant visitation on sunflowers during the 2018/19 cropping season. The sold lines indicate the expected values, and the dotted lines the 95% confidence intervals for the modelled expected values.
Discussion
Our study confirmed that soil fertilization has a synergistic influence on crop pollination in sunflower seed production under rain fed conditions. The results of this study showed that soil fertilization and availability of sufficient pollinators provide a positive interaction that improved yield and yield parameters in sunflower. Application of soil nutrients may have affected the flowering, floral resources and consequently changed the flowers' attractiveness to the insect visitors (Ramos et al., Reference Ramos, Bustamante, da Silva and Carvalheiro2018). The well fertilized sunflower crop received more insect visitors compared with other fertilization levels, irrespective of the level of pollinator exclusion. Nevertheless, sunflower grown with a high intensity of pollination services under minimal soil fertilization still showed a substantial increase in yield in response to increasing pollination services. However, with no fertilizer applications the response to increasing pollination services was minimal.
The results confirmed that bees, hoverflies and butterflies from the orders Hymenoptera, Diptera and Lepidoptera are the most abundant pollinators of sunflower in a mountainous environment where the study was conducted. Optimal environmental conditions for insect pollinators were attained in both years, as sunflower bloomed in 8 days with temperatures fluctuating between 28.5 and 11.8°C. Environmental conditions and soil fertilization govern the quality of the pollen or nectar and increase the number insect visitations including those by leaf herbivory beetles and ants (Bartomeus et al., Reference Bartomeus, Potts, Steffan-Dewenter, Vaissière, Woyciechowski, Krewenka, Tscheulin, Roberts, Szentgyörgyi, Westphal and Bommarco2014; Wielgoss et al., Reference Wielgoss, Tscharntke, Rumede, Fiala, Seidel, Shahabuddin and Clough2014).
Beetles (Coleoptera), known as herbivory pests, may play an important role in crop pollination when it is at a lower economic threshold level. Other visiting insects such as grasshoppers (Orthoptera) and ants (Hymenoptera: Formicidae) enhance the species composition and diversity in the flowers, and help in the maintenance of pollination processes. Their presence at lower visitation rates might have a synergistic role towards improving seed yield.
The abundance and frequency of beetles and ants on plant flowers suggested that they could contribute to pollination services, but we found no synergistic benefits of pollination services and soil fertilization on ants' visitation. Information on pollination benefits of herbivory pests such as beetle, ant and grasshopper on sunflower development is very limited in the literature. Rostás et al. (Reference Rostás, Bollmann, Saville and Riedel2018) explained that ants are considered as nectar robbers that do not provide pollination service for calcareous grassland forb. More research is needed on the importance of these insects during sunflower pollination.
Optimal soil fertilization and high intensity pollination led to substantial increases in biomass growth and seed yield, as indicated by increased thousand seed weight, fruit weight and fruit diameter. The seed yield from optimal soil fertilization under high intensity pollination service (4 ton/ha) was greater than that obtained from unfertilized soil under low pollination (0.3 ton/ha). This could be attributed to adequate uptake of soil nutrients by the plant that influenced the flower qualities, leading to abundance of insect visitation. Nutrition provided to insect visitors by flowering plants, can enhance the number of the pollinators as well as their visitation rate. Cardoza et al. (Reference Cardoza, Harris and Grozinger2012) explained that enhancing the plant soil nutrients increased the visitation rates of insect pollinators to cucumbers flowers. Similarly, Sutter and Albrecht (Reference Sutter and Albrecht2016) indicated strong synergistic effects of insect pollination and pest control contributed 10% increased yield in oilseed rape yield, where their individual contributions were 6 and 7% respectively.
Interestingly, there was a substantial increase in seed yield (2.0 ton/ha) from minimal fertilized soil with high intensity pollination services, compared with those obtained from unfertilized soil under low pollination services (0.3 ton/ha). Tamburini et al. (Reference Tamburini, Lami and Marini2017) also reported that pollination resulted in an increase yield at the minimal fertilization level, where pollination benefits to yield were maximized at intermediate levels of nitrogen fertilizer boosting sunflower yield up to 25% compared with those from highly degraded ecosystem services. This shows that in widely different agro-ecological conditions, comparable complementary responses of crops to fertilizer and pollination were observed (Scheper et al., Reference Scheper, Holzschuh, Kuussaari, Potts, Rundlöf, Smith and Kleijn2013; Bartual et al., Reference Bartual, Bocci, Marini and Moonen2018).
On the other hand, Marini et al. (Reference Marini, Tamburini, Petrucco-Toffolo, Lindström, Zanetti, Mosca and Bommarco2015) reported an increase in pollination benefits at lower nitrogen inputs in oilseed rape, while at high nitrogen soil fertilization, plants compensated for the lack of pollinators by developing a larger number of flowers and fruits. In addition, Ramos et al. (Reference Ramos, Bustamante, da Silva and Carvalheiro2018) explained that pollinator's positive effect was more apparent under lower nitrogen input that alter plant's investment strategy. They further observed that improving ecosystem services may partly replace the need to use synthetic fertilizers in bean production in Brazil. Although, the crop species studied differed, in our study, optimal soil fertilization compensated for minimal pollination services, likewise at optimal pollination, the plant benefited from increased pollination services, resulting into larger number of fruit head, diameter and seeds weight. Thus, optimal fertilization enhanced maximum pollination benefits while minimal usage of nitrogen and phosphorus fertilizers amidst abundance insect pollinators still gave substantial high seed yield.
Sunflower crop thrives well under low input farming conditions (Adelabu et al., Reference Adelabu, Clark and Bredenhand2020). Bommarco et al. (Reference Bommarco, Kleijn and Potts2013) explained that abundance of insect pollination contributed to 18% yield increase and heavier seed weight in oilseed rape, but the diversity of the insect pollination and its synergetic with soil fertilization on the yield were not considered. This study revealed that increased pollination rates with poor soil fertilization only increased seed yield and other yield components slightly. Thus, the presence of pollinators on degraded soil with poor soil fertility had little yield benefit on sunflower crop.
This study manipulated plant exposure to insect visitation as an indicator of the insect fluctuations and abundance in a natural ecosystem and its effects on sunflower yield. We did not quantify the abundance of insect pollinators' populations in the locality, neither their relationship with other non-sunflower plants, which might have influenced the number of insects visiting at high pollination intensity (Boreux et al., Reference Boreux, Kushalappa, Vaast and Ghazoul2013). More studies under different environmental conditions using multiple experimental sites in multiple seasons are still required. This study found that broad suite of all insect visitations and their interactions contribute to crop pollination processes and help sunflower seed production.
Conclusion
Increasing sunflower productivity requires concise information on the soil fertility in the growing environment and it affects the visitation response of pollinators to the floral resources. The interaction of insect pollination and soil fertilization were found to have strong complementary impacts on sunflower seed yield. Optimal fertilization could compensate for moderate availability of insect pollinators, adequate and balanced soil fertilization reinforces pollination benefits, while efficient pollination services might fail to improve sunflower yield under low soil fertility conditions. Soil fertilization can significantly benefit plant pollinator relationship and boost sunflower productivity under dryland conditions.
Financial support
This research received no specific grant from any funding agency, commercial or not-for-profit sectors.
Conflict of interest
The authors declare no conflicts of interest exist.


 Open access