


Introduction
In Switzerland, geographic information system- (GIS-) based computer simulation programs have recently been developed for automated prediction of mountain permafrost distribution on a regional scale (Reference KellerKeller, 1992; Reference HoelzleHoelzle, 1996; Reference ImhofImhof, 1996), as well as for the whole of Switzerland (Reference KellerKeller and others, 1998). The program PERMAKART developed by F. Keller (see Reference KellerKeller, 1992) is based on the so-called ˚rules of thumb" (Reference HaeberliHaeberli, 1975) for predicting permafrost. These rules estimate the distribution of permafrost as a function of topo-climatic situations.
In the current study, PERMAKART was applied for a high-mountain environment in the eastern Swiss Alps. According to the simulation results, the selected site ― –a small cirque glacier and its glacier forefield-is located in a potential permafrost area. Under such conditions, surface ice is predominantly cold or polythermal. Perennially frozen ground in areas deglaciated since the last maximum glacier extent around AD 1850 may represent either formerly subglacial permafrost preserved or developed beneath cold surface ice, or permafrost that has formed since the disappearance of temperate surface ice. A glacier forefield at high altitudes is thus a somewhat special site concerning possible permafrost occurrence, as it is influenced by the thermal conditions of the former glacier. Modelling results which predict permafrost occurrence might be true for adjacent sites near and around the forefield, but not for the forefield itself.
The objective of the present work is to verify the results of the spatial GIS-based modelling through BTS (bottom temperature of the winter snow cover) measurements, geoelectrical soundings and geomorphological mapping in order to investigate the present-day permafrost and ground-ice distribution and to interpret glacier/permafrost relations in the investigated glacier forefield.
Site
The study area in the upper Engadine, eastern Swiss Alps, is situated in the vicinity of St Moritz in the Muragl valley. The regional climate can be described as continental, with fairly low precipitation and a comparatively high temperature amplitude. Only very small cirque glaciers, glacierets and perennial snow/ice patches exist today. Discontinous alpine permafrost occurs above 2400 ma.s.l. Periglacial morphodynamics clearly predominate over glacial morphodynamics, resulting in the formation of numerous rock glaciers. The permafrost within such rock glaciers has been intensively studied in the St Moritz area by core drilling through rock-glacier permafrost, (cf. Reference Haeberli, Huder, Keusen, Pika, Rothlisberger and SennesetHaeberli and others, 1988; Reference Vonder Muhll and HaeberliVonder Muhll and Haeberli, 1990; Reference Vonder Muhll and HolubVonder Muhll and Holub, 1992). The selected glacier forefield in the Muragl valley extends from 2880 to 2650ma.s.l. and is situated close to the active Muragl rock glacier (Fig. 1) which was investigated by Reference Vonder MuhllVonder Muhll (1993) and Reference KääbKääb (1998). In the upper parts of the cirque from 3080 to 2880 m a.s.L, a remnant of the former Muragl glacier today covers an area of about 0.06 km2. This small ice patch lost 50% of its area in the period 1973–88 (cf. Reference Kneisel, Haeberli and BaumhauerKneisel and others, 1997).

Fig. 1. GIS-based computer simulation of permafrost distribution in the upper Muragl valley.
Methods
To estimate the potential permafrost distribution, the computer program PERMAKART was used. The program runs under Arc/Info. Using a digital terrain model (DTM) as input data source, the program infers the potential permafrost distribution as a function of topography.
Three types of field investigations were performed to obtain evidence for potential permafrost occurrence: geomorphological mapping,"BTS mapping" and d.c. resistivity soundings.
The geomorphological mapping was done using a geomorphological legend for high-mountain geomorphology which was recently introduced by a German group of geomorphologists (cf Reference Kneisel, Lehmkuhl, Winkler, Tressel and SchroderKneisel and others, 1998).
The BTS method introduced by Reference HaeberliHaeberli (1973) allows investigation of the probable presence/absence of permafrost or buried ˚glacier ice" (cf. Reference Haeberli and EpifaniHaeberli and Epifani, 1986). If the winter snow cover is sufficiently thick (at least 80 cm), it insulates the soil from short-term variations in the surface-energy balance because of its very low heat-transfer capacity (cf. Reference GoodrichGoodrich, 1982; Reference Harris and CorteHarris and Corte, 1992; Reference Keller, Gubler and GuodongKeller and Gubler, 1993). In February and March, the BTS in the Alps remains nearly constant and is mainly controlled by the heat transfer from the upper ground layers, which in turn is strongly influenced by the presence or absence of permafrost (Reference Vonder Muhll and HaeberliVonder Muhll and Haeberli, 1990). Under permafrost conditions, a colder temperature occurs. The following three classes are distinguished: probable permafrost occurrence (BTS<-3°C), possible permafrost occurrence (BTS= –2° to –3°C) and improbable permafrost occurrence (BTS ≥ –2°C). For the cartographic presentation, Thiessen polygons were created around the measuring points to obtain a"spatial" impression of the inferred permafrost distribution (Fig. 2). In addition to spot measurements of the BTS, miniature temperature loggers were placed in the glacier forefield to record near-surface temperatures during winter.

Fig. 2. BTS measurements in the Muragl glacier forefield.
D.C. resistivity soundings have proved to be a reliable method for detecting ground ice/permafrost and have often been applied in mountain permafrost, especially on rock glaciers and (push) moraines (cf. Reference HaeberliHaeberli, 1975; Reference Fisch, Fisch and J rFisch and others, 1978; Reference KingKing, 1982; Reference King, Fisch, Haeberli and PWaechterKing and others, 1987; Reference Barsch and KingBarsch and King, 1989; Reference Vonder MuhllVonder Muhll, 1993; Reference Ødegård, Hoelzle, Johansen and SollidØdegard and others, 1996; Reference WagnerWagner, 1996; Reference Evin, Fabre and JohnsonEvin and others 1997; Reference Guglielmin, Biasini and SmiragliaGuglielmin and others, 1997). This method is suitable for detecting permafrost due to the marked resistivity contrast between unfrozen sediments and ground ice or ice-rich frozen sediments. Furthermore, d.c. resistivity soundings facilitate the characterization of different ice types because of the resistivity difference between congelation ice and sedimentary ice. Congelation ice (interstitial and segregation ice), which is the predominant form of ice in the ground, shows much lower resistivities than sedimentary ice which forms by a firnification process. Characteristic values for sedimentary ice from temperate Alpine glaciers are several MΩm to ≥ 100 MΩm, and for congelation ice 10 kΩm to a few MΩm (e.g. Reference Haeberli and Vonder MuhllHaeberli and Vonder Muhll, 1996).
The typical permafrost resistivity curve shows a three-layer model with an increase of resistivity at shallow depth representing the active layer and the permafrost underneath, followed by a sharp decrease of resistivities at greater current electrode distances (AB/2) representing the unfrozen ground beneath. Occasionally, however, the resistivity contrast between the active layer, the permafrost layer and the unfrozen underground can be low.
As many as 30 sites in the forefield were investigated by geoelectrical soundings using a GGA30–Bodenseewerk instrument. To improve the contact of the steel electrodes to the sometimes bouldery ground, sponges soaked in salt water were used. The data presented are based on symmetrical Schlumberger and asymmetrical Hummel configurations. From these data, models were calculated using the software RESIX-PLUS (Interpex). Figures 3 and 4 show the sounding graphs and the interpreted models (dashed lines). Crosses represent values which are not considered for the interpretation. Due to the geoelectrical principle of equivalence (e.g. Reference Mundry, Greinwald, Knödel, Losecke, Meiser, Reitmayr and BenderMundry and others, 1985) and lateral inhomogeneities, various calculated models can represent one sounding graph. The quantitative interpretation of the resistivity data concerning the thickness of the permafrost layer can therefore be uncertain, though a qualitative interpretation is usually possible. In the present interpretations, three-layer models were calculated which are believed to represent the most probable case with respect to the local geomorphological situation.
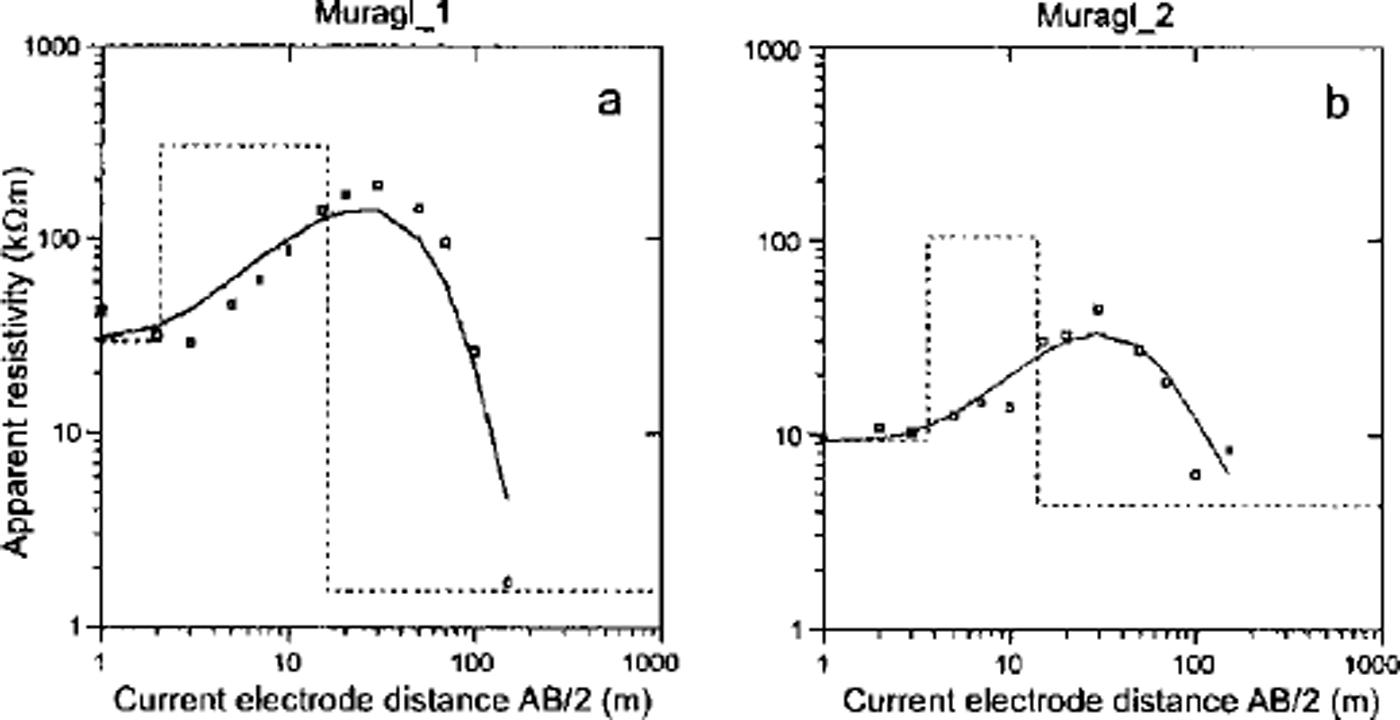
Fig. 3. D.c. resistivity profiles "Muragl_1" (a) and "Murag_2" (b)from the Muragl glacier forefield (locations in Fig 1).
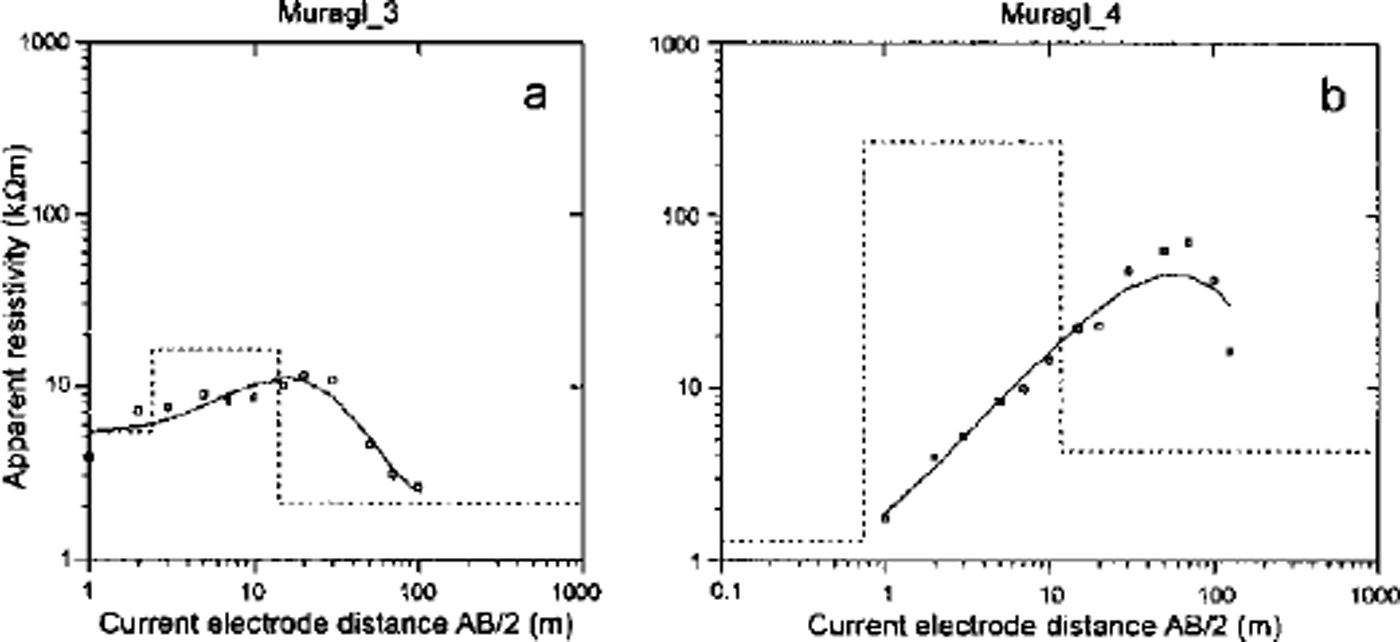
Fig. 4. D.c. resistivity profiles "Muragl_3" (a) and"Murag_4" (b)from the Muragl glacier forefield (locations in Fig 1).
Results
Modelling of the potential permafrost distribution
For the simulation of the potential permafrost distribution in the upper part of the Muragl valley, the DTM TOPOPT of Switzerland with a grid resolution (mesh width) of 100 m was used. The inferred permafrost distribution is shown in Figure 1. The Muragl rock glacier and the adjacent Muragl glacier forefield in its extent around AD 1850 lie almost entirely in the potential permafrost area. The modelling does not consider the former Muragl glacier and its thermal ˚history" which may influence the permafrost distribution as described above. Therefore BTS measurements were performed on 13–14 March 1998, in those parts of the forefield which were not threatened by avalanches, to verify the computer simulation and to compare with the BTS measurements conducted in 1985 in the central and lower parts of the AD 1850 glacier forefield (cf Reference HaeberliHaeberli, 1992).
BTS measurements
The results shown in Figure 2 suggest a more complex permafrost distribution pattern than inferred from the computer simulation. In the higher parts of the cirque between 2800 and 2900 ma.s.L, permafrost is present according to the BTS measurements. In the central parts of the forefield, permafrost is mapped as possible or improbable. In the outermost parts of the forefield close to the maximum glacier extent around AD 1850 a narrow band of probable permafrost occurs, on the orographic right side but also well into the forefield. The results of the BTS measurements coincide largely with those conducted in 1985 for the central and lower part of the glacier forefield.
Measured near-surface temperatures at five sites in the forefield are presented in Figure 5. The location of the loggers is shown in Figure 1. All loggers were obviously covered by a thick enough snow cover, as there are no high-frequency variations visible in the graph and the values decrease gradually until the final more-or-less constant high winter temperature is reached. The loggers ML3 and ML5 suggest that these sites are underlain by permafrost, as the graphs show the typical shape and BTS values (around and below –3°C) in March. The graphs of the loggers ML1, ML2 and ML4 do not point to permafrost conditions below.

Fig. 5. Temperature graphs from five miniature loggers in the Muragl glacier forefield (locations in Fig. 1).
D.C. resistivity soundings
The resistivity sounding profiles "Murag1_1"and "Muragl_2" (Fig. 3a and b) were measured at the margins of the 1850 extent of Muragl glacier (cf. Fig. 1) where the BTS measurements indicate a probable permafrost occurrence (cf. Fig. 2). Both profiles show increasing resistivity values at greater depth, which is typical for soundings in alpine permafrost. The resistivity values observed, 100–300 kΩm in the three-layer model, he in the range for perennial frozen ground and congelation ice and suggest a 10–20 m thick permafrost occurrence at both sites.
The profile "Muragl_3" (Fig. 4a) was carried out close to the mini-logger ML3 and the area of fluted moraines. The graph shows only a slight increase of the resistivity values. The three-layer model interpretation suggests a first layer of 2–3 m and a comparatively thin second layer of about 10 m with a resistivity of 15–20 kΩm. The profile "Muragl_4" (Fig 4b) was carried out in August 1997 in the upper parts of the cirque towards the steep scree slope on the orographic right side. Again the resistivity values increase with depth and are in the typical range of congelation ice. The first layer in the model interpretation is only about 1 m thick. The second layer is around 10 m thick with a resistivity of 200–300 kΩm.
Geomorphological mapping
The geomorphological mapping was carried out in August 1998, as recent geomormophodynamic processes such as small slides and debris flows had exposed ground ice in the steep upper slopes on both sides of the cirque (Fig 6). Debris-covered ground ice is also found in the niche on the orographic left side, with a small remnant of surface ice in the uppermost part. Glacial flutes have developed in the central part of the glacier forefield. A more striking geomorphological feature is the well-developed push moraine on the orographic right side at the margins of the 1850 extent of the glacier, indicating a glacier-permafrost interaction. Except in the area of the push moraine, the maximum extent around AD 1850 is somewhat problematic to infer from the morphology, as there are no terminal moraine ridges visible on the orographic left side, and there is permafrost creep with velocities around 0.5 m a"1 in the uppermost orographic left parts of the forefield close to the rock glacier (personal communication from A. Kääb, 1999).

Fig. 6. Geomorphological map of the Muragl glacierforefield.
To present a better overview, the sediment characteristics are not shown all over the forefield in Figure 6, but the predominant grain-size is shown. A coarse, blocky substratum is mainly found in the steep scree slopes and at the margins of the 1850 glacier extent. Finer grain-sizes are frequent in two sedimentation areas built up by two streams. The rest of the forefield shows more-or-less homogenous sediment distribution. Towards the margins and in some central parts of the glacier forefield, settlement features are found in places. In the upper parts of the cirque, partly debris-covered ˚glacier ice" (dead ice) is present close to the glacier remnant.
Discussion
The results of the field investigations show the presence of ground ice/permafrost and remnant glacier ice in the investigated glacier forefield. Concerning the origin of the ground ice/permafrost, it can be assumed that there is a coexistence of permafrost inherited from beneath cold surface ice and newly formed permafrost.
The former Muragl glacier can be assumed to have been polythermal, with a temperate accumulation (firn) area and a slightly cold ablation (ice) area (cf Reference HaeberliHaeberli, 1976; Reference Hooke, Gould and BrzozowskiHooke and others, 1983). The occurrence of fluted moraines and a push moraine provides geomorphological evidence for such a scheme of a probably polythermal former Muragl glacier with cold marginal parts frozen to the bed, and warm-based ice in more central parts where fluted moraines could develop (Reference SchyttSchytt, 1963; Reference Paul and EvansPaul and Evans, 1974; Reference BoultonBoulton, 1976). Tectonic disturbance by faulting and thrusting of perennially frozen sediments in front of the advancing Muragl glacier which was frozen to its bed at the margins led to the formation of the well-developed push moraine on the orographic right side (cf Reference HaeberliHaeberli, 1979,Reference Haeberli1983).
The geoelectrical soundings at the margins of the AD 1850 glacier extent ("Muragl_1" and "Muragl_2") point to an ice-rich permafrost layer. This permafrost is assumed to be a former subglacial occurrence which persisted from previous subglacial conditions beneath cold surface ice.
Interpretation of the profile "Murag1_1 suggests a 15 m thick permafrost layer beneath an active layer of 2–3 m. The model interpretation for "Muragl_2" in Figure 3b shows a comparatively thick active layer of 3–4 m and a thin second permafrost layer of only about 10 m. These results could be interpreted as a marginal and/or melting permafrost. The latter assumption of a melting permafrost is supported by the occurrence of small settlement structures (cf. geomorphological map in Fig. 6) which could point to thaw settlement.
The sounding "Muragl_3" close to the fluted ground-moraine surface could represent newly formed permafrost after the disappearance of the temperate surface ice in that area. Resistivity values for permafrost can vary over a wide range depending on the temperature, the ice content and the content of impurities (cf. Reference King, Fisch, Haeberli and PWaechterKing and others, 1987; Reference Haeberli and Vonder MuhllHaeberli and Vonder Muhll, 1996). Although it is known from nearby borehole measurements at the rock glacier Ursina that even highly supersaturated permafrost can show resistivity values of only 10–20 kΩm (Reference Haeberli and Vonder MuhllHaeberli and Vonder Muhll, 1996), the profile "Muragl_3" is interpreted as a permafrost occurrence which consists of a large amount of frozen material of different grain-size rather than a very ice-rich layer. Similar curves have been measured in other investigated glacier forefields (Reference KneiselKneisel, 1998). The interpretation of these profiles is made difficult by the fact that permafrost in Alpine glacier forefields is probably shallow, ˚warm" and thus rich in unfrozen water. However, a permafrost occurrence at that site is also supported by the temperature graph of ML3 which indicates a permafrost-typical BTS during the mid-winter months (cf. Fig. 5).
Recent geomorphodynamic processes in the steep upper slopes of the cirque include small debris flows and several slides related to the occurrence of ground ice. The geoelectrical sounding profile "Muragl_4" was performed lyear before active-layer slides occurred and exposed the ground ice. The resistivity sounding and BTS measurements at the nearby mini-logger confirmed the occurrence of permafrost.
The presence of permafrost at these sites impedes percolation of snowmelt and rain, leading to water saturation of the active layer, erosion and exposure of the ground ice. In places, the whole active layer is eroded and has accumulated further downslope.
The BTS measurements in the upper parts of the Muragl cirque were partly performed on buried remnant glacier ice ("dead ice"; see geomorphological map in Fig. 6). Several geoelectrical measurements in the uppermost areas on visible surface ice, debris-covered ground ice and the Muragl glacier remnant indicate that a variety of processes were involved in the formation of the ice. A polygenetic origin as suggested for the Muragl glacier remnant, as well as a nearby coexistence of sedimentary ice from a firnification process and congelation ice from refreezing of meltwater, can be assumed (Reference KneiselKneisel, 1998).
Remnants of surface ice or debris-covered ground ice in a permafrost environment such as a glacier forefield at high altitude cannot easily be recognized and defined as ˚glacier ice", and the sedimentary origin implied cannot be deduced on the basis of simple visual field inspections (cf. Reference Haeberli and Vonder MuhllHaeberli and Vonder Muhll, 1996). Geoelectrical investigations can contribute to a better understanding of the possible origin of ice in glacial and periglacial environments. In this context it is recommended that the genetic/petrographic classification of ice types (after Reference ShumskiiShumskii, 1964) should be used to differentiate between congelation ice and sedimentary ice to avoid misinterpretations of the term ˚glacier ice".
Conclusions
Verification of a permafrost distribution model applied to the forefield of the small, former polythermal Muragl glacier shows that:
-
(1) GIS-based spatial modelling provides general features of discontinuous permafrost occurrence which compare well with field measurements, and is thus realistic at spatial resolutions of about 100 m;
-
(2) extensive field evidence shows considerably more detail as well as local deviations from the model simulation;
-
(3) combined interpretation of results from a whole set of methodologies (modelling, geomorphological mapping, geophysical sounding, surface-temperature data logging) appears to be most suitable for building up a coherent image reflecting the complex situation;
-
(4) such complex situations in glacier forefields develop from the interaction of topoclimatic conditions, variations in surface materials, the evolution in time of atmospheric temperature and glacier shrinkage and the thermal conditions of the former glacier.
Details of the inferred glacier-permafrost relations are difficult to interpret. In most parts of the forefield the permafrost may be assumed to be a former subglacial occurrence which persisted from previous subglacial conditions beneath cold surface ice. However, new permafrost formation after the disappearence of insulating temperate surface ice cannot be excluded. Further studies involving long-term monitoring and the application of numerical glacier/permafrost models are recommended.
Acknowledgements
These research activities were financially supported by the Deutsche Forschungsgemeinschaft. Thanks are due to T. Riedlinger, S. Waiblinger, M. Waiblinger and N. Vogt for their assistance in the field.


