


Introduction
Cognitive decline is not exclusive of diseases such as Alzheimer’s disease or other dementias. Instead, normative cognitive aging represents those changes in cognition that are not due to disease, but associated to age (Steinerman et al., Reference Steinerman, Hall, Sliwinski and Lipton2010). Several studies acknowledge a decline of cognitive ability of the general population during late life (Harada et al., Reference Harada, Natelson Love and Triebel2013; Liampas et al., Reference Liampas2022; Yam et al., Reference Yam, Gross, Prindle and Marsiske2014). The study of age-related cognitive decline is important because it precedes disease-related decline (Murman, Reference Murman2015), and thus offers the opportunity for early intervention to delay the onset of disease.
Previous studies examining the growth trajectories of different cognitive domains have mostly reported either linear (Downer et al., Reference Downer, Chen, Raji and Markides2017; Johnson et al., Reference Johnson, Gross, Pa, McLaren, Park and Manly2012; Liampas et al., Reference Liampas2022; McFall et al., Reference McFall, McDermott and Dixon2019; Park et al., Reference Park, Kwon and Lee2017) or quadratic (Terrera et al., Reference Terrera, Brayne and Matthews2010; Yam et al., Reference Yam, Gross, Prindle and Marsiske2014) trajectories of decline. Some studies (Liampas et al., Reference Liampas2022; McFall et al., Reference McFall, McDermott and Dixon2019) could only test linear trajectories because of insufficient temporal measurements. Among the studies reporting a quadratic growth trajectory, Yam et al. (Reference Yam, Gross, Prindle and Marsiske2014) differentiated among everyday cognition, reasoning, speed, memory, and vocabulary, and found that all domains, except memory, exhibited positive linear slope and negative quadratic slope. In the case of memory, linear and quadratic slopes were negative.
From studies examining cognitive performance over time, female gender, younger age, higher educational attainment, better physical health, absence of depressive symptomatology, and more social engagement are among the most frequently reported factors related to less impaired cognitive trajectories (Chen and Chang, Reference Chen and Chang2016; Ding et al., Reference Ding, Charnigo, Schmitt, Kryscio and Abner2019; Downer et al., Reference Downer, Chen, Raji and Markides2017; Howrey et al., Reference Howrey, Raji, Masel and Peek2015; Liampas et al., Reference Liampas2022; McFall et al., Reference McFall, McDermott and Dixon2019; Min, Reference Min2018; Terrera et al., Reference Terrera, Brayne and Matthews2010; Wu et al., Reference Wu2021; Yu et al., Reference Yu2015). However, there is considerable heterogeneity in findings from different studies. For example, McFall et al. (Reference McFall, McDermott and Dixon2019) differentiated between young–old and old–old adults and found that the effects of variables differed, with better trajectories being associated with more social engagement in the former group and less depressive symptomatology in the latter. Moreover, most of these studies employed a measure of global cognition (Chen and Chang, Reference Chen and Chang2016; Cohen et al., Reference Cohen, Reisberg and Yaffee2022; Downer et al., Reference Downer, Chen, Raji and Markides2017; Howrey et al., Reference Howrey, Raji, Masel and Peek2015; Min, Reference Min2018; Terrera et al., Reference Terrera, Brayne and Matthews2010; Tu et al., Reference Tu2020; Yu et al., Reference Yu2015). Three studies (Ding et al., Reference Ding, Charnigo, Schmitt, Kryscio and Abner2019; Liampas et al., Reference Liampas2022; McFall et al., Reference McFall, McDermott and Dixon2019) examined episodic memory trajectories and one additional study (Wu et al., Reference Wu2021) contemplated four different cognitive domains.
In this study, we will focus on memory trajectories because impairment in this specific domain is considered an early manifestation of dementia (Ding et al., Reference Ding, Charnigo, Schmitt, Kryscio and Abner2019; Mowrey et al., Reference Mowrey2016; Wu et al., Reference Wu2021). According to Steinerman et al. (Reference Steinerman, Hall, Sliwinski and Lipton2010), using a measure of global cognition to characterize patterns of cognitive performance across the lifespan is not recommended, because it fails to capture subtle age-related changes. Additionally, different trajectories have been reported across cognitive domains (Teipel et al., Reference Teipel2018; Wu et al., Reference Wu2021). Some authors (Harada et al., Reference Harada, Natelson Love and Triebel2013; Lindenberger, Reference Lindenberger, Smelser and Baltes2001; Van Aken et al., Reference Van Aken, Kessels, Wingbermühle, Van Der Veld and Egger2015) claim cognitive domains that depend upon crystallized or pragmatic ability maintain into older age, and domains that are more dependent on situational cues, or mechanic ability, display age-related decline. Additionally, among those studies that contemplated more than one domain, differential effects of predictors were found. For example, in the study by Teipel et al. (Reference Teipel2018), younger age and higher educational attainment were associated to the more favorable trajectory of global cognition, but no association was found for memory trajectories. In turn, Liampas et al. (Reference Liampas2022) found women to outperform men in verbal episodic memory and underperform in nonverbal.
Previous research has approached cognitive trajectories from a person-centered perspective. Person-centered approaches operate under the assumption that there are clusters of individuals within a population sharing certain characteristics that can be grouped based on their observed responses (Wang and Wang, Reference Wang and Wang2012). Hence, person-centered techniques are exploratory in the sense that they try to capture subgroups of individuals and then depict them by comparing the groups in variables of interest. In contrast, variable-centered approaches describe relationships among variables. Although variable-centered approaches have been criticized for not acknowledging population heterogeneity (Laursen and Hoff, Reference Laursen and Hoff2006), some techniques such as linear mixed models or latent growth modeling (LGM) do allow for inter-individual variability in longitudinal research. Variable-centered approaches have been regarded as appropriate when studying the effects of one variable on another (Howard and Hoffman, Reference Howard and Hoffman2018). Within longitudinal research, variable-centered techniques are adequate for studying developmental trajectories if these are thought to be similarly experienced by the individuals (Laursen and Hoff, Reference Laursen and Hoff2006). In this study, we propose the analysis of memory trajectories from a variable-centered perspective. Using LGM, we allow for inter-individual variability at the initial memory level and at the rate of change, and then aim to explain this variability with the predictors that have been related to different trajectories.
Traditionally, studies examining cognitive decline have focused on older adult populations, given that cognitive ability is assumed to remain relatively stable during early and middle adulthood (Steinerman et al., Reference Steinerman, Hall, Sliwinski and Lipton2010). Across the literature examining longitudinal change in cognition, only one study was found that employed a nonolder adult sample (Elovainio et al., Reference Elovainio2018). This study examined trajectories of global cognitive performance of middle-aged adults (35–55 years old) over 21 years and found three different trajectories of cognitive decline, with different initial level (intercept) and different rate of decline (slope). Younger age, better physical health, and more social engagement were associated with a higher probability of displaying the less impaired trajectory of cognition. Building on recent evidence by Elovainio et al. (Reference Elovainio2018) about cognitive decline during adulthood, this study will consider the trajectory of memory for adults aged 50+.
All in all, the importance of this kind of research lays in the association of memory with dementia (Ding et al., Reference Ding, Charnigo, Schmitt, Kryscio and Abner2019; Mowrey et al., Reference Mowrey2016; Wu et al., Reference Wu2021). The evidence that examination of specific domains provides different conclusions about cognitive aging, and the potential implications that some factors could have for the intervention on these memory trajectories. The aim of this research is twofold: a) to establish the trajectories of verbal memory over a 10-year period, differentiating among recent and delayed recall; b) to test the role of age, gender, educational attainment, depression, social engagement, and physical inactivity as predictors of the initial memory level and the rate of change. Based on evidence from previous studies looking at growth trajectories, we hypothesize that the sample will present a decline in verbal memory. Additionally, according to previous evidence by Yam et al. (Reference Yam, Gross, Prindle and Marsiske2014), we expect this trajectory to be quadratic. After establishing the best-fitting growth trajectory, we will examine the role of the aforementioned covariates on the intercept and slope terms of memory. Drawing on previous literature, we further hypothesize that younger age, female gender, higher educational attainment, lower physical inactivity, lower depression, and higher social engagement to be associated to better memory, both recent and delayed.
Method
Sample and procedure
Data used in this study comes from the Survey of Health, Aging and Retirement in Europe (SHARE; Börsch-Supan et al., Reference Börsch-Supan2013; Börsch-Supan, Reference Börsch-Supan2021). This longitudinal panel survey employs a probabilistic sample strategy and is targeted at individuals aged 50 or more across several European countries and Israel. Details about the probabilistic sampling procedure can be found in Bethmann et al. (Reference Bethmann, Bergmann and Scherpenzeel2019). Since the beginning of the project in 2004, SHARE has collected eight waves of data. However, wave 3 of SHARE consisted of a retrospective study and hence did not include the usual measures (Schröder, Reference Schröder2011). Since wave 4, the same panel study, albeit with rotating in and out of certain variables and questionnaire modules, as well as the inclusion of additional countries, has taken place every 2 years.
For the present study, we considered waves 4, 5, 6, 7, and 8 of the SHARE study. We selected individuals that had participated in wave 4 of SHARE and that were aged 50 years or older at that moment. The resulting baseline sample was composed of 56,616 individuals, 44.0% of which were male and 56.0% were female. Age at wave 4 ranged between 50 and 103 years (M = 65.93, SD = 10.01). Regarding marital status, most respondents were married (66.8%) at the time of the wave 4 interview, followed by widowed (14.8%) and divorced (8.6%). In total, 16 European countries were represented in the study: Austria (8.8%), Germany (2.8%), Sweden (3.5%), Netherlands (4.9%), Spain (6.4%), Italy (6.2%), France (10.0%), Denmark (3.9%), Switzerland (6.5%), Belgium (9.1%), Czech Republic (9.5%), Poland (3.0%), Hungary (5.3%), Portugal (3.4%), Slovenia (4.8%), and Estonia (11.9%). Participation rates across the waves considered are available as Supplementary Material.
Instruments
Study variable
Verbal memory was measured using the Ten-Word Recall Test (Harris and Dowson, Reference Harris and Dowson1982). In the study, there were four lists of 10 words each. One of these lists was randomly assigned to each respondent and was read out at a certain point during the interview. Subsequently, there were two measurements of word recall: participants were asked to recall them immediately after (recent recall) they were read out and then again after they answered other cognitive tests (delayed or interfered recall). For both occasions, the number of correctly recalled words is recorded; hence, the response scale could range between 0 and 10.
Covariates
The covariates considered in this study were age, gender, educational attainment, physical inactivity, social engagement, and depression. Educational attainment was operationalized using the International Standard Classification of Education coding for educational levels, in its 1997 version (Schneider, Reference Schneider2008). Physical inactivity was recorded as a binary variable indicating whether the individual engaged in moderate physical activity less than weekly. Social engagement recorded the number of social network contacts with which the participant had weekly or more frequent interactions, ranging from 0 to 7. Finally, depression was measured using the EURO-D scale (Prince et al., Reference Prince1999). This scale records the number of depressive symptoms from a list of 12 items, including: depressed mood, pessimism, suicidality, guilt, sleep, lack of interest, irritability, loss of appetite, fatigue, lack of concentration, lack of enjoyment, and tearfulness. Hence, responses could vary between 0 and 12. All of these covariates were measured at the first time point of the study, SHARE wave 4.
Statistical analyses
First, descriptive statistics of the variables involved in the study were calculated to get a general overview of the data. Then, we considered recent and delayed verbal memory separately and used LGM to model the change over time in memory scores within the sample. We tested linear and quadratic growth trajectories. When quadratic terms were included, time scores were centered at mean time to deal with collinearity issues. Latent growth models assume that individuals are drawn from a single population but acknowledge population heterogeneity by modeling the variance of the intercept and slope (Wang and Wang, Reference Wang and Wang2012). Once the best growth trajectory was retained, we added the aforementioned covariates to the retained latent growth model in each case. All models were estimated using robust maximum likelihood.
In all cases, model fit was assessed using different indices and statistics recommended in the literature (Kline, Reference Kline2015). Concretely, chi-square statistic (χ2), comparative fit index (CFI), root mean squared error of approximation (RMSEA), and standardized root mean square residual (SRMR) were used. Models presenting a CFI over 0.95 and RMSEA and SRMR under 0.05 are regarded as presenting optimal fit to the data (Hu and Bentler, Reference Hu and Bentler1999; Marsh et al., Reference Marsh, Hau and Wen2004). In order to compare relative fit of the models, we also employed Akaike’s Information Criterion (AIC) and Bayesian Information Criterion (BIC). Lower values of BIC and AIC indicate better fit. Missing data due to dropout across study waves was treated as not missing at random, specifically using pattern-mixture modeling (Little and Rubin, Reference Little and Rubin2020; Little, Reference Little1995). This technique creates subgroups of individuals that share the same missing data pattern and estimates the LGM within each subgroup; then, the weighted average of the pattern-specific estimates is computed to obtain the sample’s growth trajectory (Enders, Reference Enders2011). Descriptive analyses were done using SPSS 26 and LGMs were computed in Mplus 8.7 (Muthén and Muthén, (Reference Muthén and Muthén1998-2017).
Results
Descriptive statistics
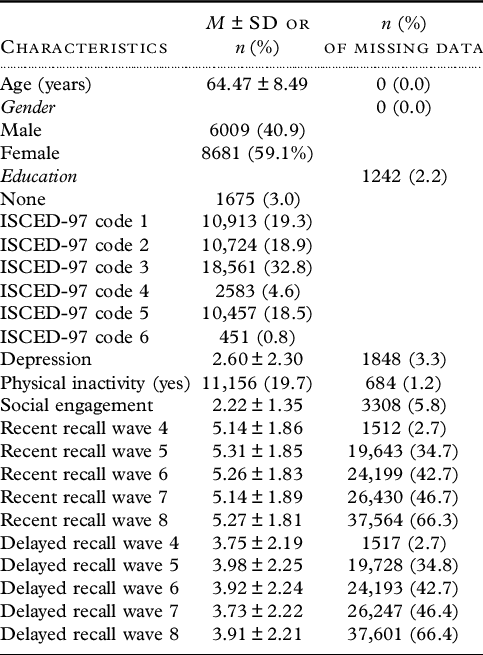
Descriptive data and information about missing data of the variables involved in the study are shown in Table 1 for the general sample. In general, there is a slightly higher proportion of females. Higher mean scores in recent memory compared to delayed memory are observed at every time point.
Table 1. Descriptive statistics of the variables involved in the study
Recent memory
Latent growth trajectory
In order to study recent verbal memory in the general sample, we tested both linear and quadratic trajectories of change. 820 cases were excluded from the analyses because they had no data available in any of the dependent variables. Both models fitted the data adequately. Results from the linear model were: χ2 (23) = 1192.02, p < 0.05, CFI = 0.983, RMSEA = 0.030 [0.029–0.032], SRMR = 0.092, AIC = 652490.80, BIC = 652642.60. When a quadratic term was included, model results were: χ2 (17) = 601.57, p < 0.05, CFI = 0.992, RMSEA = 0.025 [0.023–0.027], SRMR = 0.093, AIC = 652043.46, BIC = 652248.83. Given that both BIC and AIC were lower in the quadratic model, and CFI and RMSEA displayed a slightly better fit, we retained this model.
The quadratic model presents a mean intercept of m = 5.54 (p < 0.05) with a variance of s 2 = 2.07 (p < 0.05), hence indicating inter-individual variability at the average level of recent memory. Regarding the slopes, the mean of the linear slope had a value of m = −0.076 (p < .05) with variance s 2 = 0.056 (p < 0.05), and the estimated mean of the quadratic slope was m = −0.032 (p < .05) with variance s 2 = 0.011 (p < 0.05). Therefore, the general sample displayed a quadratic decline in memory trajectory (inverted u-shape), which entails that decline in recent memory becomes more acute with time. Statistical significance of the variances of the slopes manifests that there is inter-individual variability in the rate of decline. There was a positive and statistically significant covariance of the intercept and the linear slope (sxy = 0.097, p < 0.05), indicating that those individuals with higher intercepts also presented the steeper linear decline. The covariance of the quadratic slope with the intercept was negative and statistically significant (sxy = −0.028, p < 0.05), indicating that individuals with higher intercepts presented less acute quadratic decline. Moreover, the covariance between the quadratic slope and the linear slope is statistically significant (sxy = −0.006, p < 0.05) too, and therefore individuals with steeper linear decline will also present less acute quadratic decline.
Recent memory trajectory with covariates
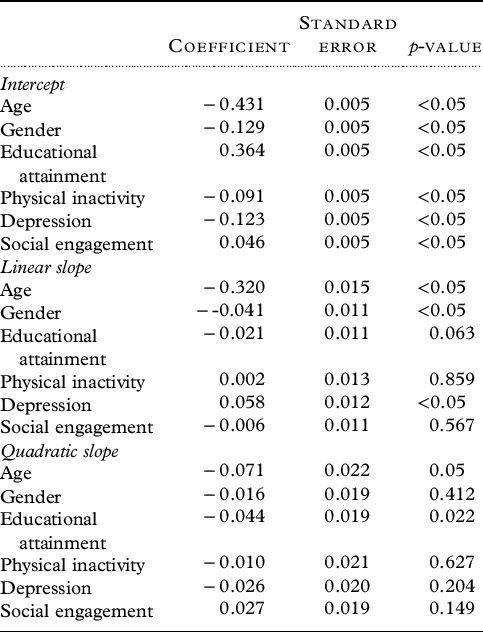
Introducing the covariates to the quadratic latent growth model yielded the following model fit results: χ2 (29) = 360.18, p = 0.05, CFI = 0.996, RMSEA = 0.015 [0.014–0.016], SRMR = 0.066, AIC = 569541.36, BIC = 569903.60. Table 2 offers the standardized effects of the covariates. All covariates showed a statistically significant effect on the intercept in the expected direction, while only age, gender, and educational attainment significantly affected the linear term. Finally, age, educational attainment, and physical inactivity displayed a statistically significant effect on the quadratic slope.
Table 2. Standardized effects of the covariates on recent memory latent trajectory
Regarding correlations among latent variables, there was a positive correlation between the intercept and linear slope (r = 0.247, p < 0.05), which indicates that individuals with a higher average level of recent memory also experience the largest linear decline, and a negative correlation between the intercept and the quadratic slope (r = −0.279, p < .05), which entails that these individuals experience the least quadratic decline. The correlation between the linear and the quadratic slopes was also statistically significant and negative (r = −0.226, p < .05), indicating that individuals with steeper linear decline display less acute quadratic decline. The model was able to explain 53% of the variance of the intercept, 21% of the linear slope, and 13.5% of the quadratic slope. Figure 1 displays the estimated recent memory trajectory for the whole sample (a) and estimated recent memory trajectories for 50 random participants (b).

Figure 1. Estimated recent memory trajectory for the general sample (a) and estimated recent memory trajectories of 50 random individuals (b), after controlling for the effects of covariates.
Delayed memory
Latent growth trajectory
Linear and quadratic latent growth models were tested to study the trajectory of delayed verbal memory in the general sample. 833 cases were excluded from the analyses because they had no data available in any of the dependent variables. A linear latent growth model fitted the data adequately: χ2 (23) = 1677.73, p < 0.05, CFI = 0.980, RMSEA = 0.036 [0.034 - 0.037], SRMR = 0.070, AIC = 708979.49, BIC = 709131.29. Nevertheless, model fit improved when adding the quadratic term: χ2 (17) = 824.12, p < 0.05, CFI = 0.990, RMSEA = 0.029 [0.027 - 0.031], SRMR = 0.077, AIC = 708352.56, BIC = 708557.94. Therefore, we retained the quadratic model, as it presented lower BIC and AIC, and CFI and RMSEA displayed better fit.
Estimated mean intercept of the quadratic model was m = 4.25 (p < 0.05) and its estimated variance was s 2 = 3.01 (p < 0.05), which indicated inter-individual variability at the average level of delayed memory. The estimated mean of the linear slope was m = -0.088 (p < .05) with variance s 2 = 0.075 (p < 0.05), and the estimated mean of the quadratic slope had a value of m = −0.047 (p < 0.05) with variance s 2 = 0.014 (p < 0.05). Therefore, there was a quadratic decline in memory trajectory (inverted u-shape), which entails that decline in delayed memory also becomes more acute with time, very much like we saw earlier for recent memory. Inter-individual variability in the rate of decline was captured in the statistically significant variances of both slope terms. The covariance of the intercept and the linear slope was statistically significant and positive (sxy = 0.114, p < 0.05). The covariance between the intercept and the quadratic slope was also statistically significant but negative (sxy = −0.062, p < 0.05), which indicates that individuals with higher intercepts present less acute quadratic decline. The covariance of the quadratic slope and the linear slope was statistically significant and negative, sxy = −0.047, p < 0.05, also signaling that steeper linear decline is associated with slower quadratic decline and vice versa.
Delayed memory trajectory with covariates
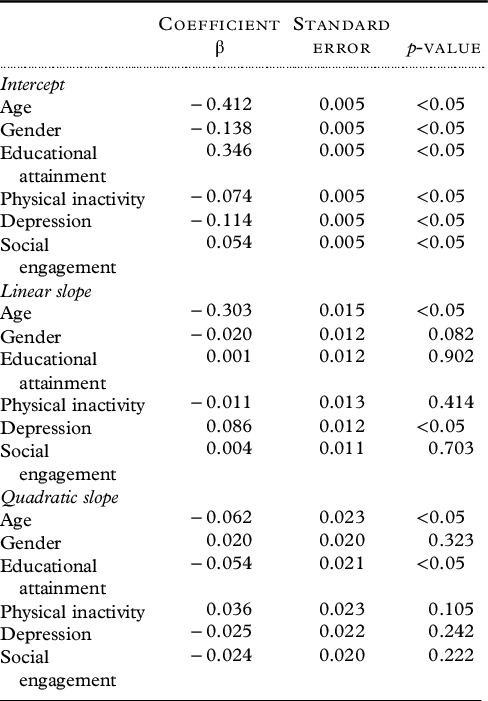
Model fit results introducing the covariates to the quadratic latent growth model of delayed memory were very good: χ2 (29) = 551.33, p < 0.05, CFI = 0.994, RMSEA = 0.019 [0.017 - 0.020], SRMR = 0.056, AIC = 626799.21, BIC = 627161.45. All the introduced covariates presented a statistically significant effect on the intercept, in the expected direction according to the literature. These effects are shown in Table 3. Furthermore, age negatively affected both linear and quadratic slopes, and there was a significant positive effect of depression on the linear slope.
Table 3. Standardized effects of the covariates on delayed memory latent trajectory
There was a positive correlation between the latent intercept and latent linear slope (r = 0.227, p < 0.05). Therefore, people with higher intercepts of delayed memory experience more linear decline. There was also a negative correlation between the intercept and the quadratic slope (r = −0.369, p < 0.05), which entails that these individuals experience less quadratic decline. The correlation between the linear and the quadratic slopes was also statistically significant and negative (r = −0.273, p < 0.05), indicating an inverse association between linear and quadratic decline in delayed memory. The model was able to explain 47.6% of the variance of the intercept, 16.3% of the linear slope, and 10.1% of the quadratic slope. Figure 2 displays the estimated delayed memory trajectory for the whole sample (a) and estimated delayed memory trajectories for 50 random participants (b).

Figure 2. Estimated delayed memory trajectory for the general sample (a) and estimated delayed memory trajectories of 50 random individuals (b), after controlling for the effects of covariates.
Discussion
This study explored the latent trajectories of recent and delayed memory using a variable-centered approach. Once trajectories for recent and delayed memory were established, we tested the effects of age, gender, educational attainment, depression, social engagement, and physical inactivity in explaining such trajectories. Results showed that recent and delayed memory display negative quadratic latent trajectories, signaling a decline in both domains of memory that becomes steeper with time. However, we found differences in the initial level, the rate of change, and the effects of covariates between recent and delayed memory. These differences are discussed next.
Among the studies examining memory change across time, some only included delayed recall (Ding et al., Reference Ding, Charnigo, Schmitt, Kryscio and Abner2019; Wu et al., Reference Wu2021), some others used a composite measure of several memory domains (Liampas et al., Reference Liampas2022; McFall et al., Reference McFall, McDermott and Dixon2019), and only one (McCarrey et al., Reference McCarrey, An, Kitner-Triolo, Ferrucci and Resnick2016) differentiated between recent and delayed memory change in the analyses. The study by McCarrey et al. (Reference McCarrey, An, Kitner-Triolo, Ferrucci and Resnick2016) used mixed linear models to study the effect of time, age, gender, and their interactions on several cognitive measures, including immediate and delayed recall. Their results showed different effects of predictors in recent and delayed memory. The present study expands these results by including the effects of additional frequently reported predictors of cognition.
For recent memory, higher age, more depression, being male, and physical inactivity predicted a lower initial level, while more social engagement and higher educational attainment had a positive effect. Among these effects, the most notorious ones were that of age and educational attainment, while being male and depression had a moderate effect, and physical inactivity and social engagement influenced the initial level of recent memory to a lesser degree. Regarding the linear slope of recent memory, higher age had a substantial negative effect on linear decline in recent memory. Male gender also had a negative impact on the linear slope, but this effect was considerably lower. In turn, the initial level of depression had a small but positive effect. Finally, in case of the quadratic slope, being older and having higher educational level were predictors of worse quadratic decline, effects being relatively low. All effects were in the expected direction according to previous research (Ding et al., Reference Ding, Charnigo, Schmitt, Kryscio and Abner2019; Liampas et al., Reference Liampas2022; McFall et al., Reference McFall, McDermott and Dixon2019; Wu et al., Reference Wu2021), except the positive effect of depression on the linear slope term and negative effect of education on the quadratic slope term.
On the one hand, previous studies analyzed the effect of initial levels of depression on the probability of belonging to different classes of cognitive trajectories. Results consistently reported depression to be associated to a higher probability of belonging to the most deteriorated cognitive trajectory (Chen and Chang, Reference Chen and Chang2016; Downer et al., Reference Downer, Chen, Raji and Markides2017; Howrey et al., Reference Howrey, Raji, Masel and Peek2015; Min, Reference Min2018; Yu et al., Reference Yu2015; Zahodne et al., Reference Zahodne, Schupf, Brickman, Mayeux, Wall, Stern and Manly2016). Nevertheless, the reported effect could be only capturing differences in the intercept of the trajectories. Results from this study show that there is a considerable negative effect of depression on the recent memory intercept, and a much smaller but positive effect on the linear negative slope of recent memory. Therefore, it could be that individuals with higher levels of depression at baseline were already presenting lower initial levels of recent memory and they declined less than less depressed individuals.
On the other hand, Williams et al. (Reference Williams, Pendleton and Chandola2021) conducted a study to examine whether the effect of education could differ depending on the severity of decline. According to neural compensation reserve theory (Barulli and Stern, Reference Barulli and Stern2013), Williams et al. (Reference Williams, Pendleton and Chandola2021) claimed that initial decline would be slowed, followed by accelerated posterior decline as education would no longer be able to compensate for age-related cognitive loss. They used growth mixture models to examine the effect of education on different patterns of cognitive trajectories and did not find evidence of the protective role of educational attainment on rapid decline. This could, however, be due to the fact that educational attainment protects against initial (linear) decline but, as the reserve is drained off, rapid decline occurs and hence posterior (quadratic) decline becomes steeper, as the results of the present study suggest.
For delayed memory, higher age, more depression, being male, and physical inactivity were predictors of a lower initial level, while more social engagement and higher educational attainment predicted better initial delayed recall. Similar to recent memory, the most notorious effects were those of age and educational attainment, followed by male gender and depression. The smallest effects were those of physical inactivity and social engagement. Older age further predicted more decline in linear and quadratic terms of change in delayed recall, although the effect on the linear slope was considerably bigger than that on the quadratic slope. Apart from age, only the initial level of depression had a small but statistically significant and positive effect on the linear slope of delayed recall. This effect was unexpected, as it indicated that higher initial levels of depression predicted less linear decline. As argued before, one possibility is that, as depression also has a negative effect on the initial level of delayed memory, individuals with higher levels also present lower levels of initial delayed memory and hence do not decline that much at the beginning. Finally, educational attainment presented a negative effect on the quadratic slope term. This effect was small. Again, it could be the cognitive reserve is consumed along time, and then rapid decline occurs.
All in all, covariates explained a substantive amount of variance of the intercept of both types of memory, 45.0% for recent and 38.1% of delayed, but were less successful in explaining linear and quadratic slope terms of both types of memory. Previous evidence had repeatedly shown effects of these variables in different types of memory (Ding et al., Reference Ding, Charnigo, Schmitt, Kryscio and Abner2019; Liampas et al., Reference Liampas2022; McFall et al., Reference McFall, McDermott and Dixon2019; Wu et al., Reference Wu2021) as well as on other cognitive trajectories (Chen and Chang, Reference Chen and Chang2016; Cohen et al., Reference Cohen, Reisberg and Yaffee2022; Downer et al., Reference Downer, Chen, Raji and Markides2017; Howrey et al., Reference Howrey, Raji, Masel and Peek2015; Min, Reference Min2018; Terrera et al., Reference Terrera, Brayne and Matthews2010; Tu et al., Reference Tu2020; Wu et al., Reference Wu2021; Yu et al., Reference Yu2015). However, all these studies employed a person-centered approach, and one possible explanation for the inconsistency of results is that previously reported differences in these variables across trajectories were only reflecting differences in the initial level of the trajectory and not in the rate of change. Therefore, this study expands previous literature by using an alternative approach that shows that depression, physical activity, and social engagement are correlated with memory at present time but affect future memory trajectories to a lesser degree.
The present study has strengths and limitations. Among the strengths, the use of a probabilistic approach for drawing the sample of adults and older adults has provided evidence, in line with Elovainio et al. (Reference Elovainio2018), that memory decline is not exclusive of old age. Additionally, results show that variables such as gender and educational attainment predict future memory even when controlling for age, especially in the case of immediate recall. These results have implications for intervention development, as these have traditionally been targeted at older adults. It seems that interventions aimed at preventing cognitive impairment could start much sooner, as middle adulthood is a period in which decline is already evident. Finally, this study also supports the neural compensation reserve theory, by which there is sudden cognitive decline after depletion of cognitive reserve. This study is also subject to limitations, as the data used comes from a panel study, in which time and resource constraints usually limit the refinement of the measures. Moreover, although missing data was treated as following a not missing at radom mechanism, it is still possible that our results are influenced by panel attrition and data imputation.
Conflict of interest
The authors declare no conflict of interest.
Description of author’s roles
I. Fernández, A. Bethmann and J. M. Tomás designed the study, I. Fernández and J. M. Tomás analyzed the data, I. Fernández wrote the paper, and A. Bethmann and J. M. Tomás assisted with writing the article.
Acknowledgements
Irene Fernández is the recipient of grant PRE2019-089021 funded by MCIN/AEI/ 10.13039/501100011033 and by “ESF Investing in your future”. This research is supported by project PID2021-124418OB-I00 funded by MCIN/AEI/10.13039/501100011033 and by “ERDF A way of making Europe”. The SHARE data collection has been funded by the European Commission, DG RTD through FP5 (QLK6-CT-2001-00360), FP6 (SHARE-I3: RII-CT-2006-062193, COMPARE: CIT5-CT-2005-028857, SHARELIFE: CIT4-CT-2006-028812), FP7 (SHARE-PREP: GA N°211909, SHARE-LEAP: GA N°227822, SHARE M4: GA N°261982, DASISH: GA N°283646) and Horizon 2020 (SHARE-DEV3: GA N°676536, SHARE-COHESION: GA N°870628, SERISS: GA N°654221, SSHOC: GA N°823782, SHARE-COVID19: GA N°101015924) and by DG Employment, Social Affairs & Inclusion through VS 2015/0195, VS 2016/0135, VS 2018/0285, VS 2019/0332, and VS 2020/0313. Additional funding from the German Ministry of Education and Research, the Max Planck Society for the Advancement of Science, the U.S. National Institute on Aging (U01_AG09740-13S2, P01_AG005842, P01_AG08291, P30_AG12815, R21_AG025169, Y1-AG-4553-01, IAG_BSR06-11, OGHA_04-064, HHSN271201300071C, RAG052527A) and from various national funding sources is gratefully acknowledged (see www.share-project.org).
Supplementary material
To view supplementary material for this article, please visit https://doi.org/10.1017/S1041610222001016


 Open access