


Background
Being a member of an ethnic minority group is one of the most well established environmental risk factors for schizophrenia (Cantor-graae et al. Reference Cantor-graae and Selten2005; Bourque et al. Reference Bourque, van der Ven and Malla2011). Early research focused on the risk associated with migration (Ødegaard, Reference Ødegaard1932). It has subsequently become clear that this increased risk is not secondary to selective migration (Selten et al. Reference Selten, Cantor-Graae, Slaets and Kahn2002; van der Ven et al. Reference van der Ven, Dalman, Wicks, Allebeck, Magnusson and van Os2015), and the effect persists among second-generation migrants, indicating that the risk is associated with being a member of a minority group, rather than the act of migration itself (Hutchinson et al. Reference Hutchinson, Takei, Fahy, Bhugra, Gilvarry and Moran1996; Bresnahan et al. Reference Bresnahan, Begg, Brown, Schaefer, Sohler and Insel2007; Bourque et al. Reference Bourque, van der Ven and Malla2011). In various settings, the increased risk appears greatest for individuals of black ethnicity (Cantor-graae et al. Reference Cantor-graae and Selten2005; Bresnahan et al. Reference Bresnahan, Begg, Brown, Schaefer, Sohler and Insel2007). In the UK, individuals of black ethnicity were found to have incidence rate ratios compared with the white British population of between six and nine (Fearon et al. Reference Fearon, Kirkbride, Morgan, Dazzan, Morgan and Lloyd2006). This risk also appears to be somewhat specific for psychosis. Although there is some evidence that affective disorders may have slightly increased incidence rates in first-generation immigrants, this appears to be driven by manic presentations, and there is no evidence of increased rates of depression or anxiety in the UK black ethnicity population (Shaw et al. Reference Shaw, Creed, Tomenson, Riste and Cruickshank1999; Brugha et al. Reference Brugha, Jenkins, Bebbington, Meltzer, Lewis and Farrell2004; Weich et al. Reference Weich, Nazroo, Sproston, McManus, Blanchard and Erens2004; Swinnen & Selten, Reference Swinnen and Selten2007; Mindlis & Boffetta, Reference Mindlis and Boffetta2017). Similarly, in the USA a number of studies have reported reduced rates of depression and anxiety in African Americans (Kessler et al. Reference Kessler, Berglund, Demler, Jin, Koretz and Merikangas2003; Riolo et al. Reference Riolo, Nguyen, Greden and King2005; Breslau et al. Reference Breslau, Aguilar-Gaxiola, Kendler, Su, Williams and Kessler2006; Himle et al. Reference Himle, Baser, Joseph, Denise and Jackson2009; Asnaani et al. Reference Asnaani, Richey, Dimaite, Hinton and Hofmann2010; Gibbs et al. Reference Gibbs, Okuda, Oquendo, Lawson, Wang and Thomas2013).
Interestingly, despite the fact that communities with high proportions of ethnic minority individuals are frequently the most deprived, living in an area where one's own ethnic group forms a larger proportion of the population is relatively protective against schizophrenia (Shaw et al. Reference Shaw, Atkin, Becares, Albor, Stafford and Kiernan2012; Kirkbride et al. Reference Kirkbride, Jones, Ullrich and Coid2014). One hypothesis is that higher own group ethnic density buffers the individual from the adverse psychiatric consequences of social isolation and racist experiences (Bécares et al. Reference Bécares, Nazroo and Stafford2009). Epidemiological work has also suggested that greater levels of segregation between members of ethnic minority groups and the rest of the community may be linked to a greater incidence of psychotic disorders (Kirkbride et al. Reference Kirkbride, Jones, Ullrich and Coid2014).
Cognitive models propose that minority status is associated with greater levels of social threat (Combs et al. Reference Combs, Penn and Fenigstein2002; Morgan et al. Reference Morgan, Charalambides, Hutchinson and Murray2010). However, the neurobiological mechanisms underlying both the increased risk of psychosis in ethnic minority groups, and the protective effects of increased own group ethnic density, are not known. One previous fMRI study investigated the neural correlates of the stress response in Turkish migrants living in Germany, and identified differences in anterior cingulate activation (Akdeniz et al. Reference Akdeniz, Tost, Streit, Haddad, Wüst and Schäfer2014). The amygdala is also an area of potential interest given it is a key component of the neural circuit processing threatening experiences (Chekroud et al. Reference Chekroud, Everett, Bridge and Hewstone2014; Fox et al. Reference Fox, Oler, Tromp, Fudge and Kalin2015; Underwood et al. Reference Underwood, Kumari and Peters2016).
A greater right amygdala neural response to pictures of faces of people with an outgroup ethnicity, compared with those with in-group ethnicity, has been interpreted as representing threat appraisal (Chekroud et al. Reference Chekroud, Everett, Bridge and Hewstone2014). This outgroup effect has been consistently demonstrated in multiple studies of individuals of white ethnicity, but has not been thoroughly investigated in individuals of black ethnicity (Cunningham et al. Reference Cunningham, Johnson, Raye, Chris Gatenby, Gore and Banaji2004; Lieberman et al. Reference Lieberman, Hariri, Jarcho, Eisenberger and Bookheimer2005; Wheeler & Fiske, Reference Wheeler and Fiske2005; Ronquillo et al. Reference Ronquillo, Denson, Lickel, Lu, Nandy and Maddox2007; Chekroud et al. Reference Chekroud, Everett, Bridge and Hewstone2014; Fox et al. Reference Fox, Oler, Tromp, Fudge and Kalin2015). In psychosis, meanwhile, amygdala hyperactivity has been linked to paranoid symptoms (Goghari et al. Reference Goghari, Sponheim and MacDonald2010; Pinkham et al. Reference Pinkham, Liu, Lu, Kriegsman, Simpson and Tamminga2015; Underwood et al. Reference Underwood, Kumari and Peters2016). Individuals from ethnic minority populations typically have much greater exposure to outgroup individuals than the native population. Amygdala hyperactivity to frequent outgroup exposure could therefore partially underlie the greater levels of paranoia seen in both ethnic minority patient and population samples (Bhugra et al. Reference Bhugra, Hilwig, Corridon, Neehall, Rudge and Mallett2000; Combs et al. Reference Combs, Penn and Fenigstein2002; Cohen et al. Reference Cohen, Magai, Yaffee and Walcott-Brown2004; Veling et al. Reference Veling, Selten, Mackenbach and Hoek2007; Wickham et al. Reference Wickham, Taylor, Shevlin and Bentall2014), and potentially have relevance as regards the increased rates of psychotic illnesses in these groups.
In view of this evidence, we hypothesised that individuals who identified as being of black ethnicity would display a greater right amygdala response to white faces, than individuals who identified as being of white ethnicity; who would, in turn, show a greater response to black faces. Within the black ethnic minority group, we further hypothesised that increased amygdala reactivity to white faces would correlate with increased ethnic segregation, and decreased own group ethnic density, as these ethnicity related neighbourhood variables are associated with increased psychosis risk.
Methods
Participants
Healthy volunteers were recruited throughout the UK via newspaper, online and leaflet advertising, and in person recruitment, as part of a study examining environmental risk factors for psychosis. Participants were aged 18–45, with no history of mental illness, in good physical health, and with the capacity to give informed consent.
The black ethnic minority group needed to be a first or second generation migrant, to self-identify as being of black ethnicity, and were classified as of either black Caribbean or black African ethnicity based on either their own (first generation migrants) or their parents’ (second generation migrants) country of origin. The white British ethnicity group needed to self-identify as being of white British ethnicity and have at least one parent of UK nationality. The white British ethnicity group was age-matched within 5 years to the black ethnic minority group. All subjects provided written informed consent after the study had been fully explained.
Sociodemographic assessment
Population density, and own group ethnic density as a fraction of the total population were obtained from the 2011 census; Indices of Multiple Deprivation (where a lower ranking equates to a more deprived area) were obtained from 2015 data (English Indices of Deprivation, 2015). Values were obtained for each participant's current statistical lower layer super output area (LSOA, geographical areas with populations of roughly 1500 individuals).
In order to quantify ethnic segregation, the Index of Dissimilarity method was used to calculate an index of segregation at the ward-level, using census output areas as the smaller geographic unit. A score of 0 is equivalent to no segregation, while a score of 1 is equivalent to complete segregation (see online Supplementary Methods for further information) (Yalonetzky, Reference Yalonetzky and Stone2015). Own group ethnic density and ethnic segregation were both calculated with participants assigned to either black African, black Caribbean or white British ethnicity.
fMRI task
An event-related, implicit face perception task was employed based on a previously reported experimental design (see Fig. 1) (Cunningham et al. Reference Cunningham, Johnson, Raye, Chris Gatenby, Gore and Banaji2004). During the task, participants indicated whether a visual stimulus appeared to the left or right of a fixation cross. The stimuli consisted of either black or white male faces presented for 30 ms (short trials) or 525 ms (long trials) or a white square also presented for 30 or 525 ms. Faces were taken from the Stanford University faces database (https://stanforduniversity.qualtrics.com/SE/?SID=SV_aX0ovSkASZR9Py4), 18 faces of each ethnicity were chosen and matched on ratings of attractiveness, stereotypicality and age. In order to mask the short duration stimuli, all stimuli were preceded by an abstract picture for 30 ms and followed by the same picture for either 525 ms (short trials) or 30 ms (long trials). As a result, all trials lasted a total of 585 ms. During the short trials, the participant's experience was of seeing an abstract picture and they were not aware of the implicitly presented face. We checked this after the experiment and no participant reported seeing a face during the presentation of these stimuli. During the long trials, they saw either a white square or a face. A fixation cross appeared for 2055 ms between trials. Each face trial was followed by four white square trials giving an interstimulus interval between faces ranging from 10.62 to 11.12 s. Participants completed three runs. During each run participants would be presented with six short trials of black faces, six long trials of black faces, six short trials of white faces and six long trials of white faces, shown in a random order without replacement.
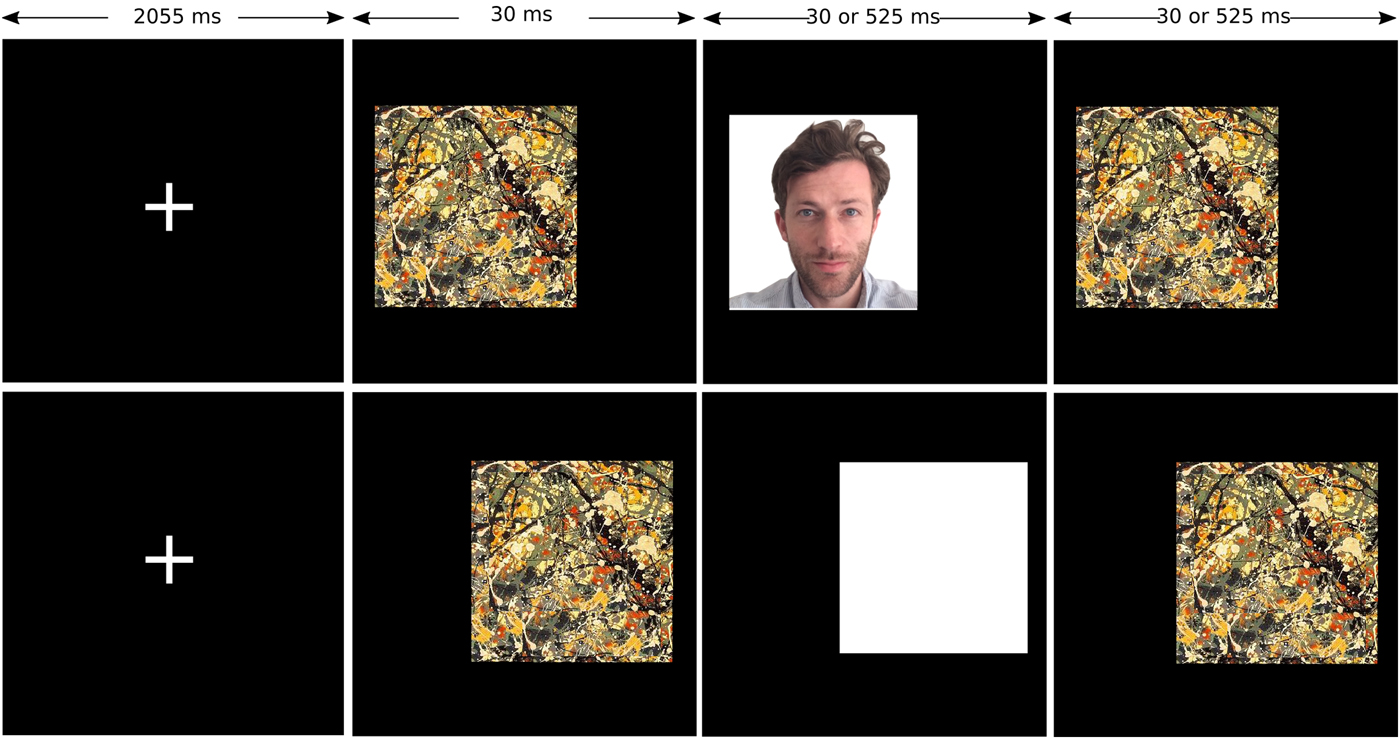
Fig. 1. fMRI task. Participants judge whether an image is to the left or right of a fixation cross. Each face trial (top row) is followed by four white square trials (bottom row).
Data acquisition
Imaging data were acquired using a Philips 3T Intera magnetic resonance imaging system. Functional imaging consisted of T2* weighted transverse echo planar image (EPI) slices. Each run consisted of 161 volumes, collected in an ascending direction, with 2.19 mm × 2.19 mm voxel dimensions in the plane, repetition time (TR) – 2000 ms, and echo time (TE) –30 ms.
The EPI scans were followed by a gradient-echo scan (TR = 9.7 ms, TE = 4.6 ms, flip angle –9°, slice thickness 1.20 mm, 0.94 × 0.94 mm2 in-plane resolution, 150 slices).
fMRI data analysis
Analysis of fMRI data was undertaken using SPM8 (http://www.fil.ion.ucl.ac.uk/spm/) in Matlab 7.9. The first two volumes for each participant were discarded so as to avoid T1 equilibration effects. Slice timing correction was applied to each volume. Spatial realignment to the third volume was followed by coregistration of each participant's functional and anatomical data. Images were then normalised into standard MNI space using the normalization parameters estimated by T1 structural image unified segmentation. Smoothing of the resampled images (3 mm × 3 mm × 3 mm) was with a Gaussian kernel of 8 mm full-width-half-maximum.
First level analysis using the general linear model included six conditions (short and long presentations of the white square, white faces, and black faces), and individual events were convolved with the canonical haemodynamic response function. The model included the six movement parameters from realignment, and six-volume to volume movement parameters, as regressors of no interest, additionally any volumes where between volume movement was greater than 0.5 mm were removed. We excluded any runs with extended shifts of over 2 mm. Participants were included in the second level analysis if they had at least two usable runs. First level contrasts were constructed between faces and white squares.
The second level within-group analyses were performed using paired t tests. The second level between groups analyses were performed using independent samples t tests, and a 2 × 2 flexible factorial ANOVA implemented in SPM8. Following from a priori hypothesis, region of interest (ROI) analyses were conducted for the amygdala using Marsbar (http://marsbar.sourceforge.net/) and the included Automated Anatomical Labelling ROI library. As per SPM conventions t test p values are reported as one-tailed.
Statistical analysis
Analyses were carried out using SPSS for Macintosh version 23.0. After exclusion of outliers of more than 1.5 interquartile ranges below or above the 1st or 3rd quartiles, continuous variables were assessed for normality using the Shapiro–Wilks test. Differences between group means were assessed using an independent samples t test for normally distributed variables, after using Levene's test to check for equality of variances. Mann–Whitney U tests were used for non-normally distributed variables. Between-group differences in terms of the magnitude of the amygdala outgroup effect, was tested with a two-tailed independent samples t test. Correlations between normally distributed variables were assessed using Pearson's product moment coefficient, and were only reported if they remained significant after removal of outliers defined as a Cook's d of >n/4. Correlations involving non-normally distributed variables were assessed using Spearman's rank correlation coefficient. All correlations were two-tailed with p < 0.05 defined as significant. Neighbourhood variables found on bivariate testing to show a significant correlation with right amygdala response were subsequently entered into a stepwise regression with right amygdala response as the dependent variable.
Data availability
Imaging and demographic data are available from the corresponding author on request.
Results
Sociodemographic and neighbourhood variables
A total of 42 individuals were included in the study (black ethnic minority group n = 20, white British ethnicity group n = 22). There were no significant differences between groups in terms of sex or age. In terms of neighbourhood variables the black ethnic minority group had significantly lower own group ethnic density percentages and lived in significantly more deprived, less segregated, and more densely populated areas (demographics of the entire sample are reported in online Supplementary Table S1, while details of those included in the imaging analysis are described in Table 1). In the black ethnicity group, participant characteristics in terms of age, gender, and deprivation were similar to UK averages. In the white ethnicity group, the study population was younger compared with the UK median age but otherwise similar (see online Supplementary Material).
Table 1. Demographic characteristics of participants included in imaging analysis

a Mann–Whitney.
b χ2 test.
Within the black ethnic minority group, own group ethnic density negatively correlated with the degree of segregation (r s = −0.809, p < 0.001) (correlations between other neighbourhood variables are described in the online Supplementary Data).
Functional imaging results
Three participants from each group were excluded due to excessive movement or failed scans. For the 30ms presentations neither black nor white faces elicited significant right amygdala activation in either the white British or black ethnic minority groups (all contrasts against the white square baseline p > 0.05). In addition, there were no significant differences between groups, or within groups between stimuli, for the 30 ms presentations. All results reported below are for 525 ms presentations.
At the within-group level, both groups individually showed greater right amygdala activation to outgroup faces (white British ethnicity group t = 1.90, p = 0.036; black ethnic minority group t = 2.38, p = 0.015) (see Fig. 2). This was reflected in a significant group × task interaction (F = 7.85, p = 0.008) (see Fig. 2). The magnitude of the outgroup effect was not significantly different between groups (t = 1.1, p = 0.3).
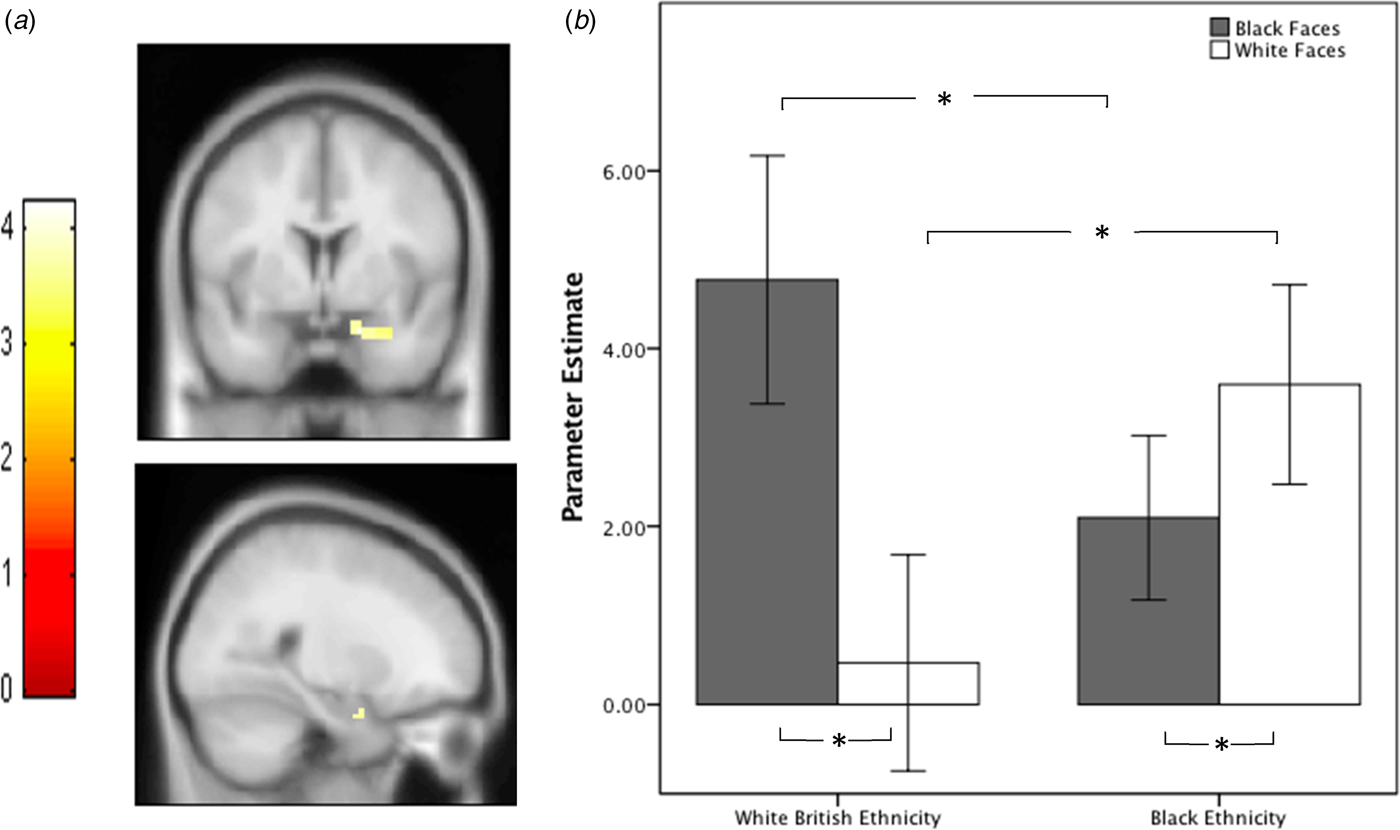
Fig. 2. (a) Increased amygdala activation in black ethnicity group compared with white British ethnicity group for white > black faces contrast during 525 ms presentations. Functional maps are unmasked and thresholded at p < 0.001 whole brain, uncorrected for display purposes. (b) Mean parameter estimates for right amygdala region of interest (ROI) for both groups, for faces (525 ms) v. white square contrasts, error bars = ±SEM. *p < 0.05.
Between groups, compared with the white British ethnicity group, the black ethnic minority group showed significantly greater right amygdala activation to white faces (t = 1.84, p = 0.038), and significantly lower right amygdala activation to black faces (t = 1.80, p = 0.040) (see Fig. 2).
Whole brain exploratory analyses were conducted to investigate the potential involvement of other regions in the effects and to enable comparisons with studies investigating other regions (peak threshold p < 0.001, cluster threshold p < 0.05 FWE corrected). No significant results were observed for the between groups, or group × task interaction analyses. For the black ethnicity group, white faces > black faces contrast one small cluster was observed in the right cerebellum (p = 0.007, cluster size −76 voxels, coordinates x = 33, y = −58, z = −26).
Relationships between imaging results and neighbourhood variables
Within the black ethnic minority group right amygdala response to white faces significantly correlated with living in an area of greater ethnic segregation (r p = 0.831, p < 0.001) and lower own group ethnic density (r s = −0.611, p = 0.009) (see Fig. 3 and online Supplementary Material for results using alternative measures of ethnic density). The right amygdala response also positively correlated with greater population density (r p = 0.627, p = 0.002) and lower levels of deprivation (r s = 0.601, p = 0.011). These findings survive Bonferroni correction accounting for the four separate tests (p < 0.0125). All four neighbourhood variables were entered into a stepwise regression with right amygdala response as the dependent variable; from this only own group ethnic density remained a significant predictor (r = 0.689, p = 0.002, see Table 2). In the white ethnicity group, no significant correlations were observed between neighbourhood variables and right amygdala response to black faces.
Fig. 3. Scatter plots for right amygdala response to whitefaces within the black ethnicities group, against: (a) % own group ethnicity of current lower layer super output area (LSOA) (r s = −0.611, p = 0.009) (b) Index of segregation (r p = 0.831, p < 0.001).
Table 2. Linear regression of relationship between of neighbourhood variables and right amygdala reactivity to white faces

Model A includes all neighbourhood variables. Model B includes only ‘own group ethnicity’ as determined by a stepwise regression.
Discussion
We demonstrated increased amygdala activation to white faces in a group of individuals of black ethnicity – both within group compared with black faces and between groups when compared with white British individuals. The white British ethnicity group showed a greater amygdala response to black faces both within, and between the group. In addition, within the black ethnic minority group, a stepwise regression including neighbourhood variables that correlated with amygdala reactivity, found that lower own group ethnic density was significantly associated with greater amygdala reactivity to white faces.
Our finding of increased right amygdala reactivity to black faces in the white British ethnicity group has been repeatedly demonstrated in white ethnicity participants (Cunningham et al. Reference Cunningham, Johnson, Raye, Chris Gatenby, Gore and Banaji2004; Lieberman et al. Reference Lieberman, Hariri, Jarcho, Eisenberger and Bookheimer2005; Wheeler & Fiske, Reference Wheeler and Fiske2005; Ronquillo et al. Reference Ronquillo, Denson, Lickel, Lu, Nandy and Maddox2007; Chekroud et al. Reference Chekroud, Everett, Bridge and Hewstone2014). This is, however, to our knowledge the first time that increased reactivity to white faces has been unambiguously demonstrated in individuals of black ethnicity. One previous study demonstrating greater amygdala activity to outgroup faces included four participants of black ethnicity but did not comment on this subgroup specifically (Hart et al. Reference Hart, Whalen, Shin, Mcinerney, Fischer and Rauch2000). A study by Lieberman et al. found that African-American ethnic minority individuals showed an increased amygdala response while viewing black faces (Lieberman et al. Reference Lieberman, Hariri, Jarcho, Eisenberger and Bookheimer2005). This study, however, included only nine African-American subjects and used a different task that focused on differences in perceptual and verbal encoding, which may explain the inconsistency with our findings. While our findings suggest a general out-group effect, this finding may potentially have a greater psychological impact for ethnic minority groups given their generally greater exposure to outgroups.
This is also the first time that amygdala reactivity has been linked to neighbourhood variables related to ethnic minority associated risk for psychosis. Living in areas of low own group ethnic density has been shown to increase the risk of psychosis in ethnic minorities (Bosqui et al. Reference Bosqui, Hoy and Shannon2014). Our results extend these findings by indicating that lower own group ethnic density is also linked to greater amygdala response to outgroup faces in black individuals. Living in an environment where one is more isolated from one's own ethnic group (i.e. an area of low own group ethnic density), could conceivably contribute to outgroup individuals being perceived as a greater threat. Taken with evidence that experiences of racism are correlated with amygdala activation to white faces in black individuals (Greer et al. Reference Greer, Vendemia and Stancil2012), this suggests that environmental exposures are associated with functional alterations in the brain circuits involved in threat processing. While a number of our results were significant when examining the bilateral amygdala (see online Supplementary Material), our findings were driven by the right amygdala. The right amygdala appears to be particularly implicated in the processing of race, although the underlying reasons for this remain unclear (Chekroud et al. Reference Chekroud, Everett, Bridge and Hewstone2014).
Methodological considerations
We investigated a group of black ethnic minority individuals who were first or second generation migrants relative to the white British ethnic majority. This group appears to display the greatest increase in the incidence of psychosis, compared with white British individuals (Fearon et al. Reference Fearon, Kirkbride, Morgan, Dazzan, Morgan and Lloyd2006; Coid et al. Reference Coid, Kirkbride, Barker, Cowden, Stamps and Yang2008). However, it should be recognised that other ethnic groups, including non-British white individuals, and Asian individuals, have increased rates of psychosis as well, and migrants may be exposed to other adverse experiences in addition to those associated with being a member of a minority group (Fearon et al. Reference Fearon, Kirkbride, Morgan, Dazzan, Morgan and Lloyd2006; Coid et al. Reference Coid, Kirkbride, Barker, Cowden, Stamps and Yang2008). Ethnic minority status itself is likely a crude proxy for multiple complex, interacting factors that cumulatively act to increase the risk of psychosis. Our study used a convenience sampling procedure and future work should determine how representative the sample is of the population in general.
Our finding of an association between ethnicity related neighbourhood variables and amygdala reactivity suggests that this mechanism may have some relevance for our understanding of the neurobiological basis of ethnic minority associated psychosis risk. This, however, is a speculative interpretation, and the current study does not establish causality. Capturing the relationship between amygdala functioning and real-world experiences of being in a minority group could potentially be accomplished using experience sampling methodologies (Gevonden et al. Reference Gevonden, Myin-Germeys, Wichers, Booij, van den Brink and van Winkel2016; Reininghaus et al. Reference Reininghaus, Kempton, Valmaggia, Craig, Garety and Onyejiaka2016).
Study participants were intentionally unaffected by mental illness, which precluded investigating direct associations with psychopathology. As our participants did not have a mental illness it is important to recognise the possibility that our findings may be interpreted as physiologically appropriate or neurobiological correlates of psychological resilience. However, the fact that in patients with schizophrenia greater amygdala responses are associated with paranoid symptoms suggests this may not be the case (Goghari et al. Reference Goghari, Sponheim and MacDonald2010; Pinkham et al. Reference Pinkham, Liu, Lu, Kriegsman, Simpson and Tamminga2015; Underwood et al. Reference Underwood, Kumari and Peters2016). Amygdala dysfunction is implicated in a wide range of disorders, so even if aberrations identified in the current study have pathoaetiological relevance, it may not be specific to psychotic disorders. Furthermore, drawing parallels with patient groups is limited by the fact that our task specifically measured differences in amygdala reactivity to faces of differing ethnicities, whereas most probes used in patient populations tend to involve emotion processing. Investigating amygdala response to faces of differing ethnicity in patient populations would assist with determining if this mechanism is linked to psychopathology.
When relating neighbourhood variables to amygdala response we were primarily interested in the influence of own group ethnic density, and ethnic segregation. We additionally measured population density and deprivation ranking. The stepwise regression resulted in a model only including own group ethnic density. Nearly all these variables, however, are strongly correlated with one another and thus determining which play mediating as opposed to confounding roles is not possible in the current study. Larger sample sizes would allow for the investigation of interactions between variables, while replication in other settings would establish whether the degree to which the effect is generalizable. Additionally, while the link between psychosis risk and own group ethnic density is well established, the evidence for the influence of ethnic segregation is less clear (Kirkbride et al. Reference Kirkbride, Morgan, Fearon, Dazzan, Murray and Jones2007, Reference Kirkbride, Jones, Ullrich and Coid2014).
We did not observe significant between or within group differences, for the 30 ms stimuli presentations. This is surprising given that this subliminal presentation has previously been found to evoke greater amygdala responses to outgroup faces than the 525 ms presentation (Cunningham et al. Reference Cunningham, Johnson, Raye, Chris Gatenby, Gore and Banaji2004). Potential reasons underlying this discrepancy may include differences in masking stimuli between the current and previous study, or differences as regards image characteristics such as levels of brightness and contrast which subliminal stimuli may be particularly sensitive to.
Implications for understanding the mechanisms underlying ethnic minority associated risk for psychosis
Cognitive models of psychosis propose an increased level of social threat anticipation as part of a pathway to the development of persecutory beliefs (Bentall & Fernyhough, Reference Bentall and Fernyhough2008). Of note, a higher degree of paranoid symptomatology has been described in ethnic minority groups, both in patient (Bhugra et al. Reference Bhugra, Hilwig, Corridon, Neehall, Rudge and Mallett2000; Veling et al. Reference Veling, Selten, Mackenbach and Hoek2007), and healthy populations (Combs et al. Reference Combs, Penn and Fenigstein2002; Cohen et al. Reference Cohen, Magai, Yaffee and Walcott-Brown2004; Wickham et al. Reference Wickham, Taylor, Shevlin and Bentall2014). In the current study, both the black ethnic minority group and the white British ethnicity group displayed increased amygdala reactivity to outgroup faces. The consequence for each group, however, may be different given that ethnic minorities typically have much greater outgroup contact in day-to-day life. Following from this, if the increased amygdala response to outgroup faces is interpreted as a marker of threat, this suggests that ethnic minority individuals have more frequent threat experience.
Although amygdala hyperactivity has been linked to paranoid symptoms in psychosis (Goghari et al. Reference Goghari, Sponheim and MacDonald2010; Pinkham et al. Reference Pinkham, Liu, Lu, Kriegsman, Simpson and Tamminga2015; Underwood et al. Reference Underwood, Kumari and Peters2016), reactivity during facial processing is not consistently raised in schizophrenia (Taylor et al. Reference Taylor, Kang, Brege, Tso, Hosanagar and Johnson2012). The black ethnic minority group in the current study did not show overall increased amygdala reactivity, only to specific stimuli. A differential sensitivity to various stimuli may partially explain the variability of findings observed in studies of amygdala function in schizophrenia.
Conclusions
Amygdala reactivity to white faces is increased in black ethnic minority individuals, and correlated with measures of own group ethnic density and segregation. These findings indicate that black ethnic minority individuals show the same response to outgroup faces seen in white ethnic majority groups, and also suggest that in this population ethnic segregation and lower own group ethnic density is associated with greater amygdala reactivity to outgroup faces.
Supplementary material
The supplementary material for this article can be found at https://doi.org/10.1017/S0033291717003506.
Acknowledgements
O.H. has received investigator-initiated research funding from and/or participated in advisory/speaker meetings organised by Astra-Zeneca, Autifony, BMS, Eli Lilly, Heptares, Jansenn, Lundbeck, Lyden-Delta, Otsuka, Servier, Sunovion, Rand and Roche. Neither Dr Howes or his family have been employed by or have holdings/ a financial stake in any biomedical company. M.M. has consulted for Cambridge Cognition, Lundbeck and Forum Pharmaceuticals in the past 3 years. He has also received research funding from Takeda, Eli Lilly and Roche. Medical Research Council and Wellcome trust. This study was funded by Medical Research Council-UK (no. MC-A656-5QD30), Maudsley Charity (no. 666), Brain and Behavior Research Foundation, and Wellcome Trust (no. 094849/Z/10/Z) grants to O.H. and the National Institute for Health Research (NIHR) Biomedical Research Centre at South London and Maudsley NHS Foundation Trust and King’s College London. R.M.’s work is supported by the Wellcome Trust (no. 200102/Z/15/Z). T.D.’s work is supported by a EU-FP7 MC-ITN IN-SENS grant (no. 607616). The views expressed are those of the authors and not necessarily those of the NHS, the NIHR or the Department of Health.
Declaration of interest
The other authors declare no competing financial interests.
Author contributions
R.M. designed and performed experiments, analysed data, and wrote the paper. M.B designed and performed experiments, and reviewed the manuscript. T.D. and M.Q. performed experiments and reviewed the paper. S.T. designed experiments and reviewed the manuscript. M.M. analysed data and reviewed the paper. O.H. obtained funding, designed the study and wrote the paper.


 Open access