CLINICIAN’S CAPSULE
What is known about the topic?
Fee-for-service compensation may motivate physicians to see more patients and improve throughput, or drive excessive testing and referral behaviour that undermine emergency performance.
What did this study ask?
Does fee-for-service payment reduce emergency wait times, length of stay, and left without being seen rates?
What did this study find?
We observed an unsustained 24% reduction in time to physician, but no change in length of stay or left without being seen rates.
Why does this study matter to clinicians?
Fee-for-service compensation may have transient motivational effect but is unlikely to generate system-level improvement.
INTRODUCTION
Traditional physician payment models are based on fee-for-service compensation, where physicians charge a fee for every service provided. This is believed to motivate high volume more interventional practice because physicians who treat more patients generate more income.Reference Leger 1 , Reference Gosden, Forland and Kristiansen 2 Fee-for-service systems are challenging for payers, who have little control over their physician services budget, 3 and in recent years, health reform has spawned new compensation models, shifting many physicians into contract-based payments that reward time rather than volume.Reference Khullar, Chokshi and Kocher 4
Anecdote and published data suggest that fee-for-service physicians see patients more rapidly and tend to overutilize, providing services and prioritizing patients that maximize their income.Reference Leger 1 , Reference Gosden, Forland and Kristiansen 2 , Reference Blomqvist and Busby 5 , Reference Innes 6 Contract-based physicians may be less financially motivated to see patients rapidly and more likely to focus on quality;Reference Khullar, Chokshi and Kocher 4 , Reference Innes 6 , Reference Schroeder and Frist 7 however, if this behavior is tied to lower patient-per-hour productivity, it could negatively impact waiting times and operational performance in emergency departments (EDs) where demand exceeds capacity and patient queuing is the norm. It is difficult to compare productivity associated with the two compensation methods because physicians who choose to work in fee for service versus contract situations may differ based on personal priorities and efficiencies, and because patient complexity, diagnostic resources, processes, and system efficiencies differ in different settings.
Most Canadian ED physicians now work in contracted groups, where the regional health authority establishes the number of physician full-time equivalents (FTE) and total physician coverage hours for each department, and where a fixed income level is assigned to each FTE. Under this payment scheme, physicians contract to work a set number of hours or shifts but cannot increase their income by seeing more patients during shifts. Vancouver Coastal Health (VCH) ED physicians have worked in this type of contract-based funding system for over 2 decades. In August 2015, primarily because of the inability to control staffing levels, ED physicians at one Vancouver hospital switched from contract to fee-for-service payments. 8 This created a natural experiment where compensation mechanism changed but other productivity determinants remained constant. Our objective was to assess the impact of a change in physician payment modality on ED operational parameters. Our hypothesis was that fee-for-service payment would lead to increased patient-per-hour productivity and throughput, manifested by a reduction in wait times, shorter ED length of stay (LOS), and lower left-without-being-seen rates.
METHODS
Design and setting
This interrupted time series (ITS) analysis with concurrent control was performed in VCH, a regionally integrated health system with centralized planning, care coordination, information systems, and performance measurement. VCH has two tertiary hospitals situated 2 km apart in downtown Vancouver. St. Paul’s Hospital (SPH) is a full-service tertiary inner city hospital with large cardiac and renal programs and a substantial population of homeless, mental health, HIV, and substance use patients. Vancouver General Hospital (VGH) is a tertiary trauma, stroke, and cardiac centre. Both see over 80,000 visits per annum and serve as academic training sites with residency training programs. The UBC Research Ethics Board approved this study.
Participants
We analysed all ED visits occurring at the study hospitals from February 6 to November 26, 2015. During this 42-week period, VGH physicians remained on contract payment, whereas on August 1, 2015, SPH physicians switched to fee for service (the intervention). No other structural or operational changes took place at either site, there were no instrumentation changes in the capture of key time elements, and physician coverage hours remained constant at both sites.
Data collection
The study sites use common triage, registration, data collection, and triage processes that did not change during the study period. At both sites, triage time, wait time to see a physician, and discharge time are captured using passive time stamps. Patients who leave without being seen by a physician are tracked electronically. Time to physician, ED LOS, and left-without-being-seen rates are collected and audited as standard ED reporting measures in the region, and are available within the regional ED information system. Data are collated regionally, and the VCH Decision Support Group oversees all administrative health data capture, data management, and data quality.
Outcomes
The primary outcome measure was median wait time to physician. Secondary outcomes included the median ED LOS and the left-without-being-seen rate.
Data analysis
We performed a descriptive analysis to compare patient volumes, triage acuity, emergency medical services (EMS) arrival, and admission rates during pre- and post-intervention periods, and estimated differences with intervals of 95% confidence for important parameters. The median wait time to physician, ED LOS, and left-without-being-seen rates were aggregated by week and plotted for the two sites in a time series fashion. Our ITS analysis involved fitting models with a time series specification, including four variables for each site: an intercept term (level at time=0), a trend term (pre-intervention trend), a post-intervention level change, and a post-intervention trend change. The differences in level and slope relative to pre-existing trends represented our estimated impact of the change in payment on outcomes. To account for potential correlation between successive weekly observations, we used a generalized least squares model with an autoregressive structure with an 11-week lag.Reference Fox and Weisberg 9 , Reference Coghlan 10 Other models using similar autoregressive and moving average structures produced substantively identical results (not shown). Analyses were performed using R-statistical software, version 3.13 (The R Foundation for Statistical Computing). The Nonlinear Mixed Effects Models package (José Pinheiro and Douglas Bates) and Companion to Applied Regression package (John Fox and Sanford Weisberg, 2015) were used for the assessment and control of autocorrelation.Reference Fox and Weisberg 9 - Reference Pinheiro, Bates, DebRoy and Sarkar 11
RESULTS
We analysed data from 142,359 ED visits, including 75,246 at the control site and 67,113 at the intervention site. Table 1 shows that the sites saw similar patient volumes and proportions of mid-acuity Canadian Triage and Acuity Scale (CTAS) 3 patients, but the control site saw more high acuity CTAS 1 and 2 patients (19.0% v. 13.7%). Post-intervention volumes were lower by three patients per day (1.2%) at the control site and by four patients per day (1.7%) at the intervention site. During the post-intervention period, EMS arrival rates rose by 0.5% (95% confidence interval [CI]; −0.1% to 1.2%) at the control site and 1.7% (95% CI; 1.0% to 2.4%) at the intervention site, whereas admission rates rose by 0.4% (−0.2% to 1.0%) and 0.6% (0.1% to 1.1%), respectively.
Table 1 Site Characteristics

Figure 1 shows that median baseline wait time to physician was 58.8 minutes at the control site and 33.8 minutes at the intervention site. During the pre-intervention period, there was an upward trend (slope) of 0.09 minutes per week at the control site and 0.48 minutes per week at the intervention site (p for the difference<0.001). At the control site, immediately post-intervention, wait time (level) increased by 2.4 minutes (p=0.3) then improved by 0.9 minutes per week (trend) relative to the expected counterfactual (p<0.001). At the intervention site, immediately post-intervention, the wait time level fell by 7.2 minutes (difference from control=9.6 minutes; 95% CI, 2.9-16.4; p=0.007), but the subsequent wait time trend deteriorated, with wait times rising by 0.5 minutes per week relative to the expected counterfactual (p for the trend difference=0.07).
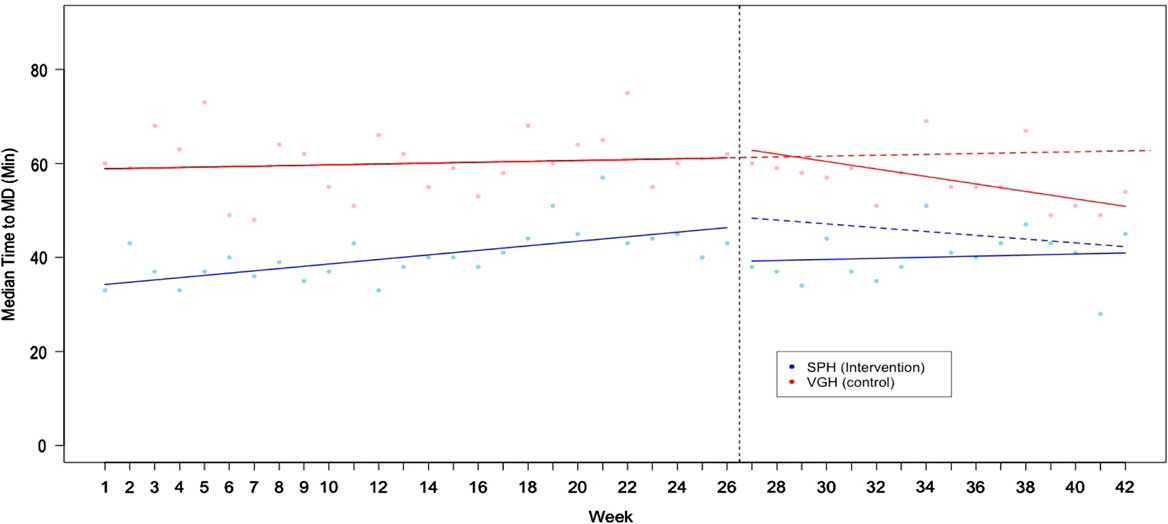
Figure 1 Median Wait Time to Physician (TTMD) in Minutes Dotted red line shows the expected post-intervention trend (counterfactual) at the control site, while the solid red lines show actual performance: a statistically insignificant 2.4 minute post-intervention rise (level change), followed by an improvement trend of 0.9 minutes per week better than expected (p<0.001). Dotted blue line shows the expected post-intervention trend at the intervention site (driven by the change seen at the control site), while the solid blue line shows actual observed performance: an initial 9.6 minute improvement relative to control (p=0.007), followed by an upward trend (deterioration) of 0.5 minutes per week relative to expected (p for the trend change relative to control=0.07).
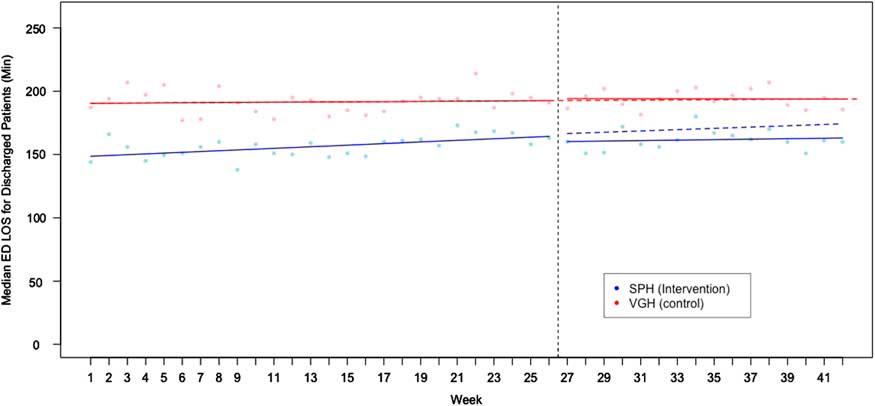
Figure 2 shows that baseline ED LOS for discharged patients was 190 minutes at the control site and 148 minutes at the intervention site. Pre-intervention trends were similar. Post-intervention, ED LOS decreased by 1.7 and 6.0 minutes at the two sites (p for the difference=0.43), and there was a nonsignificant improvement trend (p=0.63) at the intervention hospital.
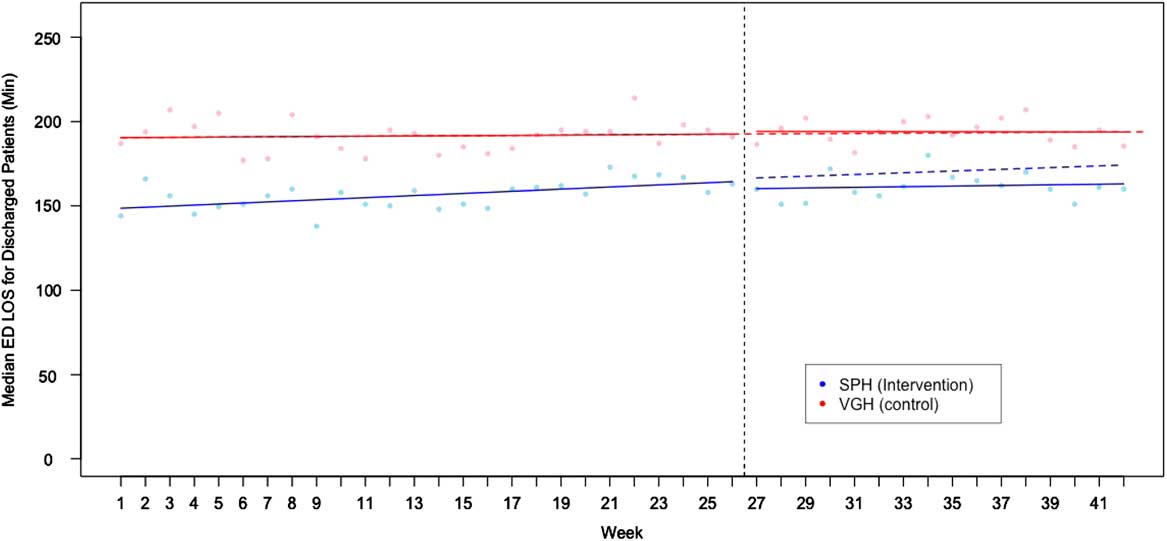
Figure 2 Median ED Length of Stay (LOS) for Discharged Patients (Min) Baseline EDLOS for discharged patients was 190 minutes at the control site and 148 minutes at the intervention site, with no significant difference in pre-intervention trends (p=0.08). Dotted red line shows the expected post-intervention trend (counterfactual) at the control site, while the solid red lines show actual performance. At the time of the intervention there were 1.7 and a 6.0 minute decreases in EDLOS (p for the difference, 0.43). Minimal post-intervention trend changes of −0.12 minutes per week and −0.33 minutes per week were observed but were not significant.
Figure 3 shows baseline left-without-being-seen rates of 3.1% at the control site and 2.4% at the intervention site. Pre-intervention left-without-being-seen rates increased by 0.04% per week at the control site and 0.06% at the intervention site (p for the difference=0.001). At the control hospital, post-intervention, left-without-being-seen rates fell by 0.6% (level change, p<0.001), whereas the trend (slope) improved by 0.04% per week (p=0.002) relative to the expected counterfactual. At the intervention site, the left-without-being-seen rate fell by 0.4%, slightly less than the improvement at the control site (p for the difference=0.41). This was followed by an improvement of 0.05% per week, better than the expected counterfactual (p for the difference=0.04). By the end of the study, cross-site differences in all measured parameters approximated those seen at baseline.
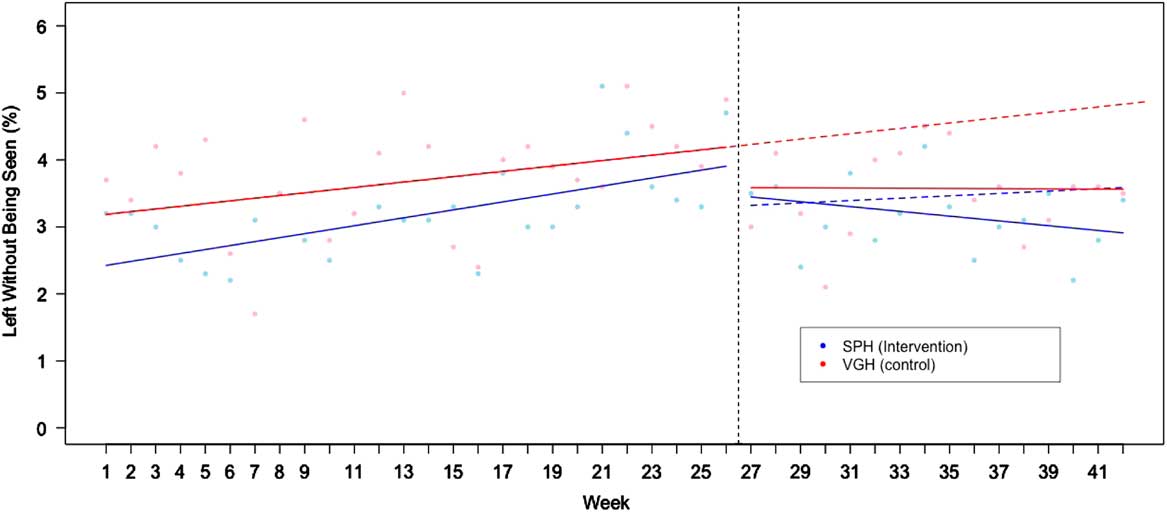
Figure 3 Left Without Being Seen Rates by Site Dotted red line shows the expected post-intervention trend (counterfactual) at the control site, while the solid red lines show actual performance: a 0.6% level change (p<0.001), followed by an improvement trend of 0.04% per week better than expected (p=0.002). Dotted blue line shows the expected post-intervention trend at the intervention site (driven by the change seen at the control site), while the solid blue line shows actual observed performance: an initial 0.4% reduction relative to the control change (p for the difference=0.41), followed by an improvement trend of 0.05% per week relative to expected (p=0.04).
DISCUSSION
The conversion to fee-for-service compensation was associated with a statistically significant 9.6-minute (24%) reduction in wait time to physician, but this improvement was not sustained. After the initial level change, wait times at the two sites converged, and by the end of the study period, cross-site wait time differences approximated those seen pre-intervention. These findings are compatible with a transient extrinsic motivational effect (seeing more patients rapidly) followed by a regression to baseline performance. The change in compensation had no apparent effect on ED LOS for discharged patients, which is a marker of ED physician throughput time and efficiency. Post-intervention left-without-being-seen rates fell at both sites. Although the intervention site had a slightly more impressive post-intervention improvement trend (0.05% per week), this was preceded by an equally impressive pre-intervention deterioration, and hence may have represented regression to the norm rather than an effect of the intervention. In support of this hypothesis is that cross-site differences in all measured parameters were not significantly different from the beginning to the end of the study.
Physician efficiency is a construct of motivation, intrinsic speed, diagnostic utilization patterns, decision capacity, risk tolerance, and comfort with uncertainty.Reference Croskerry 12 , Reference Croskerry 13 It is thought to be a key determinant of ED operational performance, but there are many other important factors. Overall ED performance is a dynamic balance between demand and capacity. Demand factors include patient volume, complexity, care needs, expectations, boarding levels, and arrival patterns, including predictable and unpredictable surges.Reference Rathlev, Chessare and Olshaker 14 - Reference Asplin, Magid and Rhodes 17 Capacity factors include number and type of ED care spaces; the proportion of these lost to inpatient boarding; the adequacy of clinician staffing, including degree to which physician, nurse, and ancillary provider availability is matched to patient inflow; the presence and level of house staff support; ED technical infrastructure; consultant responsiveness; lab and imaging turnaround times; and other factors. ED performance is also influenced by process efficiencies in registration and triage, front-end intake models, nurse-initiated diagnostics, information technology system ergonomics, bed turnover strategies, departmental culture, and other factors. It is therefore not surprising that changing one factor – physician compensation – had little effect on the operational parameters studied. Payment mechanism may or may not change individual physician productivity, but the data here suggest that, if it does, this effect does not overcome other determinants.
We found no prior studies documenting the relationship between physician payment models and operational performance. Proponents of fee-for-service compensation believe that it motivates physicians to be efficient, see patients quickly and in higher number, and improve ED access and throughput.Reference Leger 1 , Reference Gosden, Forland and Kristiansen 2 In addition, fee-for-service systems allow physician groups to match physician supply to rising patient demand; while this might not occur in contract-based systems if physician staffing is limited by government-established FTE levels that do not rise concurrently with patient volumes, hence leaving EDs with inadequate physician coverage hours. 8
Critics of fee-for-service compensation believe that fee for service motivates high-speed low-quality care, cherry-picking, and excessive testing and referral behaviorReference Gosden, Forland and Kristiansen 2 that can undermine ED performance – in addition that the fee-for-service payment motivates physician groups to understaff EDs to assure that there is always a queue of waiting patients. It is therefore conceivable that a change in compensation model could have beneficial or detrimental effects. Conversely, payment modality may have little impact on operational parameters if physicians have a set-point for speed and efficiency and if, while immersed in a high stress ED shift, income considerations become secondary to patient care demands. Our data address none of these controversies.
ITS analysis accounts for longitudinal trends preceding and following the interventionReference Fretheim, Zhang and Ross-Degnan 18 and is the strongest quasi-experimental approach to evaluating the effect of an intervention over time.Reference Penfold and Zhang 19 - Reference Shadish, Cook and Campbell 21 Other strengths of this study are the consistent collection of validated administrative data throughout the study period and the incorporation of a control hospital, which enabled the development of more valid counterfactual assumptions (what would likely have happened to key outcomes in the absence of the intervention).Reference Fretheim, Zhang and Ross-Degnan 18 , Reference Penfold and Zhang 19 Our data show increasing wait times and left-without-being-seen rates during the pre-intervention phase, suggesting that environmental, volume, or case mix factors negatively influenced ED performance during the February to August period. These negative trends reversed at both hospitals during the August to November period, suggesting that post-intervention changes in operational performance, in part, were related to seasonal or environmental factors, or regression to the norm.
The core assumption of an ITS with control analysis is that, absent the intervention, changes in the intervention group will parallel those seen in the control group. With one exception, this is what happened. The exception was a significant improvement in wait time (level change) occurring after a conversion to fee-for-service billing, only at the intervention site – a likely effect if fee-for-service payment increases physician motivation. But this improvement was not sustained as cross-site wait time differences converged during the post-intervention phase. A plausible interpretation of these data is that, although fee-for-service compensation may motivate performance change, it may not modify a physician’s efficiency “set point” in a sustained fashion, and performance would inevitably regress towards the baseline, as seen in Figure 1. Our data do not rule out longer-term learning effects in physicians, and they do not rule out the possibility that fee-for-service compensation might, over time, improve ED performance by attracting physicians who have a faster set point (hence more to gain in a fee-for-service environment). These concepts must be viewed as hypotheses generated, not proven.
LIMITATIONS
The study time frame was long enough to demonstrate a change in operational performance compatible with the study hypothesis and to see that this change was not sustained; however, it was too short to know whether new payment models would attract physicians with different efficiency habits, whether physician practice might evolve over time, or whether physician groups would use new-found control over manpower to increase physician staffing to meet patient needs or decrease staffing to meet physician needs. A much longer post-intervention period could have clarified some of these issues but would have increased the likelihood of history threats such as staffing changes, process improvements, patient flow initiatives, and regional programmatic change affecting sites differentially.
Because our objective was to assess the impact of the change in compensation models on operational performance, we studied department, not patient-level, outcomes. We did not assess individual physician productivity, and it is likely that fee-for-service payment has different effects on different physicians. We did not measure nurse or patient satisfaction with the new model, and we did not assess its impact on referrals, diagnostic utilization, or quality outcomes. Importantly, we did not measure physician satisfaction or physician income. Our findings are relevant to complex systems like multi-physician clinics and EDs, and are generalizable to the extent that diverse physician populations respond similarly to changing incentives. There are, however, countless different contract-based compensations systems, and we studied one only; therefore, external validity is a concern.
From a policy perspective, our data suggest that changes in physician compensation may have transient motivational effects but that these likely regress over time. The data also suggest that modifying physician compensation, in isolation, is unlikely to generate significant or sustained system-level improvement.
CONCLUSION
Fee-for-service payment was associated with a 9.6-minute (24%) reduction in wait time, compatible with an extrinsic motivational effect; however, this was not sustained, and the intervention had no impact on other operational parameters studied. Physician compensation is an important policy issue but may not be a primary determinant of ED operational efficiency or patient throughput.
Competing interests: None declared.