


Iodine is crucial in the formation of thyroid hormones, triiodothyronine and thyroxine, and it is essential for mammalian life( Reference Delange 1 ). Worldwide, iodine deficiency has emerged as a major public health issue because it is one of the most common micronutrient deficiencies, and it affects developing as well as industrialised countries( 2 ). This is of particular concern during pregnancy, seeing as iodine deficiency can lead to miscarriage, premature birth, impaired growth and adverse neurological development as well as cretinism and infant mortality in cases of severe iodine deficiency( Reference Delange 1 , Reference Zimmermann 3 ).
Iodine requirement is thought to increase during pregnancy, and the WHO recommends that pregnant women increase their intake to 220 μg/d, as compared to 150 μg/d for non-pregnant adults( 2 ). This increased requirement is the result of increased maternal thyroid hormone production, the transfer of iodine from the mother to the fetus and greater renal clearance of iodine( Reference Delange 4 , Reference Glinoer 5 ). However, the recommended intake of iodine during pregnancy, which is defined as the amount that is sufficient to meet the needs of 97–98 % of the population, varies between industrialised countries, with a recommended nutrient intake of 140 μg/d in the UK (no difference from non-pregnant women)( 6 ), an RDA of 220 μg/d in the USA( 7 ) and a recommended dietary intake (RDI) of 220 μg/d in Australia and New Zealand( 8 ). Assessment of iodine intake is challenging because the iodine content in foods is influenced by a number of factors, including fertilisers, irrigation, sanitising and industrial agents, rainfall, season and location( Reference Smyth 9 ). Furthermore, it is difficult to accurately estimate the intake of iodine from the use of iodised salt in cooking and at the table( Reference Skeaff 10 ). As a result, urinary iodine concentration (UIC) is often used as an indicator of iodine status, and the WHO/UNICEF/International Council for Control of Iodine Deficiency Disorders (ICCIDD) defines a median UIC of ≥ 150 μg/l, based on the RDI, as sufficient iodine intake during pregnancy( Reference Untoro, Mangasaryan and de Benoist 11 ). However, UIC is only reflective of recent iodine intake and has large intra-individual variation( Reference König, Andersson and Hotz 12 ), which limits its use as an assessment of usual dietary iodine intake. Given the importance of iodine during pregnancy, an accurate assessment of habitual iodine intake is needed.
Dietary assessment poses challenges, seeing as many tools rely on memory, an accurate estimation of intake and a lengthy time commitment( Reference Meltzer, Brantsæter and Ydersbond 13 ). FFQ are used to assess long-term habitual intake, and they are useful for nutrients such as iodine that are less common in the food supply( Reference Meltzer, Brantsæter and Ydersbond 13 ). FFQ are less time consuming, have a lower burden on participants and cost less than the more traditional dietary assessment method of weighed food records does( Reference Meltzer, Brantsæter and Ydersbond 13 ). However, FFQ must be appropriate for the population in question, and they must consider that population's usual foods and food patterns. It is known that during pregnancy eating habits often change, which may be a reflection of dietary recommendations, the avoidance of certain foods as well as pregnancy-related sickness( Reference Mouratidou, Ford and Fraser 14 ). Thus, the dietary assessment method must be tailored to suit this population.
Previous studies have developed and validated general FFQ, and these have been used to assess iodine intake during pregnancy( Reference Brantsæter, Haugen and Alexander 15 , Reference Erkkola, Karppinen and Javanainen 16 ). However, general FFQ are often long and time-consuming. Additionally, much of the information captured in a general FFQ would not be relevant when the focus is on iodine intake. We are interested in developing an iodine-specific FFQ (I-FFQ) that can be used in large-scale studies to assess iodine intake as well as to identify women with inadequate intake who may be at risk of iodine deficiency.
To our knowledge, there are only three published I-FFQ that have been developed and validated: two for use in non-pregnant adult women in Denmark( Reference Rasmussen, Ovesen and Bulow 17 ) and the UK( Reference Combet and Lean 18 ) and one for use in the elderly( Reference Tan, Charlton and Tan 19 ). These questionnaires were validated for use in those specific populations to reflect the common food habits and practices of those populations and thus their use for pregnant women is limited. The aim of the present study was to develop an I-FFQ for use during pregnancy and to assess its reproducibility and validity against the following: (1) iodine intake from a weighed food record; (2) urinary iodine from a 24 h urine sample and a spot urine sample; and (3) blood biomarkers of iodine status.
Methods
Subjects
Participants were recruited from a group of women who were participating in the Pregnancy Iodine and Neurodevelopment in Kids (PINK) study in Adelaide, Australia. A total of 122 women from the Women's and Children's Hospital were recruited between August 2011 and April 2012 from the antenatal clinic at their first antenatal appointment. Eligible women were at less than 20 weeks gestation and had no history of thyroid disease. Ethics approval was obtained from the Women's and Children's Health Network Human Research Ethics Committee, and all women provided written informed consent.
Development of the iodine-specific FFQ
The I-FFQ was developed to determine the women's average iodine intake over the past month. The food items were selected from the most up-to-date Australian food composition database, NUTTAB 2010( 20 ), which is based on analytical data. For food items that were not listed in NUTTAB, the AUSNUT 2007 (Australian Food and Nutrient Database), which incorporates nutrient data from a range of sources, including recipes, international food composition tables as well as calculated and imputed data, was used to supplement the list( 21 ).
Foods were included in the I-FFQ if they had an iodine content of ≥ 5 % of the RDI per serve for Australian pregnant women (10 μg/serve). Serving sizes were based on standard serves using the Australian Guide to Healthy Eating or food labels, and they were expressed as measurements (in g) or convenient household units (cup, tsp or tbsp). There were some foods that fell just under the 5 % RDI criteria per serve; however, they were included in the I-FFQ because they are considered common in the Australian diet. These foods include noodles and pasta, rice, cheese, ice cream, cooked broccoli, spinach and bok choy, chocolate, cashews, cheese-flavoured snacks and pizza. For those food items with more than one variety, such as different types of fish and cheese, the average iodine content was used. The final questionnaire consisted of forty-four food items (see online Supplementary material). The food items were classified into seven main food groups based on those listed in the NUTTAB database( 20 ), including seafood, cereal products, dairy, eggs, vegetables, snacks and sweets, and ready-made foods. For each food item, the frequency of intake was recorded as the number of serves per d, per week or per month. If the food was not consumed on a monthly basis, the frequency of intake was marked as rarely/ < 1 per month. There were three additional semi-quantitative questions about salt use, including whether salt was added in cooking or at the table, if the salt added was iodised salt and what the estimated daily portion used was (in categories ranging from less than one-quarter of a tsp to more than one tsp).
Validation of the iodine-specific FFQ
Subjective measures, such as weighed food records, are commonly used in the validation of FFQ. However, these measures have similar limitations to FFQ, including memory bias and misreporting. Objective measures of dietary intake, such as urine and blood biomarkers, do not have these same limitations. We used both subjective and objective measures to validate the I-FFQ with the following methods:
-
1 Comparison of iodine intake at 28 weeks gestation estimated from the I-FFQ with the 4 d weighed food record;
-
2 Correlation between total iodine intake at 28 weeks gestation (estimated from the I-FFQ plus supplements) and urinary iodine from a 24 h urine sample and a spot urine sample collected at the same time;
-
3 Correlation between total iodine intake at 28 weeks gestation (estimated from the I-FFQ plus supplements) and thyroid function, including thyroid stimulating hormone (TSH), thyroglobulin (Tg), free triiodothyronine (fT3) and free thyroxine (fT4), which were assessed at the same time;
-
4 Reproducibility of the I-FFQ during pregnancy (at study entry and at 28 weeks gestation).
Assessment of iodine intake
Iodine intake from food was assessed using the I-FFQ at study entry ( < 20 weeks gestation) and at 28 weeks gestation. The questionnaire was checked for completeness by a dietitian. Women were given oral and written instructions, including examples on how to complete the I-FFQ. They were asked to estimate the frequency of consumption of each listed food item during the past month. To calculate the mean daily iodine intake from the I-FFQ, all frequencies of consumption (per week and per month) were converted to per d, assuming that there were 7 d in a week and 30 d in a month. The frequency of consumption per d was multiplied by the average iodine content of the specific food. This calculation was completed for each individual food item and was added together to give the mean daily iodine intake from food.
In addition to the I-FFQ, iodine intake from food was also assessed using a weighed food record at 28 weeks gestation. Women were asked to keep a weighed food record for four consecutive days including one weekend day between 26 and 28 weeks gestation. They were given oral and written instructions and were provided with digital kitchen scales and measuring cups. The women were asked to weigh and record details of the food consumed as well as to weigh and record any left-overs of each food item. If eating out, the women were asked to record details about their meal. A separate space was provided to record any home-cooked recipes, including the amount (in g or units) of raw ingredients used, the number of serves the recipe yielded and the number of serves consumed. Foodworks with the NUTTAB 2010 and AUSNUT 2007 (version 7, 2012) (Food Standards Australia New Zealand; FSANZ) was used to assess dietary intake from the weighed food records. If food items were not listed in the database, they were entered as the closest resembling food item or the nutritional information, as derived from the food label or company website, was added to the database. These food items were kept in a log for consistency of data entry. Iodine intake from iodised salt was not included in the calculation of iodine intake from food because the intake of iodised salt captured in the I-FFQ was semi-quantitative and was not able to be quantified. Because of the difficulty of accurately measuring the use of salt in cooking or at the table, intake of iodised salt use was also not captured in the weighed food record.
Information regarding supplement usage, including brand name, dose and frequency, was gathered separately from women at 28 weeks gestation. Iodine intake from these supplements was calculated based on the manufacturer's information. Total iodine intake was estimated by summing up iodine intake from foods and iodine intake from supplements. For the remainder of this report, ‘total iodine intake’ is used to denote estimated iodine intake from food plus supplements.
Assessment of urinary iodine
A spot urine sample was collected at the 28-week gestation appointment to assess UIC (μg/l), and a 24 h urine sample was collected within 2 d of the 28-week appointment to assess urinary iodine excretion (UIE in μg/d). The women were asked to collect the 24 h urine sample after completing the weighed food record. The first urine passed on the day of collection was not saved and was recorded as the start time and date of the 24 h collection. All urine passed for the next 24 h was collected. The final sample was collected 24 h after the start time and was recorded as the end time and date. Women were provided with written instructions and with the necessary equipment, including a 4-litre container to store the total urine collected and a 1-litre measuring jug, both of which had been tested and cleared for iodine contamination, to assist with collecting each sample. Once completed, the samples were refrigerated and delivered to the laboratory at the Women's and Children's Hospital within 2 d of collection. The total volume was measured, and aliquots of 10 ml were taken and stored at − 20°C for analysis. The method for the analysis of UIC was modified from the WHO ‘Method A’ procedure( 2 , Reference Ohashi, Yamaki and Pandav 22 ) using ammonium persulfate digestion and a microplate reading. The analytical value for the external iodine standard was 284·5 (sd 12·2) μg/l, compared with the certified value of 304 (sd 44) μg/l. The percent relative standard deviation of the assay was 4·3 %.
UIE (μg/d) was calculated by measuring UIC (μg/l) from the 24 h urine sample and multiplying that measurement by the total volume of 24 h urine. UIE is considered the reference standard when assessing population iodine intake and is often used to validate other methods( Reference Vejbjerg, Knudsen and Perrild 23 ). UIC from the spot urine was used as an additional reference measure. For the remainder of this report, ‘spot UIC’ is used to denote UIC (μg/l) measured from the spot urine sample, ‘24 h UIC’ is used to denote UIC (μg/l) measured from the 24 h urine sample and ‘24 h UIE’ is used to denote UIE (μg/d) calculated from the 24 h UIC.
Blood biomarkers
At 28 weeks gestation, a blood sample was taken via venepuncture to assess thyroid function markers, including TSH, Tg, fT3 and fT4. The analysis was conducted by SA Pathology, a National Association of Testing Authorities–accredited diagnostic laboratory in Adelaide. TSH, fT3 and fT4 were determined using an ADVIA Centaur automatic chemiluminescence immunoassay (Siemens Healthcare Diagnostics). Tg and Tg antibodies were determined using the Immulite 2000 chemiluminescent immunometric assay (Siemens Healthcare Diagnostics). The coefficients of variability for TSH, fT3, fT4 and Tg were 5, 7, 4·5 and 8 %, respectively. The manufacturer's non-pregnancy reference ranges for TSH, fT3, fT4 and Tg were 0·5–4 mIU/l, 3·1–5·4 pmol/l, 10–25 pmol/l and 0–59 ng/ml, respectively.
Sample size and statistics
At the time that the study was conducted, there was limited data on total dietary iodine intake in pregnant women. Therefore, sample size calculations were based on iodine intake data from a previous iodine FFQ validation study of females of child-bearing age( Reference Rasmussen, Ovesen and Bulow 17 ). Assuming a median iodine intake of 115 μg( Reference Rasmussen, Ovesen and Bulow 17 ), we estimated that eighty-four women would be required in order to detect a minimum difference of 20 μg (10 % of the RDI) in reported iodine intake between the two dietary assessment methods, with 90 % power and a correlation of 0·5 (P< 0·05). A difference of < 10 % RDI was considered clinically insignificant.
Statistical analyses were performed using the Statistical Package for Social Sciences version 16.0.0 (SPSS, Inc.). For continuous variables, results were reported as means with standard deviations for normally distributed variables or median (interquartile range, IQR) for non-normally distributed variables. For categorical variables, results were reported as number and percentage.
Paired t tests were conducted to compare mean iodine intakes at 28 weeks gestation between the I-FFQ and weighed food records, and Pearson's correlation coefficient was used to determine the correlation between the two different dietary assessment methods. Agreement between the two dietary methods was assessed using the Bland–Altman method. Limits of agreement, which are defined as the mean difference ± 2 sd between the methods, were calculated( Reference Bland and Altman 24 ). Estimated iodine intake at 28 weeks gestation as measured by the I-FFQ and weighed food record was also categorised as adequate ( ≥ 160 μg/d) or inadequate ( < 160 μg/d) based on the Australian estimated average requirement (EAR). The weighted kappa coefficient k was used to assess the agreement in the categorisation of adequate intake between the two dietary assessment methods( Reference Fleiss, Cohen and Everitt 25 ). Linear regression analysis was used to assess the relationship between total iodine intake at 28 weeks gestation (from the I-FFQ+supplements) and biomarkers, including 24 h UIE, 24 h UIC, spot UIC and thyroid function, which were adjusted for potential confounding factors, including BMI, age, gestational age, parity, smoking status and education. The analysis was also repeated for iodine supplement users and non-supplement users as well as for iodised salt users and non-iodised salt users. Women who used supplements containing iodine at 28 weeks gestation were classified as iodine supplement users, whereas those who used no supplements containing iodine were classified as non-iodine supplement users. Similarly, women who used iodised salt at 28 weeks gestation were categorised as iodised salt users, whereas those who used no salt or who used non-iodised salt were classified as non-iodised salt users. A Kruskal–Wallis test was conducted to compare the difference in UIC between the various categories of daily iodised salt intake. To assess the reproducibility of the I-FFQ, iodine intake from the I-FFQ at study entry ( < 20 weeks gestation) and at 28 weeks gestation were compared using a paired t test. Pearson's correlation coefficient was used to determine the correlation between iodine intake at the two time points. Statistical significance was set at P< 0·05.
Results
A total of 122 women were recruited for the validation study, and ninety-six women completed the study. Characteristics of the participants are shown in Table 1. These women were aged between 18 and 41 years and had a gestational age at study entry between 11 and 20 weeks. It is found that 75 % (72/96) of women were taking iodine supplements, and 47 % (45/96) were using iodised salt. Of the non-iodised salt users, fifteen of these women (29 %) used no salt in cooking or at the table, and thirty-six (71 %) used non-iodised salt. Demographic characteristics of non-completers (n 26) did not differ from those of completers (n 96) (data not shown). Reasons for women not completing the study included lack of time (n 17), withdrawal from the PINK study (n 7), miscarriage (n 1) and illness (n 1).
Table 1 Demographic characteristics at study entry (<20 weeks gestation) (Mean values and standard deviations; number of participants and percentages)

Iodine intake at 28 weeks gestation from the iodine-specific FFQ and 4 d weighed food record
Mean iodine intakes at 28 weeks gestation from the I-FFQ and 4 d weighed food record were 144 (sd 52) and 160 (sd 54) μg/d (mean difference 15·7, 95 % CI 3·35, 28, P= 0·013) with no added supplements and 281 (sd 124) and 297 (sd 121) μg/d (mean difference 15·3, 95 % CI 2·9, 27·6, P= 0·016) with the addition of supplements. As shown in Fig. 1, a moderate correlation was found between the iodine intake from food at 28 weeks gestation estimated using the I-FFQ and weighed food record (r 0·349, P< 0·001), and that correlation was strengthened once supplements were added (r 0·876, P< 0·001). The limits of agreement for the Bland–Altman plot were between − 106 and 137 μg/d across the range of iodine intake reported from food (Fig. 2). There was a fair agreement (k= 0·28, P< 0·001) between the two dietary measures at 28 weeks gestation in the ability to classify the women as receiving adequate or inadequate intake based on estimated average requirement, with 66 % of women classified into the same category. This was strengthened when supplements were added, with 90 % of women classified into the same category according to the estimated average requirement (k= 0·72, P< 0·001).

Fig. 1 Iodine intakes at 28 weeks of gestation (μg/d) estimated from the iodine-specific FFQ (I-FFQ) and weighed food diary with (a) no added supplements (r 0·349, P< 0·001) and (b) added supplements (r 0·876, P< 0·001).
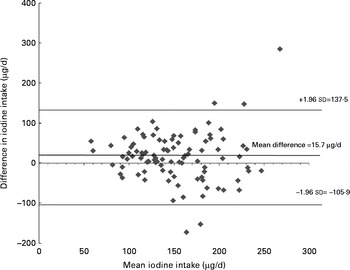
Fig. 2 Bland–Altman limit of agreement between the iodine intake estimated from iodine-specific FFQ (I-FFQ) and weighed food diary at 28 weeks of gestation with no added supplements.
There were no differences in estimated iodine intake from food at 28 weeks gestation between the two dietary methods when they were analysed separately for iodine supplement users and non-iodine supplement users or for iodised salt users and non-iodised salt users. Iodine supplement users showed a strong correlation in iodine intake from food at 28 weeks gestation between the two dietary assessment methods (r 0·721, P< 0·001), but no correlation was shown in non-iodine supplement users. Non-iodised salt users also showed a moderate correlation in iodine intake at 28 weeks gestation between the two dietary assessment methods (r 0·576, P< 0·001), but no correlation was observed in iodised salt users.
Reproducibility of the iodine-specific FFQ during pregnancy
There was no difference between the mean iodine intake from food estimated using the I-FFQ at study entry and at 28 weeks gestation (153 (sd 70) v. 144 (sd 52) μg/d, respectively, P= 0·097). A strong correlation (r 0·622, P< 0·001) was shown between the estimated iodine intake at the two time points (Fig. 3).
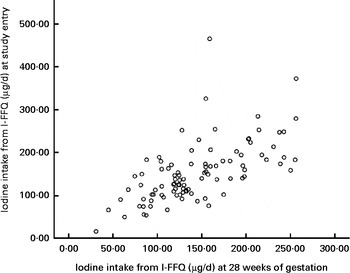
Fig. 3 Iodine intakes (μg/d) measured from the iodine-specific FFQ (I-FFQ) at study entry ( < 20 weeks of gestation) and at 28 weeks of gestation with no added supplements (r 0·622, P< 0·001).
Association between total iodine intake at 28 weeks gestation (from the iodine-specific FFQ plus supplements) and urinary iodine concentration
Median 24 h UIC and spot UIC was 178 (IQR 131–231) and 212 (IQR 118–311) μg/l, respectively. UIE from the 24 h urine sample was 332 (IQR 236–404) μg/d. There was no correlation between 24 h UIE and spot urine UIC (r 0·112, P= 0·281). Iodine supplement users had a higher median 24 h UIC and 24 h UIE than non-iodine supplement users did (24 h UIC: 189 (IQR 144–249) v. 145 (IQR 103–200) μg/l, P= 0·007; 24 h UIE: 360 (IQR 285–423) v. 216 (IQR 130–290) μg/l, P< 0·001), but there were no differences in spot UIC (220 (IQR 123–333) v. 200 (IQR 101–270) μg/l, P= 0·144). Iodised salt users had a higher median 24 h UIE than non-iodised salt users did (358 (IQR 247–434) v. 320 (IQR 187–389) μg/l, P= 0·038), but median 24 h UIC and spot UIC did not differ between iodised salt users and non-iodised salt users (24 h UIC: 175 (IQR 145–226) v. 188 (IQR 119–232), P= 0·478; spot UIC: 234 (IQR 123–337) v. 180 (IQR 115–309) μg/l, P= 0·308). There were no differences in 24 h UIC (P= 0·67), 24 h UIE (P= 0·139) or spot UIC (P= 0·144) between different categories of iodised salt intake (data not shown).
Total iodine intake at 28 weeks gestation estimated using the I-FFQ was associated with 24 h UIC and 24 h UIE (Table 2). There was no association between total iodine intake at 28 weeks gestation from the I-FFQ and spot UIC (Table 2). Iodine supplement users showed a moderate correlation between total iodine intake at 28 weeks gestation from the I-FFQ and 24 h UIC and 24 h UIE (r 0·362, P= 0·004, and r 0·313, P= 0·008, respectively), but no correlation was shown in non-iodine supplement users. Non-iodised salt users showed a moderate correlation between total iodine intake at 28 weeks gestation from the I-FFQ and 24 h UIC (r 0·491, P< 0·001), but no correlation was observed in iodised salt users. 24 h UIE was moderately correlated with total iodine intake at 28 weeks gestation from the I-FFQ in both iodised salt users (r 0·331, P= 0·028) and non-iodised salt users (r 0·605, P< 0·001). No correlation was shown between total iodine intake at 28 weeks gestation from the I-FFQ and spot UIC in iodine supplement users and non-iodine supplement users or in iodised salt users and non-iodised salt users (data not shown).
Table 2 Association between total iodine intake at 28 weeks gestation (estimated from iodine-specific FFQ plus supplement) and biomarkers (β-Coefficients and standard error of the correlation)

UIC, urinary iodine concentration; UIE, urinary iodine excretion; FT3, free triiodothyronine; FT4, free thyroxin; TSH, thyroid stimulating hormone; TG, thyroglobulin.
* Adjusted for BMI, age, gestational age, parity, smoking status and education.
Association between total iodine intake at 28 weeks gestation (food from the iodine-specific FFQ plus supplements) and thyroid function
The mean for TSH, fT3, fT4 and Tg was 1·53 (sd 0·10) mIU/l, 3·8 (sd 0·04) pmol/l, 11·95 (sd 0·14) pmol/l and 17·9 (sd 1·4) ng/ml, respectively. Tg antibodies were undetected in all women. No association was found between total iodine intake at 28 weeks gestation from the I-FFQ and any markers of thyroid function, including TSH, fT3, fT4 and Tg, with or without adjustment for BMI, age, gestational age, parity, smoking status and education (Table 2). Similar findings were also observed in iodine supplement users and non-iodine supplement users and in iodised salt users and non-salt users (data not shown).
Discussion
To the best of our knowledge, this is the first study to develop and validate an I-FFQ for assessing iodine intake in pregnant women using both dietary assessment and functional biomarkers. The present results suggest that the I-FFQ can be used as a valid tool for estimating iodine intake in Australian pregnant women, because the iodine intake estimated from the I-FFQ was moderately correlated with the 4 d weighed food record and showed strong reproducibility. Additionally, total iodine intake from the I-FFQ was associated with the 24 h UIE and 24 h UIC. The present results also suggest that the I-FFQ can be useful for screening women who may be at risk of inadequate dietary intake.
The present results show that the correlation between the I-FFQ and weighed food record was strengthened once supplements were added, and this is likely the result of an increased range of iodine intake. The correlation coefficient in the present study compared well with other iodine FFQ validity studies of adults that used 4 d weighed food records (r values ranging from 0·45 to 0·52)( Reference Rasmussen, Ovesen and Bulow 17 , Reference Combet and Lean 18 ) and repeated 24 h dietary recalls (r 0·377)( Reference Tan, Charlton and Tan 19 ). Other validation studies in pregnancy have assessed multiple nutrients, including iodine, and not surprisingly, the findings were inconsistent with energy-adjusted correlation coefficients ranging from 0·40 to 0·66 between FFQ and 4 d weighed food records( Reference Brantsæter, Haugen and Alexander 15 , Reference Erkkola, Karppinen and Javanainen 16 ) to − 0·03 between FFQ and a 24 h diet recall( Reference Mouratidou, Ford and Fraser 14 ). These inconsistencies may be a reflection of the reference method and FFQ used, including the length of the study and the food items included. Other single-nutrient validation studies reported similar correlations to the present study, including an Fe-specific checklist with a diet history interview (r 0·69, Fe from food and supplement) during pregnancy( Reference Zhou, Schilling and Makrides 26 ) and a Ca-specific FFQ with a 6 d weighed food record in women of child-bearing age (r 0·42)( Reference Ward, Hunt and Berg 27 ).
Although correlation analysis is commonly used, this does not indicate an agreement between the two methods. The Bland–Altman method is often viewed as the preferred technique to assess agreement and hence to determine validity of a new method( Reference Bland and Altman 24 ). Despite the large limits of agreement, the present study showed a small mean difference (15·7 μg/d) between iodine from food assessed using I-FFQ and that assessed using a weighed food diary with a consistent variability across the range of iodine intakes. Many dietary validation studies have found similar results( Reference Mouratidou, Ford and Fraser 14 , Reference Rasmussen, Ovesen and Bulow 17 – Reference Tan, Charlton and Tan 19 , Reference Zhou, Schilling and Makrides 26 , Reference Wilson and Horwath 28 , Reference Pinto, Severo and Correia 29 ). This is likely to be a reflection of the differences between the dietary measures, seeing as FFQ are commonly used to estimate longer-term, habitual intake, whereas diet records or 24 h recalls estimate recent intake. Whether or not the Bland–Altman method is appropriate for dietary validation studies that compare FFQ with diet records or 24 h recalls should therefore be questioned, seeing as the Bland–Altman analysis was originally designed to compare similar methods( Reference Bland and Altman 24 ). Depending on the nutrient in question, a sensitive biomarker may be better suited to validate the ability of an FFQ to identify women who are at risk of deficiency.
The present study is the only validation study that has used both 24 h urine and spot urine samples as reference markers to validate an I-FFQ. The association between total iodine intake from the I-FFQ and 24 h UIE in the present study is comparable to an iodine validation study of non-pregnant women( Reference Rasmussen, Ovesen and Bulow 17 ), but it contrasts with another which showed no association between iodine intake from an I-FFQ and 24 h UIE( Reference Combet and Lean 18 ). This is not surprising, given that both spot and 24 h urine samples are subject to large intra-individual variation and thus are not reliable markers of individual iodine status( Reference König, Andersson and Hotz 12 ). In addition to finding no association between the spot UIC and total iodine intake, the present results also showed no correlation between the spot UIC and 24 h UIE, which demonstrates that UIC from a spot urine sample is a poor indicator of iodine intake and status. Spot UIC adjusted for creatinine (expressed as iodine:creatinine ratio) has been suggested as a more accurate measure of iodine excretion and a better reflection of iodine intake than spot UIC alone( Reference König, Andersson and Hotz 12 , Reference Tan, Charlton and Tan 19 , Reference Vejbjerg, Knudsen and Perrild 23 , Reference Knudsen, Christiansen and Brandt-Christensen 30 , Reference Andersen, Karmisholt and Pedersen 31 ). However, this may be dependent on the nutritional status, hydration, sex and age of the population( Reference Vejbjerg, Knudsen and Perrild 23 ), and it is an additional expense, so routine measurement of creatinine is limited( Reference Zimmermann and Andersson 32 ). We found higher spot UIC compared to 24 h UIC (P< 0·001), although other studies have found no differences between these measures( Reference König, Andersson and Hotz 12 , Reference Perrine, Cogswell and Swanson 33 ). It has been shown that at least ten repeated spot or 24 h urine samples are needed to assess individual iodine status( Reference König, Andersson and Hotz 12 ), but this is cumbersome and often impractical. Because of these limitations of UIC as a marker of individuals' iodine intake and status, a simple I-FFQ like the one developed in the present study would be a more practical tool to assess iodine intake and status in pregnant women.
No relation between iodine intake from the I-FFQ and any of the blood biomarkers was shown. It is known that thyroid function is tightly regulated, and there are adaptive mechanisms in place to ensure that the functional needs are met, even in times of mild iodine deficiency( Reference Glinoer 34 ). Therefore, it may be that changes in blood biomarkers as a result of inadequate iodine intake will only occur in severely deficient populations, but this is not the case for the present population, which explains the lack of correlation shown here. This may also be similar to other biomarkers of nutrient intake, seeing as single-nutrient validation studies in pregnancy that have used blood biomarkers as reference measures also found no or weak correlations with FFQ( Reference Zhou, Schilling and Makrides 26 , Reference Rondo, Villar and Tomkins 35 ). There are uncertainties regarding the reliability of fT4 and fT3 immunoassays during pregnancy( Reference Stagnaro-Green, Abalovich and Alexander 36 ). It has been suggested that measuring free thyroid hormone concentration in the presence of high concentrations of bound thyroid hormones such as those that occur during pregnancy may not be accurate and that total thyroid hormone, which accounts for increases in binding proteins, may be a better measure( Reference Stagnaro-Green, Abalovich and Alexander 36 ).
Within this population, there were a similar number of women who used iodised salt compared with those who did not. Non-iodised salt users showed a correlation between total iodine intake from the I-FFQ and 24 h UIC, whereas iodised salt users showed no correlation. This is not surprising, seeing as iodine from salt was not quantified from the I-FFQ, which would explain the poor correlation with biomarkers in iodised salt users compared with non-iodised salt users. Interestestly, iodine intake between the I-FFQ and weighed food record was correlated in non-iodised salt users but not in iodised salt users. The reasons for this are unknown because iodised salt was not quantified in either dietary assessment. These results should be interpreted with caution, seeing as this is a secondary analysis and may be a chance finding.
We did not quantify iodine intake from iodised salt, as other iodine validation studies have( Reference Combet and Lean 18 , Reference Tan, Charlton and Tan 19 ), because of the difficulty of accurately measuring salt intake. Therefore, iodine intake assessed from the I-FFQ and weighed food diary is likely to be underestimated in this study's population, and this idea is supported by the 24 UIE result. Assuming that 90 % of dietary iodine is excreted from urine, a 24 h UIE of 332 μg/d would convert to an iodine intake of 368 μg/d. It is expected that the quantification of iodised salt may strengthen the association between iodine intake from the I-FFQ and biomarkers. We found that spot UIC and 24 h UIC did not differ between iodised salt users and non-iodised salt users or between categories of iodised salt intake, which suggests that the impact of iodised salt use on biomarkers is minimal within this population. Nonetheless, this I-FFQ can be further modified to better quantify salt use in populations where iodised salt is a significant source of dietary iodine.
We only collected one 24 h urine sample and one spot urine sample to measure UIC and UIE. To better assess individual iodine status, at least ten 24 h and spot urine samples would have been required( Reference König, Andersson and Hotz 12 ), but this was not practical in the present study. We did not use para-aminobenzoic acid as a recovery marker to assess the compliance of the 24 h urine collection( Reference Vejbjerg, Knudsen and Perrild 23 , Reference Jakobsen, Ovesen and Fagt 37 ), because the safety of para-aminobenzoic acid use in pregnancy has not been determined. Measurements of creatinine levels in urine and comparisons of these levels to predicted creatinine excretion have also been used to assess the completeness of a 24 h urine collection( Reference Baxter, Riddell and Huggins 38 ). However, this approach also has limitations, because 24 h urinary creatinine excretion is influenced by other factors, such as hydration, dietary intake, sex and age( Reference Vejbjerg, Knudsen and Perrild 23 ). Although we measured Tg antibodies, we did not measure thyroperoxidase levels. It is known that thyroid autoimmunity can affect the relationship between iodine intake and thyroid function, and thus this is a potential limitation of the present study. However, women with a history of thyroid disease were excluded from the study, and all women tested negative to Tg antibodies. Thyroid autoimmunity is thus unlikely to be an issue that will affect the present results.
The present study has a number of strengths. To our knowledge, this is the only iodine FFQ validation study to use both subjective (weighed food record) and objective (biomarkers) measures. Additionally, our sample size was adequate, the most updated food composition data was used to estimate iodine intake from the two dietary measures and the time allocated for the collection of the reference methods was well controlled. Although we recognise that FFQ need to be validated in the target population because dietary habits and practices can vary, we believe that with minimal adaptions this I-FFQ can be a useful tool to estimate iodine intake in pregnant women in other industrialised countries that have similar dietary patterns and recommendations to those in Australia, such as the UK( 6 , 39 ) and the USA( 40 ).
Conclusion
The validity of the I-FFQ to estimate habitual iodine intake in Australian pregnant women has been demonstrated by moderate associations with 4 d weighed food records and iodine status from 24 h UIE as well as strong reproducibility. Furthermore, the results of the present validation study indicate that the I-FFQ can be used as a simple clinical tool to screen pregnant women who are at risk of inadequate iodine intake. However, the I-FFQ has a limited ability to predict thyroid function. The I-FFQ could be modified to assess iodine intake in other populations.
Supplementary material
To view supplementary material for this article, please visit http://dx.doi.org/10.1017/S0007114515000197
Acknowledgements
The authors thank Ms. Dao Huynh for her assistance with the laboratory analysis and the research staff at Child Nutrition Research Centre for their assistance with the clinic appointments.
This work was supported by the National Health and Medical Research Council (grant no. 626800) and the Women's and Children's Hospital Foundation. Both funding bodies had no role in the design, analysis or writing of this article.
The authors' contributions are as follows: D. C., M. M., S. S. and S. J. Z. designed the study; D. C. collected the data and performed statistical analysis; D. C. drafted the manuscript with contributions from all authors. All authors reviewed and approved the final draft of the manuscript.
The authors declared that they have no conflicts of interest.


