


Obesity is a current major health problem, and excess intake of energy and fat leads to increases in adipose tissue and ectopic fat adiposity, especially in the liver. Non-alcoholic fatty liver disease (NAFLD) is now a common cause of chronic liver disease, and the prevalence of NAFLD continues to increase worldwide and is related to insulin resistance (IR), obesity and the metabolic syndrome(Reference Seidell1). Body fat accumulation, fatty liver and IR play important roles in the progression of NAFLD from fatty liver to hepatosteatosis, and even fibrosis. Overconsumption of dietary lipids leads to abnormal lipid metabolism and increased hepatic fat accumulation, which activates expression of cytochrome P450 (CYP) 2E1 and increases in vivo oxidative stress and inflammatory responses(Reference Sakaguchi, Takahashi and Sasaki2). In addition to increases in hepatic cytokine levels, adipose tissues can also release adipokines which have certain physiological effects. A high-fat diet and increased adipose tissues, especially abdominal adipose fat, can lead to imbalanced adipokine excretion(Reference Falcao-Pires, Castro-Chaves and Miranda-Silva3). Elevation of the circulating leptin concentration and a reduction in the adiponectin concentration are related to IR, secretion of proinflammatory cytokines and further cardiovascular complications(Reference Ntaios, Gatselis and Makaritsis4). In addition, the gut microbiota also plays important roles in the progression of NAFLD. A high-fat diet leads to changes in the gut bacterial composition and increased circulating lipopolysaccharide levels, which activates hepatic toll-like receptor (TLR) signalling and increases downstream proinflammatory cytokines such as TNF-α and IL-1β (Reference Miura and Ohnishi5). Thus, the gut microbiota and TLR have also become potential treatment targets of NAFLD.
The tea tree is one of the most important crops in Taiwan. Camellia oleifera is traditionally used to produce tea seed oil, and the pomace is used as a detergent and for traditional remedies(Reference Ye, Xing and Chen6). Studies reported that tea leaves, flower buds and seeds exhibit antioxidative, hypoglycaemic, hypolipidaemic and antiobesity activities due to their phenolic, saponin and polysaccharide contents(Reference Kuo, Lin and Yang7–Reference Zhang, Han and Bao9). In vitro studies reported that the constituents of the seed cake exhibited antioxidative and hypoglycaemic effects(Reference Zhu, Wang and Ye10, Reference Zhang and Li11). Recently, we found that tea seed extract may attenuate hepatic fat accumulation in rats fed a high-fat diet(Reference Yang, Yeh and Ko12). However, the possible mechanisms still remain unclarified. Therefore, we used a rat model with diet-induced NAFLD (with fat as approximately 70 % of the total energy) to investigate the effects of the hot-water extract of defatted C. oleifera seeds on lipid metabolism, insulin resistance and inflammation in the progression of NAFLD.
Materials and methods
Preparation of the Camellia oleifera seed extract
The defatted seed pomace of C. oleifera was collected from oil factories in Nantou County, Taiwan. Seed pomace of C. oleifera was defatted with n-hexane and ground into powder. CSE sample was prepared as previously reported(Reference Yang, Yeh and Ko12). Briefly, 10 g of the powder was extracted with 100 ml of hot water (90−100°C) three times for 1 h each. The extracted solution was then filtered, and the filtrate was lyophilised and ground into powder as our CSE sample with a recovery rate of 30 %. The CSE samples contain 81·3 (sd 0·6) mg/g total polyphenols as gallic acid equivalent, 206·3 (sd 8·7) mg/g total saponins as diosgenin equivalent and 6·3 ± 0·4 % total polysaccharides as we previously reported(Reference Yang, Yeh and Ko12).
Experimental design
Forty male Wistar rats (200−250 g) were purchased from the National Laboratory Animal Breeding and Research Center. Investigators at the I-Shou University Laboratory Animal Center followed protocols described in the ‘Guide for the Care and Use of Laboratory Animals’ and approved by the Institutional Animal Care and Use Committee (IACUC-ISU-101022). Animals were housed in individual cages in a room maintained at 23 ± 2°C with 55 ± 5 % humidity and a 12 h light–12 h dark cycle. Rats were fed a standard rat chow diet (Rodent Laboratory Chow 5001, Purina Mills) for 1 week and then were fed a control liquid diet for 1 week for adaptation. In the NAFLD-inducing period, we induced NAFLD in rats using diets described in a previous study(Reference Lieber, Leo and Mak13). Eight rats received the control liquid diet, and the other thirty-two rats received an NAFLD diet, a high-fat-liquid diet (with fat as 72 % of the total energy) which was isoenergetic with the control diet to induce fatty liver and hepatic inflammation. After the 16-week induction period, the control group and eight rats of the NAFLD group were killed, and their blood, liver and abdominal adipose tissues were collected for analysis. Then, the remaining twenty-four rats with NAFLD were further randomly assigned to three groups including groups NN, NA and NB (n 8/group) and were fed with the NAFLD diet, respectively, containing 0, 4·5 and 9 g/l of CSE powder for an 8-week experimental period. We adjusted the three diets to make them isoenergetic. During the experimental period, food intake was recorded daily and animals were weighed each week. At the end of the experiment, all rats were killed, and blood, liver and adipose tissue samples were collected for analysis.
Blood collection and analysis
During the last week of the experiment, an oral glucose tolerance test with 1 g/kg glucose intake was performed in rats starved for 12 h. Changes in blood glucose and plasma insulin levels were measured before and 30, 60, 90, 120 and 180 min after glucose intake. Blood glucose was determined using a commercial kit (Randox Laboratories), and plasma insulin levels were determined using an ELISA kit (Mercodia Rat Insulin ELISA). Homeostasis model assessment-IR was calculated as follows: homeostasis model assessment-IR (mmol/l × μU/ml) = fasting glucose (mmol/l) × fasting insulin (μU/ml)/22·5. The AUC under the receiver operating characteristic was calculated using the trapezoid method and compared with the control group at the 16th week and group NN at the 24th week.
At the end of the study, rats were starved for 12 h and blood samples were collected from the abdominal vein into heparinised tubes. Plasma samples were collected after centrifugation (2000 g for 10 min at 4°C) and stored at 80°C to analyse total cholesterol, TAG, aspartate aminotransferase and alanine aminotransferase concentrations. All analyses were carried out on a Hitachi 7170 Autoanalyzer or with commercial kits (Randox Laboratories). The plasma malondialdehyde concentration was measured by the thiobarbituric acid-reactive substance method(Reference Griesmacher, Kindhauser and Andert14). Plasma leptin and adiponectin were measured with ELISA kits (Biovendor; Assaypro).
Liver analysis
After perfusing the livers with saline, they were collected and stored at −80°C. Liver lipids were extracted with chloroform and methanol. Total cholesterol and TAG in the liver were determined using diagnostic kits (Randox Laboratories). To determine thiobarbituric acid-reactive substance and cytokine concentrations in the liver, samples were homogenised in buffer containing 50 mm Tris-base, 150 mm NaCl and 1 % Triton-X 100. The liver level of TNF-α was measured with an ELISA kit (rat TNF-α/TNFSF1A, R&D Systems). Hepatic IL-1β and IL-6 levels were measured using an ELISA kit (Rat IL-1β, DuoSet ELISA Development System; R&D Systems). The hepatic malondialdehyde level was determined as described in previous paragraph.
Western blotting
The liver was homogenised in buffer containing 0·25 m sucrose, 10 mm Tri-HCl and 0·25 mm phenylmethylsulfonyl fluoride (pH 7·4). The homogenate was centrifuged at 104 g for 20 min at 4°C. The supernatant was transferred to a new tube and centrifuged at 1·05 × 105 g for 60 min at 4°C to separate the microsomes. The microsomal pellet was dissolved in 50 mm potassium phosphate buffer containing 1 mm EDTA and 1 mm dithiothreitol (pH 7·4) and used for the CYP2E1 and CYP4A analyses. For the PPAR-α, PPARγ, transforming growth factor (TGF)-β, TLR4, myeloid differentiation primary response gene (MyD) 88 and toll/IL-1 receptor domain-containing adaptor inducing interferon-β (TRIF) analyses, we homogenised liver samples in RIPA buffer containing 50 mm Tris-HCl, 150 mm NaCl, 0·1 % SDS and 1 % NP-40 (pH 7·5) and after centrifugation, the supernatant was stored at −80°C.
Western blotting was performed to evaluate levels of CYP2E1, CYP4A, PPARα, PPARγ, TGF-β, TLR-4, TRIF and myeloid differentiation primary response gene 88 (MyD88) using appropriate antibodies, followed by a horseradish peroxidase (HRP)-conjugated secondary antibody. Samples containing 50 μg protein were separated on a 12·5 % SDS-polyacrylamide gel and transferred onto a polyvinylidene fluoride membrane (Amersham Biosciences, GE Healthcare). Non-specific binding sites were blocked by overnight incubation of the membranes at 4°C in a 5 % non-fat milk solution. After washing with PBS/Tween-20, membranes were incubated with a rat CYP2E1 monoclonal antibody (mAb; 1:1000 dilution, Oxford Biomedical Research), a rabbit CYP4A polyclonal antibody (pAb; 1:1000 dilution, ABR PA3-033), a mouse PPARα pAb (1:500 dilution, Santa Cruz Biotechnology), a rabbit PPARγ pAb (1:500 dilution, Santa Cruz Biotechnology), a rabbit TGF-β pAb (1:500 dilution, Santa Cruz Biotechnology), a mouse TLR4/CD284 mAb (1:1000 dilution, Imgenex), a rabbit MyD88 pAb (1:1000 dilution, Cell Signaling) or a rabbit TRIF pAb (1:1000 dilution, NOVUS) at room temperature for 2, 1 and 2 h, followed by incubation with an HRP-conjugated anti-mouse antibody (1:5000 dilution, Chemicon AP124P, Millipore) or anti-rabbit antibody (1:5000 dilution, Amersham) for CYP4A. Membranes were then washed, and the immune complex was developed using a chemiluminescence detection system (ECL, Western Lighting, PerkinElmer). Equal loading of the total protein was verified using a commercially available mAb against β-actin, and results are expressed as the ratio of protein to β-actin.
Histological analysis
Dissected livers of rats were fixed in formaldehyde. Samples were stained with haematoxylin–eosin (H&E). Biopsies were examined by a pathologist on a blinded basis. To evaluate fatty changes, the liver was observed at 200× magnification with a scale. Degrees of fatty liver were assessed by a pathologist.
Adipose tissue
We measured the abdominal fat mass by excising and weighing epididymal, retroperitoneal and mesenteric fat pads at the end of the induction and experimental periods.
Faecal lipid excretion and intestinal microbiota
Faecal samples of the experimental groups were collected at the end of the experimental period. Faeces over 24 h were collected using metabolic cages 3 d before rats were killed. Faecal samples were dried, weighed, powdered and extracted with chloroform and methanol. Cholesterol, bile acids and total lipids were determined using commercial kits (Randox laboratories; Fortress BXC0263).
The intestinal microbiota was assessed following the previously reported method(Reference Yang, Chen and Shang15). Briefly, fresh faecal samples were collected the day before the end of the experiment in sterile centrifuge tubes with anaerobic dilution buffer. Samples were properly diluted and inoculated onto agar for a plate count determination. Bifidobacteria Iodoacetate medium, de Man, Rogosa and Sharp with bromocresol green, dehydrated culture media (Endo) and CDC anaerobe blood agar plates were, respectively, used to detect Bifidobacterium spp., Lactobacillus spp., coliform organisms and total anaerobic bacterial flora. The anaerobic:aerobic ratio was calculated as the ratio of the sum of Bifidobacterium spp. and Lactobacillus spp. to total anaerobes.
Statistical analysis
To decide the appropriate sample size without unnecessary wasting of animals, we calculated the number of mice for each group using G Power and regarding hepatic TAG and TNF-α concentration as main parameters following the method described previously(Reference Charan and Kantharia16) under a type I error of 5 % and statistical power reaching 80 %. Data are reported as mean values with their standard errors. Statistical analyses were performed using SAS software (version 9.3; SAS Institute). Differences between the control and NAFLD groups at the 16th week were analysed by Student’s t test, and differences among the three experimental groups at the 24th week were analysed by a one-way ANOVA and Fisher’s least significant difference test. Differences were considered significant at P < 0·05.
Results
Induction of non-alcoholic fatty liver disease
At the 16th week, body weight gain and abdominal fat weight of the NAFLD group were significantly higher than those of the control group, while we found no difference in daily energy intake between rats consuming different diets during the induction period (Table 1). Rats consuming an NAFLD-inducing diet also had higher aspartate aminotransferase, alanine aminotransferase (Table 1), hepatic lipid accumulation and IL-1β levels (Table 2). In the histopathological analysis, a liver biopsy of the control group showed normal histology, while that in the NAFLD group revealed a picture of steatohepatitis with macrovesicular and microvesicular steatosis in panacinar areas. Mild lobular inflammation, hepatocyte ballooning change and focal perisinusoidal fibrosis in zone 3 were present (Fig. 1). In addition, we also found that hepatic CYP2E1 and TGF-β expression were higher in the NAFLD group than in the control group (Fig. 2).
Table 1. Body weight gain, energy intake and plasma analysis of rats at the end of the induction and experimental periods (Mean values with their standard errors)
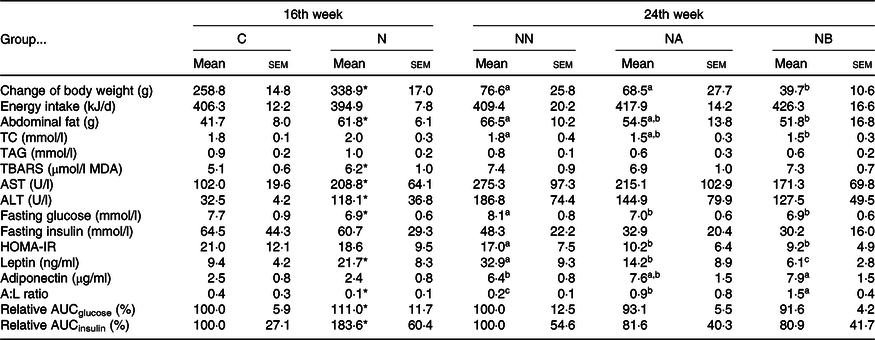
C, control diet during the induction period; N, NAFLD diet during the induction period; NAFLD, non-alcoholic fatty liver disease; NN, NAFLD diet during the experimental period; NA, NAFLD diet with 4·5 g/l Camellia oleifera seed extract (CSE) during the experimental period; NB, NAFLD diet with 9·0 g/l CSE during the experimental period (n 8/group in each time point); TC, total cholesterol; TBARS, thiobarbituric acid-reactive substance; MDA, malondialdehyde; AST, aspartate transaminase; ALT, alanine transaminase; HOMA-IR, homeostasis model assessment of insulin resistance; A:L, adiponectin:leptin; relative AUC, area under plasma glucose or insulin curve during 0 to 180 min in the oral glucose tolerance test and presented as the relative percentage of group C or group NN.
a,b,c Mean values within a row with unlike superscript letters at the same time point are significantly different (P < 0·05).
* Significantly different from group C (P < 0·05).
Table 2. Hepatic lipid and proinflammatory cytokines of rats at the end of the induction and experimental periods (Mean values with their standard errors)

C, control diet during the induction period; N, NAFLD diet during the induction period; NAFLD, non-alcoholic fatty liver disease; NN, NAFLD diet during the experimental period; NA, NAFLD diet with 4·5 g/l Camellia oleifera seed extract (CSE) during the experimental period; NB, NAFLD diet with 9·0 g/l CSE during the experimental period (n 8/group in each time point); TC, total cholesterol; TBARS, thiobarbituric acid-reactive substance.
a,b,c Mean values within a row with unlike superscript letters at the same time point are significantly different (P < 0·05).
* Significantly different from group C (P < 0·05).

Fig. 1. Histopathology of hepatic fatty changes (A) and scores (B) at the end of the non-alcoholic fatty liver disease (NAFLD)-inducing period for the control (C) and NAFLD (N) groups and at the end of the experimental period for groups NN, NA and NB. Representative images were taken at a magnification of 200×. Values are presented as mean values with their standard errors. NN, NAFLD diet during the experimental period; NA, NAFLD diet with 4·5 g/l Camellia oleifera seed extract (CSE) during the experimental period; NB, NAFLD diet with 9·0 g/l CSE during the experimental period (n 8/group in each time point). a,b,c Values with unlike letters at the same time point are significantly different (P < 0·05). Arrows indicated steatosis (arrow head) and inflammation (thin arrow).
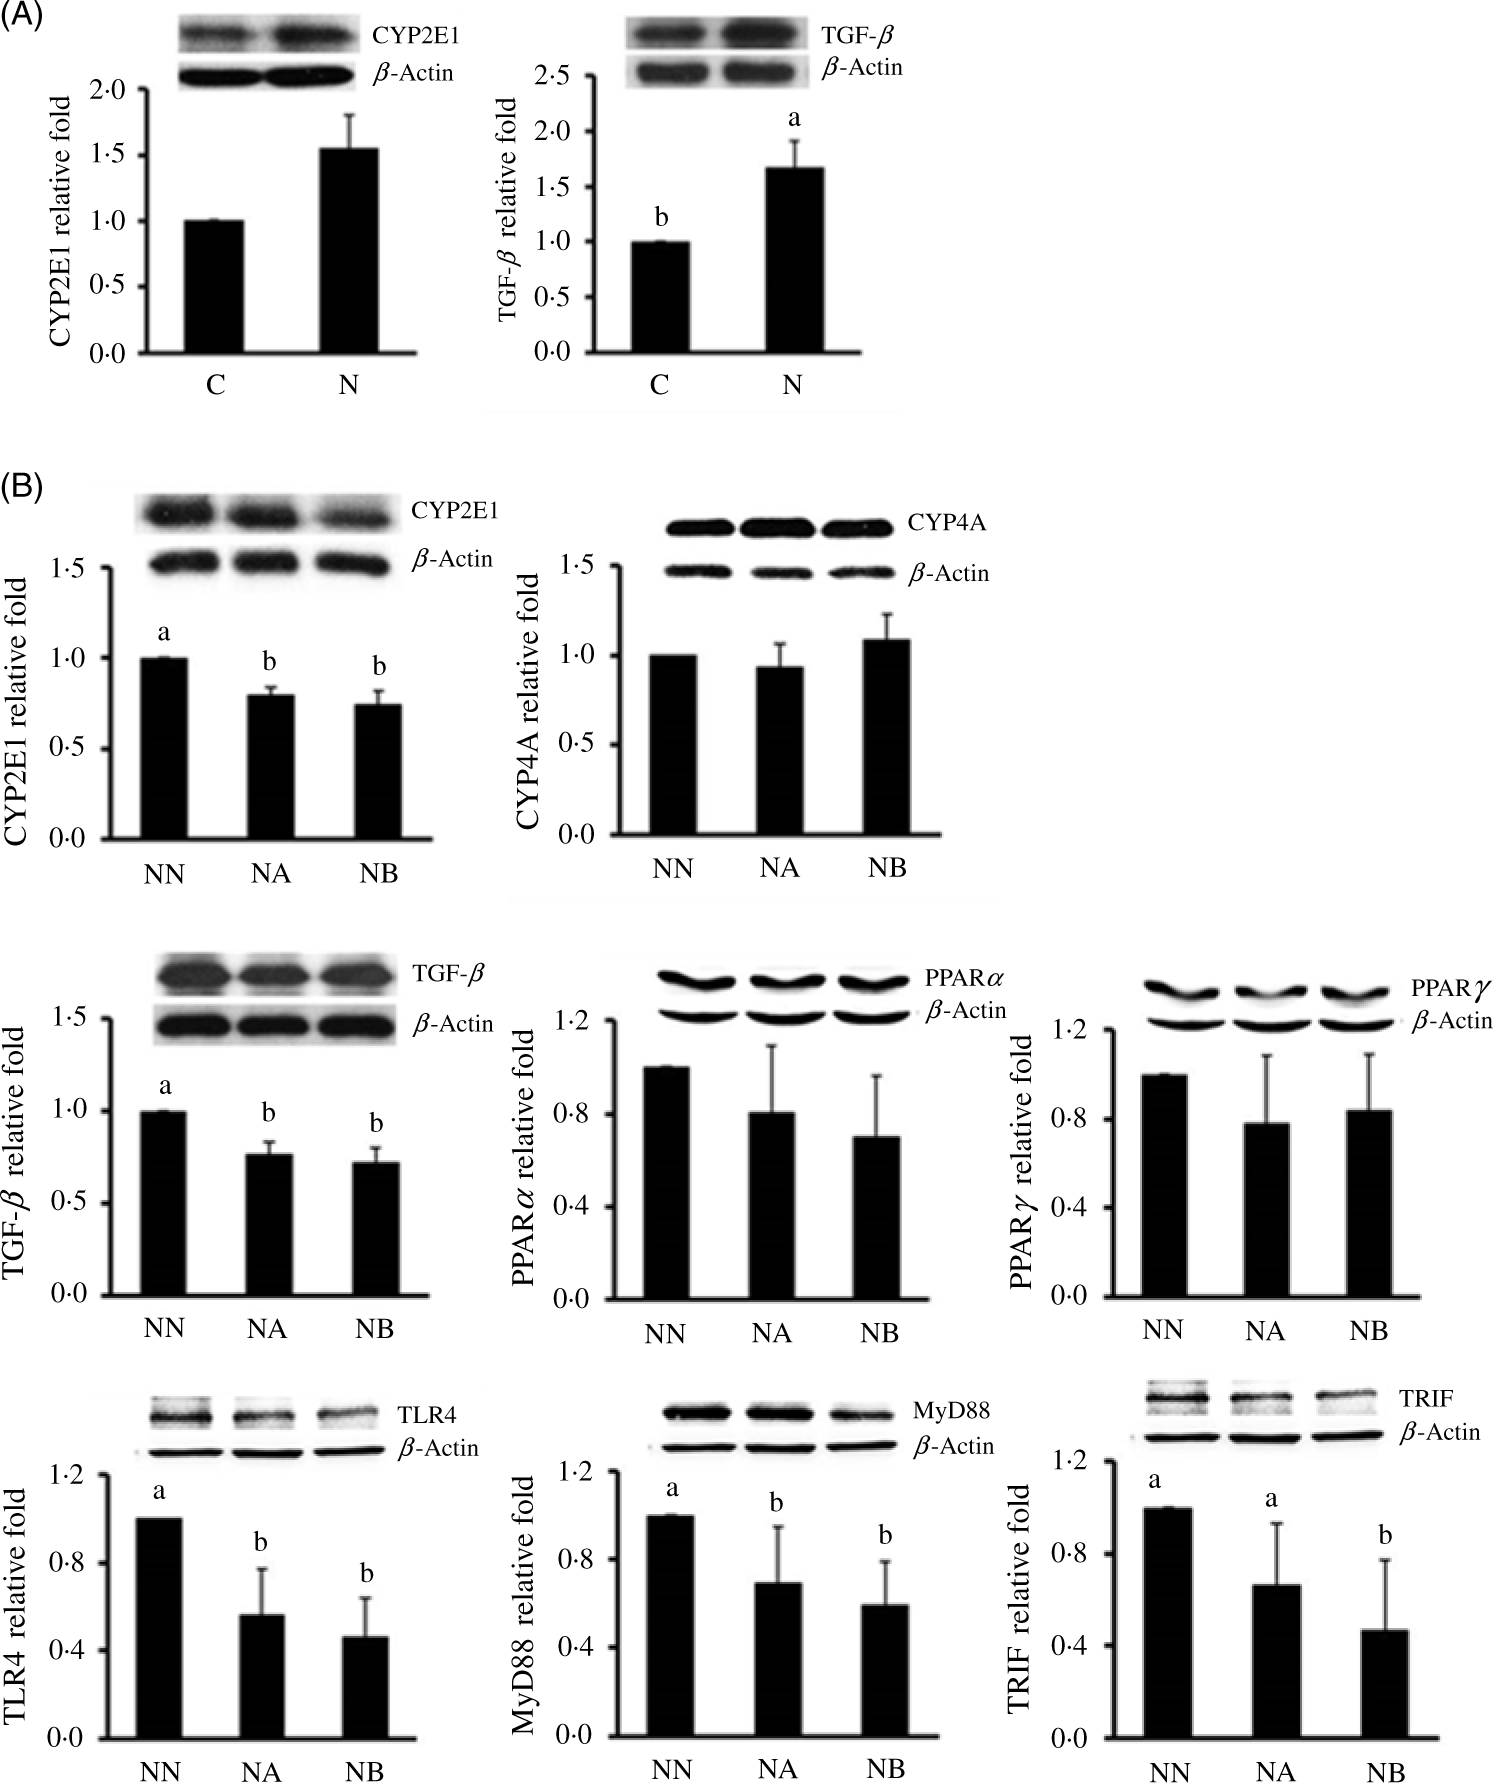
Fig. 2. Hepatic cytochrome P450 (CYP) 2E1 and transforming growth factor (TGF)-β protein expressions at the end of the non-alcoholic fatty liver disease (NAFLD)-inducing period in the control group (C) and NAFLD (N) group (A) and CYP2E1, CYP4A, TGF-β, PPARα, PPARγ, toll-like receptor 4 (TLR4), toll/IL-1 receptor domain-containing adaptor inducing interferon-β (TRIF) and myeloid differentiation primary response gene 88 (MyD88) (B) protein expressions in groups NN, NA and NB at the end of the experimental period. Values are presented as mean values with their standard errors. NN, NAFLD diet during the experimental period; NA, NAFLD diet with 4·5 g/l Camellia oleifera seed extract (CSE) during the experimental period; NB, NAFLD diet with 9·0 g/l CSE during the experimental period (n 8/group in each time point). a,b,c Values with unlike letters at the same time point are significantly different (P < 0·05).
In the adipokine analysis, the NAFLD group had significantly higher circulating leptin levels, although no difference in adiponectin levels was found between diets. In addition, the A:L ratio, recently recognised as a marker of IR(Reference Xita, Papassotiriou and Georgiou17), was also higher in the control group. Consistently, the relative AUC of glucose and insulin during 180-min oral glucose tolerance test was higher in the NAFLD group (Table 1). These results indicated that feeding rats an NAFLD-inducing diet for 16 weeks induced abnormal lipid metabolism in vivo and led to increases in abdominal and ectopic fat accumulation in the liver, IR and early-stage inflammation.
Effects of Camellia oleifera seed extract on weight change, energy intake and liver and abdominal fat levels
During the experimental period, average consumption of CSE was 308·9 (sd 29·7) mg/kg of BW for group NA and 630·1 (sd 69·6) mg/kg of BW for group NB. No difference in daily energy intake was found among groups, but group NB had significantly lower weight gain and abdominal fat and liver weights (Tables 1 and 2). Results showed that the CSE did not affect food intake of the rats, and the benefits of CSE consumption on the BW and fat accumulation were not caused by influencing the appetite.
Effects of Camellia oleifera seed extract on lipid metabolism and lipid peroxidation
Plasma total cholesterol of group NB was lower than that of group NN (Table 1), and liver cholesterol and TAG concentrations of groups NA and NB were significantly lower than those of group NN (Table 2). The liver biopsy also showed that hepatic fatty change and inflammation were obviously suppressed in CSE groups (Fig. 1). Faecal cholesterol excretion of group NB was higher than that of group NN, while no significant difference was found in faecal total lipid excretion (Table 3).
Table 3. Faecal lipid and microbiota analysis of rats at the end of the experimental period (Mean values with their standard errors)

NAFLD, non-alcoholic fatty liver disease; NN, NAFLD diet during the experimental period; NA, NAFLD diet with 4·5 g/l Camellia oleifera seed extract (CSE) during the experimental period; NB, NAFLD diet with 9·0 g/l CSE during the experimental period (n 8/group in each time point); CFU, colony-forming units.
a,b,c Mean values within a row with unlike superscript letters are significantly different (P < 0·05).
* Ratio of Bifidobacterium spp. and Lactobacillus spp. to total anaerobes.
Effects of Camellia oleifera seed extract on insulin resistance
We found that the groups NA and NB had a lower relative AUCglucose, although no significant difference was found (P = 0·1174 and 0·0542). However, we found lower fasting glucose and homeostasis model assessment-IR levels in both CSE-consuming groups. In the analysis of circulating adipokines, we also found decreased leptin and increased adiponectin and A:L ratio in dose-dependent manners (Table 2).
Effects of Camellia oleifera seed extract on liver inflammation and hepatic protein expression
We found that CSE consumption reduced plasma aspartate aminotransferase and alanine aminotransferase, and hepatic cholesterol and TAG accumulation, and group NA and NB also had lower lipid peroxidation product malondialdehyde and TNF-α concentrations. We further determined expressions of CYP2E1, CYP4A and TGF-β protein expressions in the three experimental groups. We found that hepatic CYP2E1 and TGF-β of groups NA and NB were significantly lower than those of group NN (Fig. 2). In an analysis of the faecal microbiota, we found that CSE consumption increased the anaerobe:aerobe ratio (Table 3). In addition, we also found that hepatic TLR-4, MyD88 and TRIF expressions were lower in the CSE-supplemented groups (Fig. 2).
Discussion
Rodent models used in NAFLD studies consuming diets contain fat ranging from 45 to 75 %(Reference Van Herck, Vonghia and Francque18). We induced NAFLD in rat using a high-fat liquid diet, which was reported to mimic this disease in humans and was widely used in related studies(Reference Lieber, Leo and Mak13) and then gave rats different diets for an 8-week experiment to investigate the effects of CSE on NAFLD progression. At the end of the study, we found that rats consuming CSE had lower plasma total cholesterol, hepatic lipids and abdominal fat weight. These results suggested that the CSE may ameliorate dyslipidaemia and ectopic fat accumulation in diet-induced steatosis. Although we found that the faecal cholesterol concentration was higher in the high-dose CSE group, no significant difference was found in total lipid or bile acid excretion. Therefore, the effects of CSE on lipid metabolism cannot fully be explained by a reduction in lipid absorption.
Metabolic disorders in obesity and related complications may come from pro-inflammatory responses. Adipose tissues not only store fat but also act as an endocrine source. Adipocytes produce adipokines, such as leptin and adiponectin, which have biophysiological effects and are associated with steatosis, inflammation and IR in NAFLD(Reference Polyzos, Kountouras and Mantzoros19). We found that rats had higher adiponectin and lower leptin concentrations after consuming CSE for 8 weeks. The circulating leptin level is related to the total body fat accumulation, and a meta-analysis demonstrated that subjects with NAFLD and steatosis have higher circulating leptin levels(Reference Polyzos, Aronis and Kountouras20). Leptin may also induce inflammation and fibrosis during the progression of NAFLD through regulating proinflammatory cytokines and up-regulation of the TGF-β pathway(Reference Polyzos, Kountouras and Mantzoros19); in contrast, adiponectin exhibited anti-inflammatory and anti-steatotic effects in the liver and NAFLD patients tend to have lower circulating adiponectin levels(Reference Polyzos, Toulis and Goulis21). Consistent with that, we found that the CSE produced lower hepatic TNF-α and thiobarbituric acid-reactive substance concentrations and lower TGF-β protein expression at the end of the study, and these results suggested the CSE may modulate the excretion of adipokines and retard the progression of NAFLD through regulating fat accumulation.
Recently, studies also focused on the relation between gut microbiota and chronic inflammation in vivo. The gut microbiota is an important barrier against exogenous sources of infection, and feeding mice a high-fat diet may alter the intestinal permeability(Reference Cani, Possemiers and Van de Wiele22). Many studies also found significant changes in microbiota in obese human and animal models(Reference Chakraborti23); on the other hand, probiotics and prebiotics exhibited beneficial effects in preventing and treating obesity. Bifidobacterium spp. supplementation showed antiobesity effects in rats consuming a high-fat diet(Reference An, Park and Lee24). Wheat arabinoxylan was also found to improve lipid metabolism and ameliorate inflammation and IR via altering the gut microbiota in mice with diet-induced obesity mice(Reference Neyrinck, Possemiers and Druart25). In animal models with diet-induced metabolic disorders, consumption of a high-fat diet changed gut microbes and supplementation with resveratrol modulated Bacteroidetes:Firmicutes ratios and increased gut Lactobacillus and Bifidobacterium (Reference Qiao, Sun and Xia26). One previous study also showed that dietary supplementation of CSE may modulate gut microbiota diversity(Reference Song, Wang and Lu27). In the present study, we found that the CSE also affected modulation of the gut microbiota in rats fed a high-fat liquid diet and this may been related to the beneficial effects of CSE on steatohepatitis.
Cani et al. demonstrated metabolic endotoxaemia, an elevation of plasma lipopolysaccharide in genetically obese animals and mice fed an obesogenic diet, which may lead to chronic inflammation and abnormal lipid and glucose metabolism(Reference Cani, Amar and Iglesias28). In addition, evidences showed that the total energy intake and also the percentage of energy from fat in the diet affect circulating endotoxin levels(Reference Boutagy, McMillan and Frisard29). TLR are important mediators of proinflammatory effects of microbial products, and hepatic TLR-4 senses elevation of lipopolysaccharide and free fatty acids in obese NAFLD(Reference Takeda and Akira30). Up-regulation of the TLR-4 pathway triggers the nuclear translocation of NF-κB and leads to the production of proinflammatory cytokines via MyD88-dependent process or is mediated by the TRIF(Reference Sharifnia, Antoun and Verriere31). Inhibiting the TLR-4 signalling pathway attenuates endotoxaemia-induced inflammation and liver injury in biliary-obstructed rats(Reference Oya, Yokoyama and Kokuryo32). We found that CSE down-regulated hepatic TLR4, MyD88 and TRIF expressions together with a decrease in the hepatic TNF-α level. These results suggested that the CSE may ameliorate inflammation via a TLR-4 signalling pathway. In addition, Hulston et al. demonstrated that consuming a probiotic mixture could help maintain BW and insulin sensitivity in human subjects(Reference Hulston, Churnside and Venables33). We also found improvements in the homeostasis model assessment-IR and A:L ratio in CSE groups. These findings showed that CSE may prevent a change in insulin sensitivity in NAFLD rats, but future studies are needed to clarify the effects of CSE on the gut microbiota and glucose metabolism.
In the present study, we supplemented 4·5 and 9 g/l in diet of rats with high-fat diet-induced NAFLD according to the results of our preliminary 8-week study(Reference Yang, Yeh and Ko12) and we found that 4·5 g/l can ameliorate hepatic steatosis and inflammation. This dosage was equal to 300 mg/kg per d for rats and 2·9 g/d for a 60 kg human according to the dose conversion calculation of FDA based on body surface area. A review reported that the major components of C. oleifera pomace cake include various unsaturated flavonoids, sasanquasaponins, tannin, organic acids, alkaloids and glycosides(Reference Xiao, He and Wu34). Recently, some bioactive saponins have been isolated form residual seed cake of C. oleifera and demonstrated their anti-proliferative and anti-tumour activities(Reference Zong, Peng and Bao35, Reference Wang, Hou and Cui36). However, tea seed pomace may contain numerous bioactive components, and further investigation is still needed to identify the most abundant bioactive components and clarify their physiological effects in vivo.
Conclusion
In conclusion, CSE may alleviate the progression of NAFLD in rats with diet-induced steatosis through reducing fat accumulation, improving lipid metabolism and hepatic inflammation.
Acknowledgements
This research was funded by the Ministry of Science and Technology (NSC102-2320-B-214-005, Taiwan).
The contribution of each author was as follows: W.-J. Y., W.-Y. C. and H.-Y. Y. conducted the experiments; W.-C. H. did the pathohistological analysis; W.-J. Y. and H.-Y. Y. designed the study and wrote the manuscript.
All authors stated that there were no conflicts of interest, and all authors adhered to the Committee on Publication Ethics guidelines on research and publication ethics.


