


Vitamin D, a fat-soluble vitamin, plays significant roles in maintaining the proper function of the body. This notion is supported by the fact that most of the body cell types express vitamin D receptors(Reference Wang, Zhu and DeLuca1). Moreover, several studies confirmed an inverse relationship between the risk of many diseases and vitamin D levels such as CVD(Reference Holick and Chen2,Reference Wang, Song and Manson3) . Vitamin D deficiency is a well recognised and a common global issue that is especially prevalent in women residing in the Middle East(Reference Palacios and Gonzalez4). Prevalence of vitamin D deficiency is also high in overweight and obese individuals and, consequently, may manifest more health issues in this population(Reference Yao, Zhu and He5). Vitamin D deficiency and high levels of homocysteine (Hcy) are considered independent risk factors for CVD(Reference Wang, Song and Manson3,Reference Faridi, Lupton and Martin6) . Although several studies have confirmed this association, other studies have conflicting results that do not support the role of Hcy as a cause for CVD(Reference Ntaios, Savopoulos and Grekas7). Thus, more research is needed to elucidate the relationship between Hcy and CVD. Recently, it has been reported that improving the 25-hydroxyvitamin D (25(OH)D) levels of overweight women may help in decreasing total Hcy (tHcy) serum levels and reducing their BMI, waist:hip ratio and body fat mass, in turn lowering the risk of CVD(Reference Al-Bayyari, Al-Zeidaneen and Hailat8,Reference Al-Bayyari, Hamadneh and Hailat9) . An inverse relationship was also found between levels of vitamin D and C-reactive protein (CRP), which can be partly explained by vitamin D modulation effect on inflammation and its inhibitory effect on CRP stimulation(Reference Liefaard, Ligthart and Vitezova10–Reference Chen, Wan and Han12). In conjunction with the presence of other CVDs biomarkers, CRP is predictive of CVD risk(Reference Musunuru, Kral and Blumenthal13). Findings from these studies suggest that vitamin D may elicit a protective role against CVD(Reference Al-Bayyari, Al-Zeidaneen and Hailat8,Reference Al-Bayyari, Hamadneh and Hailat9) . Vitamin D deficiency is also prevalent among chronic liver and kidney disease patients(Reference Malham, Jørgensen and Ott14–Reference Holick17). It is not clearly defined whether the reduced liver function contributes to vitamin D deficiency or if vitamin D deficiency leads to liver dysfunction; however, previous studies found an inverse association between the 25(OH)D levels and the incidence of liver disease and liver enzymes(Reference Skaaby, Husemoen and Borglykke18,Reference Bahreynian, Qorbani and Motlagh19) .
Elevated plasma Hcy levels are prevalent in chronic kidney disease patients, and it has been found that a lower glomerular filtration rate (GFR) is associated with elevated plasma tHcy concentration(Reference Francis, Eggers and Hostetter20,Reference Sabanayagam and Shankar21) . These results provide considerable evidence that hyperhomocysteinaemia is involved in the progression of chronic kidney disease(Reference Zhang, Xia and Boini22). Despite this evidence, the impact of vitamin D status on tHcy and liver and kidney function tests has received little attention. Thus, in our study we hypothesised that improving the measurements of the primary outcome of 25(OH)D will lower the measurements of the secondary outcome of tHcy. In turn, this will lower the CRP levels and improve the liver and kidney function tests – particularly the aspartate aminotransferase (AST), alanine aminotransferase (ALT), urea and creatinine levels. Therefore, the present study was designed to examine the effect of 1250 µg of vitamin D3 per week for 2 months on serum tHcy and CRP levels and liver and kidney function tests of overweight, reproductive age women.
Methods
Study design and subjects
The study design was a randomised, double-blind, placebo-controlled clinical trial conducted on Jordanian women aged between 18 and 49 years who attended the Obstetrics and Gynecology clinic for routine check-ups at King Abdullah University Hospital (KAUH). The participants were enrolled in the study in the winter, when the intensity of the UV light is lowest, between December 2017 and February 2018. All participants were randomly selected according to the patient computerised order numbers and patients with odd order numbers were selected to participate in the study.
This study was registered at ClinicalTrials.gov, no. NCT03310307, was approved by the Institutional Research Board (IRB) Committee of KAUH and complied with the Helsinki Declaration as revised in 1983. Also, written and signed informed consent was obtained from each woman participating in the study.
Procedures
Sample size determination
The Snedecor & Cochran(Reference Snedecor, Cochran, Snedecor and Cochran23) equation was used to determine the required sample size as the following:
 $$n \,=\, 2 \times {({Z_\alpha } + {Z_\beta })^2} \times {\rm{S}}{{\rm{D}}^2}/{\delta ^2},$$
where n represents the number of participants in placebo and treatment groups, Z α and Z β are the standard normal distribution values at 95 % level of confidence, where a two-sided α of 0·05 = 1·96 and a power of 80 %, Z 0·20 = 0·84. The sd is the pooled standard deviation, and δ is the estimated difference between the placebo and treatment groups.
 $$n \,=\, 2 \times {(1\!\cdot \!96 + 0\!\cdot \!84)^2} \times {{\rm{(2}} \!\cdot \!{\rm{4)}}^2}{\rm{/(1}} \!\cdot \!{\rm{5}}{{\rm{)}}^2} \approx {\rm{ 40}}\,{\rm{participants}}\,{\rm{per}}\,{\rm{group}}{\rm{.}}$$
Accordingly, to detect a change of 1·5 µmol/l in the total Hcy concentration between the placebo and treatment groups with 5 % significance and 80 % power, the calculated sample size was approximately forty subjects. The sd was expected to be 2·4(Reference Pham, Ekwaru and Mastroeni24).
To consider the dropout of study participants and to increase the power of the analysis, the number of participants was increased to sixty women per group.
Inclusion and exclusion criteria
All participants’ body weight in kilograms and height in metres were measured to the nearest digital point by the trained research assistant to calculate the women BMI. Overweight women who: had a BMI between 25 and 29·9 kg/m2; had a 25(OH)D level < 20 ng/ml; had normal vitamin B12 and folic acid levels; were free from any chronic diseases and agreed to participate were included. Women who were pregnant or lactating; aged < 18 or > 49 years; had a BMI > 30 kg/m2 or < 25 kg/m2; had 25(OH)D levels > 20 ng/ml; had abnormal vitamin B12 or folic acid levels or had any chronic disease were excluded. A total of 479 women were assessed for eligibility; out of them, only 325 women were eligible to participate in the study. Of the total qualified women, 120 were randomly selected to participate in the clinical trial. During the study period, twenty patients dropped out and two patients with outlier tHcy concentrations were excluded from the study. Consequently, ninety-eight women were included in the study’s statistical analysis. The selection of subjects included in the study analysis is illustrated in Fig. 1.

Fig. 1. CONSORT (CONsolidated Standards of Reporting Trials) 2010 flow diagram: selection of the study subjects.
Vitamin D3 allocation
Computer generated random numbers in SPSS was used for the random allocation of the 120 study subjects to either treatment or placebo groups. To ensure the double-blindness in the randomisation for treatment or placebo, the resident doctor at the clinic was responsible for this step. According to the physician’s order, pharmaceutical product recommendations and previous clinical trials commonly applied strategy(Reference Kennel, Drake and Hurley25), the treatment group (n 60) was supplemented with 1250 µg of vitamin D3 per week for 2 months; meanwhile, the placebo group (n 60) received placebo capsules that were manufactured to be like the vitamin D3 capsules in shape, colour, size and packaging. The study subjects received four capsules of 1250 µg of vitamin D3 or placebo in one bottle every month. In addition, the subjects were asked to bring back the bottle to the following visit to ensure compliance. Furthermore, to check for adherence, the study subjects were followed up weekly via telephone calls, and the trial was terminated for subjects who reported any side effects.
Blood samples were obtained at the beginning of the study (basal) and after the 1st and the 2nd month of taking the vitamin D3 or placebo to monitor for changes in serum Hcy, 25(OH)D, CRP, AST, ALT, urea and creatinine levels over the intervention period.
Measures
Assessment of total homocysteine, estimated glomerular filtration rate and other biochemical parameters
A morning venous blood sample (approximately 10 ml) after at least 8–12 h of overnight fasting was drawn from each participating woman (n 120) by a registered laboratory technician at KAUH using 10 ml Vacutainer (VACUETTE) plain tubes containing clot activator (Z-serum clot activator). Eppendorf Centrifuge 5810 R was used for centrifugation of collected blood samples at 4000 rpm and 23°C for 5 min after they were stored at room temperature for 30 min. The obtained serum from each blood sample was labelled and stored in Eppendorf tubes at −70°C until analysed. Liquid chromatography tandem mass spectrophotometry Complete kit (ClinMass®/MS2000) was used to analyse serum tHcy levels; to increase the accuracy of the results, each sample was replicated. The calculated average concentration of the two tHcy levels for each subject was used in the statistical analysis. According to Herrmann & Obeid(Reference Herrmann, Obeid and Thomas26), the scientific literature used by the complete kit manufacturer (ClinMass®/MS2000), Hcy concentrations less than or equal to 10 µmol/l were considered normal, and those above 10 µmol/l were considered abnormal and indicated hyperhomocysteinaemia.
Serum was used to determine the qualitative CRP; liver enzymes, including ALT and AST and kidney function tests, including urea, creatinine and 25(OH)D levels. A chemistry automated analyzer (AU 480; Beckman Coulter) assessed the CRP, AST, ALT, urea and creatinine, while the endocrine automated analyzer (Access 2 Immunoassay System; Beckman Coulter) assessed the 25(OH)D levels.
The estimated eGFR was calculated by using the Cockcroft–Gault formula(Reference Ockcroft and Gault27) for females as follows:
 $$(140 \times {\rm{age}}\,({\rm{years}})) \times ({\rm{body}}\,{\rm{weight}}\,({\rm{kg}}))/(0 \!\cdot \!85 \times {\rm{plasma}}\,{\rm{creatinine}}\,({\rm{Umol}}/1)).$$
This formula was recommended by Al-Khader & Tamim(Reference Al-Khader and Tamim28) as the most appropriate formula to use in estimating GFR in adult Arabs without kidney disease.
Statistical analyses
This is a post hoc analysis of an already published study where the SPSS statistical package (SPSS version 22, 2013; IBM) was used for data entry and analysis. Means and sem were used to describe continuous variables. All continuous variables were examined for normal distribution using the nonparametric Kolmogorov–Smirnov test. After excluding the outliers in tHcy levels (n 2) due to mutation in methyl-tetrahydrofolate reductase gene, the subjects’ tHcy concentrations were classified into ≤ 10 µmol/l (n 11) and > 10 µmol/l (n 87), and the differences between the means of the normally distributed biochemical measurements were tested using Student’s t test for independent samples. Also, this test was used to examine the difference between the biochemical means of the vitamin D and placebo groups at basal and after the 1st and the 2nd months of vitamin D or placebo treatment. Differences between the normally distributed biochemical means before and after intervention among vitamin D and placebo groups were evaluated using the paired-sample t test and ANCOVA after adjustments for baseline values. For the independent samples, when variables followed a significantly skewed distribution, medians were compared using the Mann–Whitney U test. For paired samples, the Wilcoxon signed rank test was used. P values ≤ 0·05 were considered statistically significant.
Results
Characteristics of the study subjects
Table 1 shows the descriptive statistics of the ninety-eight subjects enrolled in the study which revealed that the mean age, weight, height and BMI were 23·5 (sem 0·48) years, 67·8 (sem 1·03) kg, 157·9 (sem 0·80) cm and 27·1 (sem 0·18) kg/m2, respectively. The mean concentration of tHcy was 18·4 (sem 0·96) µmol/l. The maximum 25(OH)D level was 9·7 ng/ml, the minimum level was 6·4 ng/ml and the mean was 8·5 (sem 0·15) ng/ml. Among the study group, the prevalence of hyperhomocysteinaemia (tHcy level > 10 µmol/l) was 88·8 %. The participants’ maximum level of CRP was 21·8 mg/l while the maximum levels of ALT and AST were 41·9 U/l and 31·2 mlU/ml, respectively. The mean value of urea was 3·2 (sem) 0·09 mmol/l and for creatinine and eGFR were 49·6 (sem 0·73) μmol/l, 183·3 (sem 4·6) ml/min, respectively.
Table 1. Descriptive statistics of age and biochemical parameters of the study subjects (n 98)*
(Mean values with their standard errors; minimum and maximum values)
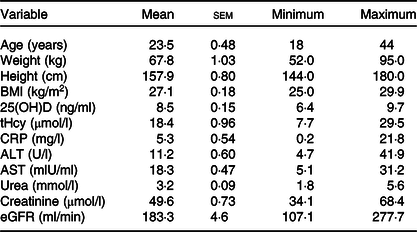
25(OH)D, 25-hydroxyvitamin D; tHcy, total homocysteine; CRP, C-reactive protein; ALT, alanine aminotransferases; AST, aspartate aminotransferases; eGFR, estimated glomerular filtration rate.
* Describing age and biochemical parameters of the ninety-eight study subjects using descriptive statistics for continuous variables.
Differences between total homocysteine and biochemical parameters
The mean comparisons of age and biochemical results including 25(OH)D, CRP, ALT, AST, urea, creatinine and eGFR per tHcy level using the independent-sample t test showed that there was a statistically significant (P < 0·05) decrease in the mean values of 25(OH)D and ALT levels as well as there were statistical increases in CRP, AST, urea and creatine and a statistical decrease in the mean value of eGFR among the tHcy group > 10 µmol/l (Table 2).
Table 2. Age and baseline biochemical parameters of the study subjects according to homocysteine concentration (n 98)†
(Mean values with their standard errors)

25(OH)D, 25-hydroxyvitamin D; CRP, C-reactive protein; ALT, alanine aminotransferases; AST, aspartate aminotransferases; eGFR, estimated glomerular filtration rate.
* P value ≤ 0·05 is statistically significant.
† Means and standard errors of the means of all study subjects (n 98) for age and biochemical parameters were compared using the independent-samples t test for normally distributed continuous variables according to total homocysteine concentrations. Medians were compared using the Mann–Whitney U test for independent samples when variables followed a significantly skewed distribution.
The changes in the means of Hcy concentrations, 25(OH)D levels, and liver and kidney function biochemical parameters for the placebo and vitamin D groups over the time of intervention showed that there were no statistically significant differences between the basal means of tHcy (P = 0·61), CRP (P = 0·07), ALT (P = 0·22), AST (P = 0·78), urea (P = 0·17), creatinine (P = 0·18), eGFR (P = 0·19) and 25(OH)D (P = 0·54) results of placebo and vitamin D groups. On the other hand, there were statistically significant (P < 0·001) differences in the means of tHcy, urea, creatinine and 25(OH)D levels after the 1st and the 2nd month of intervention between the placebo and vitamin D groups. In addition, a significant (P < 0·05) difference was found between the means of AST levels of placebo and vitamin D groups after the second month of intervention, while no statistically significant differences were noticed between both groups over time regarding the CRP (P = 0·15), ALT (P = 0·09) and eGFR (P = 0·31) levels (Table 3).
Table 3. Changes in the concentrations of biochemical parameters for the placebo and treatment groups over the time of intervention†
(Mean values with their standard errors)
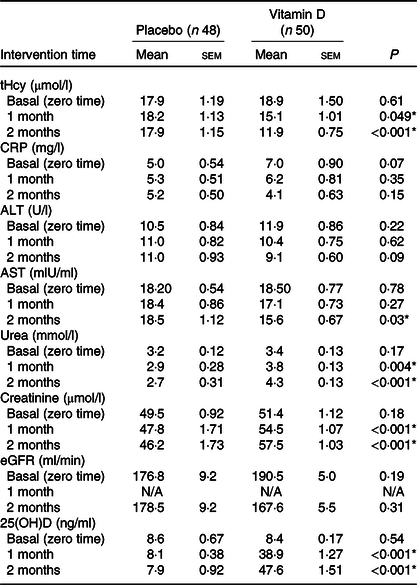
tHcy, total homocysteine; CRP, C-reactive protein; ALT, alanine aminotransferases; AST, aspartate aminotransferases; eGFR, estimated glomerular filtration rate; 25(OH)D, 25-hydroxyvitamin D.
* P value ≤ 0·05 is statistically significant.
† Means and standard errors of the means of tHcy, CRP, AST, ALT, urea, creatinine, eGFR and 25(OH)D concentrations among the placebo (n 48) and vitamin D (n 50) groups at baseline and after the first and second months of intervention were compared using the independent-samples t test.
Mean comparisons among vitamin D and placebo groups
Table 4 shows the mean comparisons of the biochemical parameters before and after intervention among the placebo and vitamin D groups. There were no statistically significant (P > 0·05) differences found in any of the biochemical mean values before and after placebo intervention. However, in the vitamin D group, there were statistically significant (P < 0·001) decreases in the mean values of tHcy, CRP, ALT, AST and eGFR levels after treatment with vitamin D3. There were also statistically significant (P < 0·001) increases in 25(OH)D, urea and creatinine levels after treatment.
Table 4. Mean comparisons of biochemical parameters before and after intervention among placebo and treatment groups†
(Mean values with their standard errors)

25(OH)D, 25-hydroxyvitamin D; tHcy, total homocysteine; CRP, C-reactive protein; ALT, alanine aminotransferases; AST, aspartate aminotransferases; eGFR, estimated glomerular filtration rate.
* P value ≤ 0·05 is statistically significant.
† Means and standard errors of the means of 25(OH)D, tHcy, CRP, ALT, AST, urea and creatinine concentrations and eGFR were compared before and after intervention among placebo (n 48) and vitamin D groups (n 50) using the paired-sample t test for normally distributed continuous variables. Medians were compared using the Wilcoxon signed rank test for independent samples when variables followed a significantly skewed distribution.
Discussion
In the present study, serum Hcy levels were assessed among overweight and reproductive-age women. Hcy is a sulphur containing α-amino acid that plays an important role in methionine and folate metabolism(Reference Al-Bayyari, Hamadneh and Hailat9). Elevated blood levels of Hcy (>15 μmol/l)), known as hyperhomocysteinaemia(Reference Ye, Wang and Zhang29), have been studied by Faridi et al. (Reference Faridi, Lupton and Martin6) who found that elevation of Hcy is related to decreased vitamin D concentrations. Furthermore, Al-Bayyari et al. (Reference Al-Bayyari, Hamadneh and Hailat9) also found an inverse relationship between vitamin D and Hcy level as vitamin D availability helps in the expression of Hcy metabolic enzymes. It has been shown that vitamin D activates the cystathionine β-synthase gene, which potentially aids in the metabolism of Hcy(Reference Amer and Qayyum30). Our data suggest an inverse association between 25(OH)D supplementation and the serum CRP and tHcy concentrations; however, results do not provide evidence for a causal association. In many studies, vitamin D deficiency (<20 ng/ml) has been shown to be associated with inflammation processes(Reference Liefaard, Ligthart and Vitezova10–Reference Chen, Wan and Han12). Others indicated that vitamin D reduces oxidative damage(Reference Cagirci, Kucukseymen and Yuksel31).
Vitamin D positively modulates the intracellular nuclear-related factor (Nrf2), which is inversely associated with mitochondrial reactive oxygen species accumulation. Consequently, it plays a key role in protecting the cells from reactive oxygen species(Reference Petersen and Smith32,Reference Nakai, Fujii and Kono33) . It also maintains the normal mitochondrial functions by supporting cellular oxidation and reduction control(Reference Ryan, Craig and Folmes34). Moreover, the intracellular calcitriol concentrations activate the mitochondrial interaction of the Nrf2 with PPAR-coactivator 1α (PGC-1α), which directly couples the oxidative stress cycle(Reference Chen, Zhang and Lin35) and bound with the mitochondrial deacetylase (SIRT3)(Reference Song, Fu and Zhang36). Vitamin D also regulates reactive oxygen species levels through upregulating the expression of certain antioxidants and anti-inflammatory cytokines(Reference Wei and Christakos37) as well as it regulates the proteolytic enzymes such as cystein proteinases and serine proteinases(Reference Koli and Keski-Oja38). Therefore, vitamin D is a potent antioxidant that encourages balanced mitochondrial activities, preventing oxidative stress-related protein oxidation, lipid peroxidation and DNA damage(Reference Wimalawansa39).
There are several mechanisms in which vitamin D can affect the immune system that could explain the reported association with CRP. Vitamin D can inhibit the production of inflammatory biomarkers, such as IL-6, by monocytes, which is the primary stimulant of CRP production in the liver(Reference Liefaard, Ligthart and Vitezova10). Moreover, it has been noted that lower levels of 25(OH)D have been associated with increased CRP and Hcy levels as both known as independent risk factors for CVD(Reference Amer and Qayyum30). A recent study examined the effect of vitamin D supplementation for 12 weeks along with Nordic walking training among elderly women and found that vitamin D along with training helps in reducing the concentrations of CRP and Hcy(Reference Walentukiewicz, Lysak-Radomska and Jaworska40). The results of the present study agreed with our findings, although their study conducted on elderly women and they combined vitamin D supplementation with walking training.
Recently, studies have shown a correlation between Hcy and chronic liver diseases associated with elevated levels of ALT. Liver enzymes tend to be found in higher amounts which is a symptom of liver problems, such as non-alcoholic fatty liver disease(Reference Ha, Hwang and Rim41,Reference Dai, Wang and Tang42) . For instance, Ha et al.(Reference Ha, Hwang and Rim41) reported that ALT levels were significantly higher in non-alcohol fatty liver disease patients who suffered from elevated Hcy and vitamin D deficiency. Furthermore, Dai et al.(Reference Dai, Wang and Tang42) conducted a cross-sectional study in China and discussed how higher Hcy levels increased the severity and prevalence of liver diseases as ALT, AST and CRP concentrations increased(Reference Dai, Wang and Tang42). Similarly, our results showed that increased serum levels of Hcy were associated with higher concentrations of CRP, ALT and AST liver enzymes. Moreover, it has been reported that not only CRP, ALT and AST increased as Hcy levels increased but also the levels of urea and creatinine also increased among non-alcohol fatty liver disease patients(Reference Dai, Wang and Tang42). Another study reported that vitamin D deficiency is associated with increased uric acid, creatinine and Hcy(Reference Faridi, Lupton and Martin6). In 2018, Bahreynian et al.(Reference Bahreynian, Qorbani and Motlagh19) reported that 75 % of vitamin D-deficient participants had elevated ALT levels, and 83·3 % of the male participants had AST elevations while 65 % of the females had vitamin D deficiency. In our study, the levels of AST and ALT were decreased after vitamin D intervention which could be possibly explained by the reduction in the amount of fat accumulated on the liver, which is concluded through the significant decrease in the participants’ body weight, BMI, waist circumference and waist:hip ratio, as indicated in our previously published results on the same participants(Reference Al-Bayyari, Al-Zeidaneen and Hailat8). Consequently, providing patients with vitamin D supplementation has aided in the process of decreasing Hcy concentration, which lead to a decrease in the risk of developing diseases associated with this elevation. This finding agreed with previous studies that reported a significant decrease in serum tHcy levels after supplementation with activated vitamin D(Reference Al-Bayyari, Al-Zeidaneen and Hailat8,Reference Walentukiewicz, Lysak-Radomska and Jaworska40) . This has benefited individuals who had a vitamin D concentration of < 21 ng/ml and has decreased their risk of developing cardiovascular or liver diseases by decreasing levels of ALT, AST, creatinine and urea(Reference Amer and Qayyum30,Reference Dai, Wang and Tang42) . More recently, a study revealed that providing activated vitamin D in treatment dose of 1250 µg for 2 months decreased concentrations of Hcy, further decreasing the risk of developing CVD or any other Hcy-related diseases(Reference Al-Bayyari, Al-Zeidaneen and Hailat8).
In this study, we noticed that the eGFR was lower among subjects having elevated tHcy (>10 µmol/l) concentrations. Our results agreed with previous studies, which has been found that lower GFR is associated with elevated plasma tHcy concentration(Reference Francis, Eggers and Hostetter20,Reference Sabanayagam and Shankar21) . These findings improve that hyperhomocysteinaemia is implicated in the progression of chronic kidney disease(Reference Zhang, Xia and Boini22). Moreover, the findings of the present study showed a significant difference in serum urea, creatinine and eGFR levels between placebo and vitamin D group. Higher levels of urea and creatinine and lower levels of eGFR were reported after the first and the second month of vitamin D supplementation; however, both groups had their eGFR (>90 ml/min) and serum concentrations of urea and creatinine within the normal range of 0·6–1·1 mg/dl (53–97·2 µmol/l) for women according to the National Institutes of Health in USA, which indicate healthy kidney functions(43). These findings agreed with Teumer et al. (Reference Teumer, Gambaro and Corre44) in 2018 in their Mendelian randomisation study which reported a negative effect of vitamin D on kidney function. Nevertheless, other studies showed positive significant associations of vitamin D levels with kidney function such as the elevation in albuminuria:creatinine ratio and the reduction in eGFR(Reference Damasiewicz, Magliano and Daly45–Reference Keyzer, Lambers-Heerspink and Joosten47). Therefore, the reduction of eGFR observed could be possibly explained by the influence of vitamin D receptor activation on increasing the creatinine generation and, consequently, increasing the serum creatinine(Reference Agarwal, Hynson and Hecht48). Unfortunately, albuminuria:creatinine ratio and dietary protein intake were not assessed in our study.
Wollesen et al. (Reference Wollesen, Brattstrom and Refsum49) reported that patients with normo-albuminuria, low creatinine clearance were associated with increased tHcy levels because the GFR was an independent determinant of both, the plasma tHcy and the limiting rate for the renal clearance of Hcy in diabetic patients. It is possible that the elevation of Hcy levels in patients with low creatinine clearance might lead to endothelial dysfunction and thus to microalbuminuria in some susceptible patients(Reference Davies, Wilmshurst and Mcelduff50). The present study does not permit us to determine whether this association is true among our participants.
To the best of the authors’ knowledge, this study is the first of its kind in Jordan or the Middle East to examine the effects of vitamin D3 intervention (1250 µg) on serum tHcy concentration, CRP and the liver and kidney function tests in a group of overweight, reproductive-age women. Some limitations of this study include the small sample size, which prevents our findings from being generalised to the whole population, lack of daily dietary protein intake assessment and the absence the analysis of biological values of interest. To generalise the trial findings, a nationally representative study with a large sample size on male and female subjects with different BMI is highly recommended.
Conclusion
Vitamin D3 intervention at the treatment dose of 1250 µg/week for at least 2 months decreased Hcy and CRP levels, which may be expected to help in preventing or minimising the risk of CVD among overweight women of reproductive age. It also decreased AST and ALT liver enzymes, which may promote liver function, but it increased the serum creatinine, urea and eGFR levels which might negatively affect kidney function.
Acknowledgements
The authors would like to thank the obstetrician and gynaecologist at KAUH, all the study participants, and the laboratory technicians at JUST diagnostic laboratory.
This work was financially supported by the Deanship of Scientific Research at the Jordan University of Science and Technology (JUST) Irbid, Jordan (grant nos. 20140285 and 20180381).
N. A.-B. conceived and designed the study, supervised the research and wrote the manuscript. R. H. conducted the analysis and interpretation of the data. H. S. assisted in data collection and facilitated the distribution of the treatments and placebos. H. A.-K supervised the data collection, entry and helped in writing the manuscript. A. E. carried out critical revision of the manuscript.
There are no conflicts of interest.


