


Introduction
Habitat loss and fragmentation are major threats to biodiversity, as they affect species’ ability to disperse and can lead to local extinctions (Fischer & Lindenmayer, Reference Fischer and Lindenmayer2007). Top predators, such as large felids, are vulnerable to habitat loss and fragmentation because they require extensive areas to range, and an abundance of large prey (Ripple et al., Reference Ripple, Estes, Beschta, Wilmers, Ritchie and Hebblewhite2014). Establishing protected areas and maintaining connectivity between them are valuable approaches to conserve populations of large carnivores in the long term (Taylor et al., Reference Taylor, Fahrig, Henein and Merriam1993; Ripple et al., Reference Ripple, Estes, Beschta, Wilmers, Ritchie and Hebblewhite2014). Conservationists and natural resource managers often define conservation areas on the basis of large felids because these species are vulnerable to threats, require large spaces and play important roles as umbrella species and top predators (Grigione et al., Reference Grigione, Menke, López-González, List, Banda and Carrera2009).
The jaguar Panthera onca once had a broad distribution, from the southern USA to Patagonia, but it now occupies only 51% of its historical range (Quigley et al., Reference Quigley, Foster, Petracca, Payan, Salom and Harmsen2017). It has large home ranges, with habitats characterized by the presence of water bodies and sufficient prey, and it prefers natural areas with low anthropogenic disturbance (Vynne et al., Reference Vynne, Keim, Machado, Marinho-Filho, Silveira, Groom and Wasser2011; Cullen et al., Reference Cullen, Sana, Lima, de Abreu and Uezu2013). These characteristics make it an excellent model species for identifying priority areas for conservation at a landscape scale (Hatten et al., Reference Hatten, Averill-Murray and van Pelt2005; Grigione et al., Reference Grigione, Menke, López-González, List, Banda and Carrera2009; Rodríguez-Soto et al., Reference Rodríguez-Soto, Monroy-Vilchis, Maiorano, Boitani, Faller and Briones2011; Morato et al., Reference Morato, Ferraz, Paula and Campos2014).
The jaguar is categorized as Near Threatened on the IUCN Red List (Quigley et al., Reference Quigley, Foster, Petracca, Payan, Salom and Harmsen2017) but in Brazil, where some populations face significant threats, the species is categorized as Vulnerable (Morato et al., Reference Morato, Beisiegel, Ramalho, Campos, Boulhosa, Beisiegel, Morato, Paula and Morato2013). Jaguars are particularly threatened in the Cerrado biome, with an estimated population decline of > 50% since 1987 (Moraes, Reference Moraes2012; Morato et al., Reference Morato, Beisiegel, Ramalho, Campos, Boulhosa, Beisiegel, Morato, Paula and Morato2013). The major threats to jaguars in the Cerrado are habitat loss, resulting from high rates of conversion of natural vegetation for pastures and agriculture, prey depletion, and hunting (Moraes, Reference Moraes2012; Morato et al., Reference Morato, Beisiegel, Ramalho, Campos, Boulhosa, Beisiegel, Morato, Paula and Morato2013; Strassburg et al., Reference Strassburg, Brooks, Feltran-Barbieri, Iribarrem, Crouzeilles and Loyola2017). The Cerrado has already lost 46% of its native vegetation (Strassburg et al., Reference Strassburg, Brooks, Feltran-Barbieri, Iribarrem, Crouzeilles and Loyola2017) but < 3% of its area is protected against land-cover change (MMA, 2016). This situation threatens the survival not only of the jaguar population but also the c. 4,800 plant and vertebrate species of the biome, many of which are endemic to this biodiversity hotspot (Strassburg et al., Reference Strassburg, Brooks, Feltran-Barbieri, Iribarrem, Crouzeilles and Loyola2017).
Several studies have proposed jaguar conservation units, identifying important areas for jaguars across their geographical range (Sanderson et al., Reference Sanderson, Redford, Chetkiewicz, Medellin, Rabinowitz, Robinson and Taber2002; Rabinowitz & Zeller, Reference Rabinowitz and Zeller2010; Nijhawan, Reference Nijhawan2012). Jaguar conservation units are defined as areas with a stable prey community that could either maintain a resident jaguar population (a minimum of 50 breeding individuals) or contain fewer individuals but with adequate habitat, where the population could increase if threats were reduced (Sanderson et al., Reference Sanderson, Redford, Chetkiewicz, Medellin, Rabinowitz, Robinson and Taber2002).
Species distribution models have been used to identify areas of high conservation value for large felid species, including the selection of areas suitable for jaguars (Rodríguez-Soto et al., Reference Rodríguez-Soto, Monroy-Vilchis, Maiorano, Boitani, Faller and Briones2011; Morato et al., Reference Morato, Ferraz, Paula and Campos2014; Angelieri et al., Reference Angelieri, Adams-Hosking, Ferraz, de Souza and McAlpine2016; Paviolo et al., Reference Paviolo, De Angelo, Ferraz, Morato, Pardo and Srbek-Araujo2016). They combine information about the geographical occurrence of species and environmental covariates, and can be used to generate maps that show the habitat suitability for the species (Phillips et al., Reference Phillips, Anderson and Schapire2006).
We used species distribution models and other analytical tools to evaluate environmental conditions for jaguar conservation in the Brazilian Cerrado. We aimed to (1) assess the current distribution of jaguars in the biome at a fine resolution, according to environmental and anthropogenic conditions, (2) identify and prioritize potential jaguar conservation units, and (3) review proposed management actions in the priority jaguar conservation units. Compared to previous studies, we expected to expand the potentially suitable area for jaguars in the Cerrado, and thus enhance conservation efforts to save the species in this hotspot.
Study area
The Cerrado (Fig. 1) comprises 2,039,373 km2 of savannah and various types of grasslands and shrublands, as well as tropical, semi-deciduous and deciduous forests (Coutinho, Reference Klein2000). The climate is seasonal, with rainy summers and dry winters. The mean annual temperature is 22–23 °C and the mean annual rainfall is 1,200–1,800 mm (Coutinho, Reference Klein2000). The Cerrado has a low human population density and a mean human development index (UNDP, 2018) of 0.71 in the principal municipalities. Agriculture and cattle ranching are the main sources of livelihood (Mueller & Martha, Reference Mueller and Martha2008).
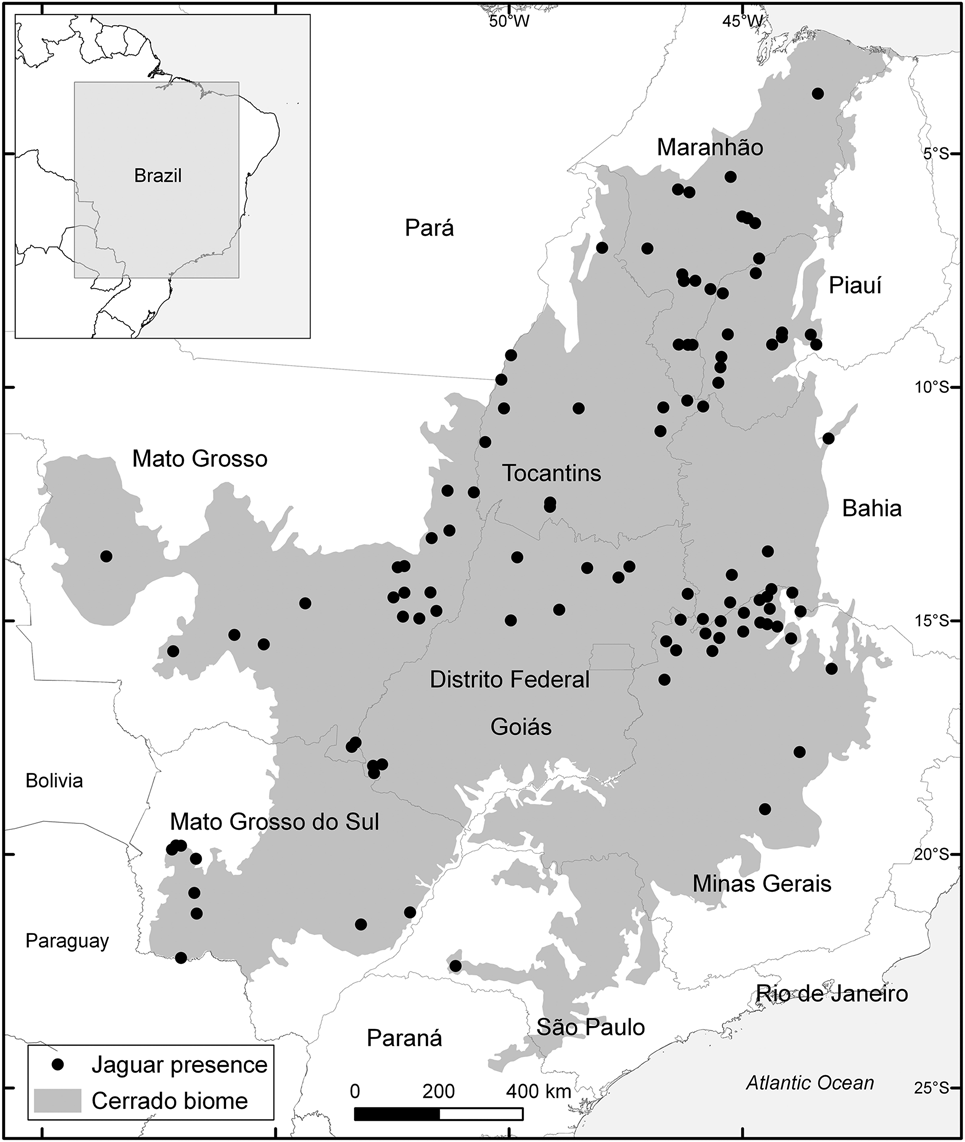
Fig. 1 Locations of 106 jaguar Panthera onca presence records in the Cerrado of Brazil, used to model the habitat suitability for the species.
Methods
The methods and workflow used to define jaguar conservation units are outlined in Fig. 2.

Fig. 2 Methods and workflow used to define jaguar conservation units (JCUs) using species distribution modelling (SDM).
Presence records
The Brazilian National Predator Research Center (Desbiez et al., Reference Desbiez, Beisiegel, Campos, Sana, Moraes and Ramalho2013) provided 126 presence records of jaguars (sightings, captured individuals, confirmed tracks, and faeces; Fig. 1, Supplementary Table 1). These records, which include geographical coordinates, were obtained by jaguar specialists in the course of field studies in the Cerrado during 2000–2009. To reduce spatial autocorrelation we firstly rarefied presence records of jaguars within a distance of 9 km, which corresponds to the approximate radius of the jaguar's home range (265 km2) in the Cerrado (Astete et al., Reference Astete, Sollmann and Silveira2008). We then used the SDMtoolbox in ArcGIS 10.2 (ESRI, Redlands, USA) to calculate the heterogeneity of the first three principal components of 13 continuous environmental layers (Table 1), producing a final heterogeneity layer that allowed us to rarefy records by reducing climate autocorrelation among them (Brown, Reference Brown2014).
Table 1 Environmental variables used in species distribution modelling for the jaguar Panthera onca in the Cerrado (Fig. 1), with their original spatial resolution, year and functional relevance, and sources.

1 We used a spatial resolution of 250 m for modelling. Where required, resolutions were resampled with the nearest neighbour assignment for continuous layers and the majority resampling technique for categorical layers.
*The 13 continuous environmental variables.
Environmental layers
We selected 15 environmental layers according to their functional relevance for the species (Table 1; Elith & Leathwick, Reference Elith and Leathwick2009; Morato et al., Reference Morato, Ferraz, Paula and Campos2014). We used SDMtoolbox (Brown, Reference Brown2014) to identify Pearson correlations (Pearson's r < 0.5; Angelieri et al., Reference Angelieri, Adams-Hosking, Ferraz, de Souza and McAlpine2016) between the 13 continuous environmental variables (Table 1, Supplementary Table 2).
Species distribution modelling
We modelled the current jaguar distribution in the Cerrado biome using Maxent 3.3.3 k (Phillips et al., Reference Phillips, Dudik and Schapire2005, Reference Phillips, Anderson and Schapire2006). Maxent is one of the most popular tools for modelling species distribution using only presence data and has been adopted in many studies to identify areas of high conservation value (Fourcade et al., Reference Fourcade, Engler, Rödder and Secondi2014; Morato et al., Reference Morato, Ferraz, Paula and Campos2014; Paviolo et al., Reference Paviolo, De Angelo, Ferraz, Morato, Pardo and Srbek-Araujo2016). In general, it performs better than other algorithms (Peterson et al., Reference Peterson, Papeş and Soberón2008; Doko et al., Reference Doko, Fukui, Kooiman, Toxopeus, Ichinose, Chen and Skidmore2011; Rodríguez-Soto et al., Reference Rodríguez-Soto, Monroy-Vilchis, Maiorano, Boitani, Faller and Briones2011). Maxent assumes that the presence of a species at a sample location indicates a favourable set of ecological variables and estimates the closest probability to a uniform distribution (the distribution of maximum entropy; Phillips et al., Reference Phillips, Anderson and Schapire2006). Although restricting the range of occurrence of a species may introduce bias in species distribution modelling results (Barbet-Massin et al., Reference Barbet-Massin, Thuiller and Jiguet2010), we decided to use a biome scale because the jaguar distribution in the Atlantic Rainforest has been better predicted using biome databases than continental ones (Ferraz et al., Reference Ferraz, Ferraz, de Paula, Beisiegel and Breitenmoser2012).
We used various combinations of non-correlated layers and generated 24 models in Maxent (Supplementary Material 2). We also ran each model with raw output to calculate Akaike information criteria corrected for small sample sizes (AICc), using the NicheA toolkit (Qiao et al., Reference Qiao, Peterson, Campbell, Soberón, Ji and Escobar2016). We chose AICc based on its top performance in selecting models with small sample sizes (Warren & Seifert, Reference Warren and Seifert2011). We assessed model performance using the area under the receiver operating characteristic curve (AUC), AICc, binomial probability, and omission error (Pearson, Reference Pearson2010; Supplementary Material 2). We also interpreted the marginal curves of the variables that most influenced the models; these are plots created by Maxent that reflect the dependence of predicted suitability both on the selected variable and on dependencies induced by correlations between the selected variable and other variables (Pearson, Reference Pearson2010).
We used an independent dataset of 23 jaguar occurrences from the National Predator Research Center (Supplementary Table 3), for 2007–2017, to validate our final model. Jaguar occurrence was predicted correctly if records were within a radius of 9 km of suitable pixels, the same distance used to rarefy records, confirming that pixels were within the potential home range of the individuals. KF, RGM and FHGR also analysed the final model visually and validated the results.
Jaguar conservation units
We used the best model to select pixels equal to or higher than the median suitability value of the final species distribution model (Rodríguez-Soto et al., Reference Rodríguez-Soto, Monroy-Vilchis, Maiorano, Boitani, Faller and Briones2011; Morato et al., Reference Morato, Ferraz, Paula and Campos2014) and select highly suitable areas. As the jaguar is a threatened species, we generated polygons using 95% of the volume contour of the isopleth function (Beyer, Reference Beyer2012) to guarantee that areas with high and medium suitability would be selected, thus avoiding restricting prioritization of jaguar conservation units to high suitability areas only. We designated all polygons jaguar conservation core areas; i.e. large areas with medium or high environmental suitability for jaguars.
We used Zonation (Moilanen, Reference Moilanen2007), for spatial conservation prioritization, to define jaguar conservation units within each jaguar conservation core area. Zonation removes cells of multiple environmental layers interactively and provides a map with the smallest aggregate marginal loss of environmental characteristics (Lehtomäki & Moilanen, Reference Lehtomäki and Moilanen2013). We ran Zonation combining the habitat suitability map within jaguar conservation core areas, which we assigned a weight of 1, and areas with natural vegetation (from the land-cover map), which we assigned a weight of zero, using the additive benefit function (Lehtomäki & Moilanen, Reference Lehtomäki and Moilanen2013). We used different weights to avoid selecting pixels with suitable vegetation but no jaguar occurrence. We used a warp factor of 100, allowing edge removal and distribution smoothing to obtain a more compact solution. From this ranked output we selected the percentage that represented 15% of the Cerrado area (305,905 km2), similar to the current extent of protected areas in the world (Albuquerque & Beier, Reference Albuquerque and Beier2015).
We transformed this final zonation raster into polygons and assessed those > 23.5 km2 in area according to the ranking of parameters in Table 2, to prioritize jaguar conservation units. We used the area of the jaguar conservation unit and the presence of jaguars, according to the concept of jaguar conservation units established by Sanderson et al. (Reference Sanderson, Redford, Chetkiewicz, Medellin, Rabinowitz, Robinson and Taber2002). We added the categories proximity to protected areas and potential connectivity, as we aimed to select jaguar conservation units that would connect to other patches. The potential for connectivity is based on the probability of connectivity index, which examines an attribute of the patch (mean habitat suitability value, in this case) and the maximum product probability of all paths between a pair of patches, calculated using Conefor 2.6 (Saura & Torné, Reference Saura and Torné2009). This probability was based on the mean dispersal distance (0.5 probability), calculated as 113 km according to the formula 17 × √home range (Bowman et al., Reference Bowman, Jaeger and Fahrig2002). We assumed this number to be plausible, as there is no dispersal distance available for the jaguar in the Cerrado.
Table 2 Ranking of parameters used for prioritization of jaguar conservation units in the Cerrado.
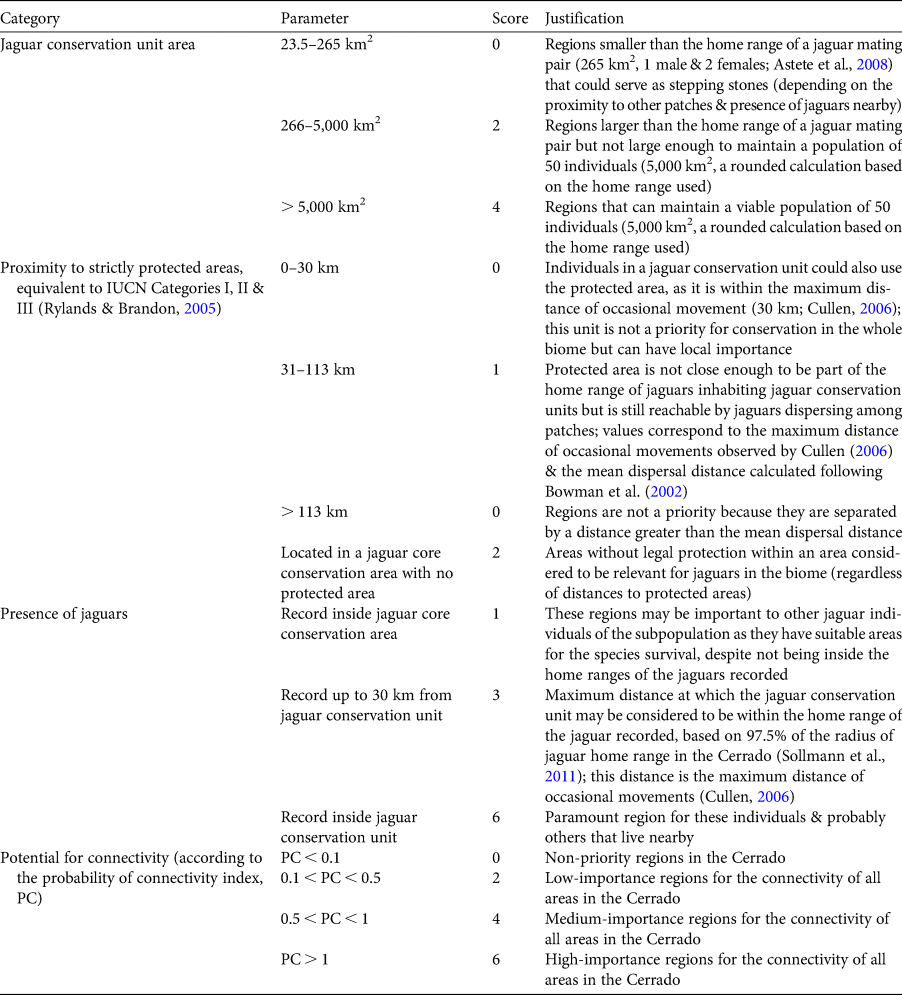
Each polygon was then assigned a score for each category (Table 2) and the polygons were categorized into four types based on the sum of the scores: (1) high-priority jaguar conservation units, with a score of ≥ 9; (2) medium-priority jaguar conservation units, with a score of 5–8; (3) low-priority jaguar conservation units, with a score of 3–4; and (4) stepping stones between jaguar conservation units, with a score of ≤ 2.
For the final jaguar conservation units, we estimated the mean jaguar population according to the lowest and highest recent estimates (0.29 and 0.62 per 100 km2, respectively) for Emas National Park (Sollmann et al., Reference Sollmann, Furtado, Gardner, Hofer, Jácomo, Tôrres and Silveira2011). We grouped the units into areas according to their distribution in the Cerrado, and then overlapped them with areas suggested by the Brazilian government for biodiversity conservation, to identify and review the conservation actions already indicated for the geographical regions of priority jaguar conservation units (MMA, 2015). All spatial analyses and geoprocessing were conducted in ArcGIS.
Results
The best distribution model (AUC test = 0.805 ± SD 0.046, omission error = 0.209, P = 0.002) used 106 occurrence points and nine environmental layers. It identified 30% of the Cerrado (c. 687,059 km2) as being suitable for the jaguar (Fig. 3a). The model was accurate: 95.23% of the additional records used only for validation were predicted correctly. However, only 0.4% of the biome (8,345 km2) showed high suitability (> 0.7) for the species. These areas were located primarily in the north-east of the biome and in small areas in the north-west, near the Amazon biome.

Fig. 3 (a) Habitat suitability for the jaguar, identified by species distribution modelling, and (b) all jaguar conservation units (JCUs) and jaguar core conservation areas (JCCAs) in the Cerrado biome (Fig. 1).
The variables that best predicted jaguar distribution in the Cerrado were mean rainfall (Table 3, Fig. 4) and land cover (Table 3, Fig. 5). The probability of jaguar presence was high in areas with 300–1,400 mm of rainfall; i.e. near the Caatinga biome, a semi-arid region of Brazil. There was also a high probability of jaguar presence in areas with 2,000 mm of rainfall, near the Amazon biome. Forest areas (open evergreen upper plains forest and forested grassland savannah) had a high probability of jaguar presence, followed by some savannah types and secondary vegetation. The probability of jaguar presence in human-modified areas was low to medium (Fig. 5). Maximum enhanced vegetation index, forest height, and mean annual temperature also contributed significantly to the model (Supplementary Material 3).
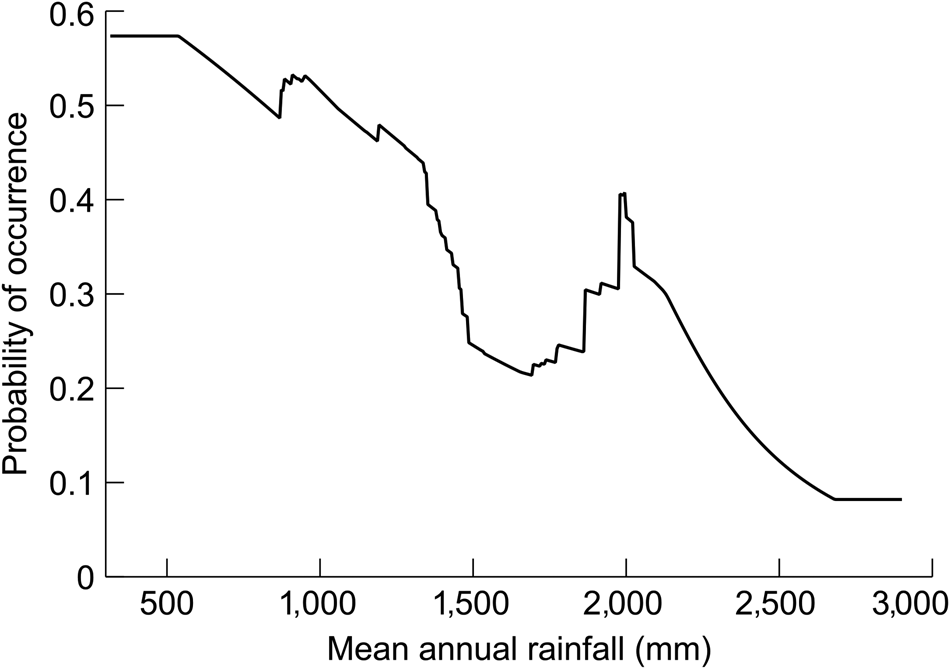
Fig. 4 Marginal response curve of mean annual rainfall, the variable that contributed most to the jaguar distribution model for the Cerrado.

Fig. 5 Probability of jaguar presence in the Cerrado by land-cover type.
Table 3 Importance of the environmental variables for the final model, evaluated by per cent contribution and permutation importance.

We identified 62 jaguar core conservation areas (555,796 km2; Fig. 3b), covering 27% of the Cerrado. Within these areas we identified 427 jaguar conservation units, covering 10% of the biome (219,100 km2). Most reserves were medium or low-priority jaguar conservation units because of their small area (< 2 km2) and distance from strictly protected areas (> 113 km), with absence of jaguar records within a radius of up to 30 km and low importance for connectivity. Only 23,662 km2 (1% of the Cerrado) of the jaguar conservation units are within strictly protected areas.
The ranking of jaguar conservation units prioritized 31 units (Fig. 6), in five areas (Table 4). Only 12 units overlapped with an existing strictly protected area. High-priority jaguar conservation units covered 8.5% of the Cerrado biome (174,825 km2). Only four units could sustain a viable population (≥ 50 individuals) and 24 could sustain two or more individuals (Table 4). Three units could not sustain a mating pair but were ranked highly because of jaguar presence records inside the polygon, or high connectivity importance. Most high-priority units are within the areas of the Cerrado that the Brazilian government recognizes as being important for conservation (MMA, 2015), although they are not strictly protected, with 22 units categorized as being of high, very high or extremely high importance (Table 4). Most high-priority jaguar conservation units also lie within areas where the government recognizes the need to establish new reserves (strictly protected or sustainable use), and 11 are in areas where a mosaic of parks or corridors is desirable (Table 4).

Fig. 6 Priority ranking of jaguar conservation units (the numbers refer to the 31 high- priority units listed in Table 4), and locations of existing strictly protected areas.
Table 4 High-priority jaguar conservation units in the Cerrado biome (Fig. 6). Units with confirmed jaguar occurrence are indicated with an asterisk.
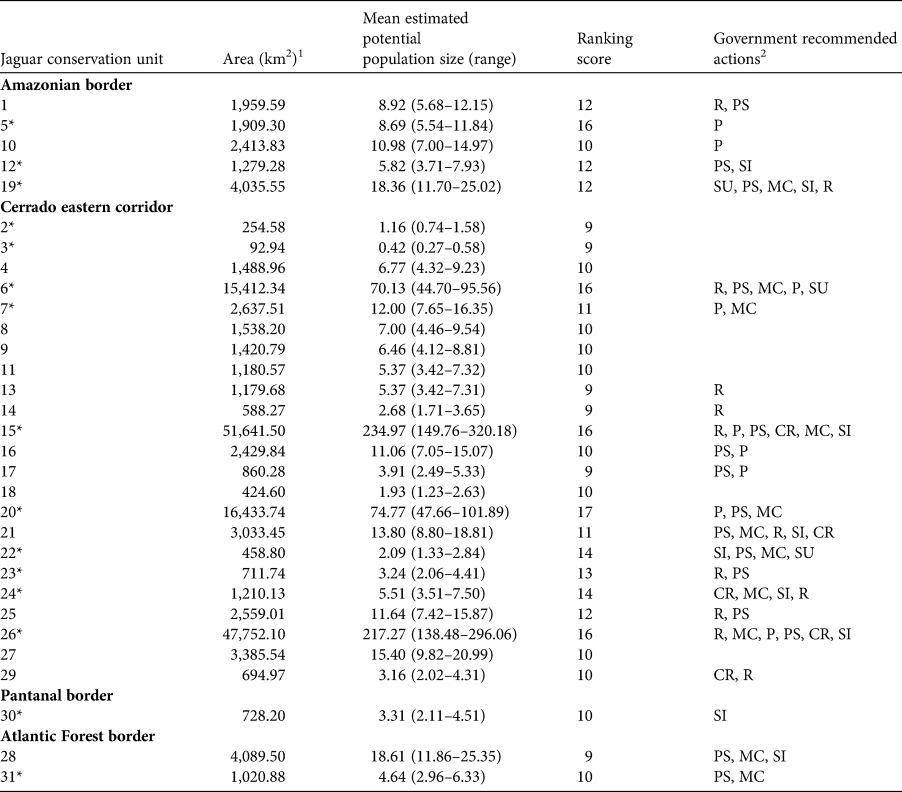
1 Includes adjacent areas that are already strictly protected.
2 R, restoration actions; PS, promote sustainability; P, territorial planning; SI, creation of strictly protected reserves; SU, creation of sustainable-use reserves (equivalent to IUCN categories IV, V & VI; Rylands & Brandon, Reference Rylands and Brandon2005); CR, creation of reserves of any type; MC, establishment of a mosaic of parks or corridors (MMA, 2015).
Discussion
Our results indicate there are still suitable areas for jaguars in 30% of the Cerrado but highly suitable areas are scarce. Our model identified more jaguar conservation units than previous studies in this biome (Sanderson et al., Reference Sanderson, Redford, Chetkiewicz, Medellin, Rabinowitz, Robinson and Taber2002; Zeller, Reference Zeller2007; Desbiez et al., Reference Desbiez, Beisiegel, Campos, Sana, Moraes and Ramalho2013), increasing the total area of high-priority jaguar conservation units to 174,825 km2, 16% more than the largest previous estimate (Desbiez et al., Reference Desbiez, Beisiegel, Campos, Sana, Moraes and Ramalho2013). In general, our model identified similar appropriate regions to those of the National Action Plan for jaguar conservation (Desbiez et al., Reference Desbiez, Beisiegel, Campos, Sana, Moraes and Ramalho2013), based on 1-km-resolution layers with various environmental data. There is a concentration of highly suitable areas in the eastern corridor of the Cerrado, which, with proper management, could connect 23 jaguar conservation units.
Annual rainfall and land cover, the most important environmental variables correlated with jaguar presence, were also the environmental covariates that best explained jaguar occurrence in the Cerrado in an earlier study (Desbiez et al., Reference Desbiez, Beisiegel, Campos, Sana, Moraes and Ramalho2013). The low probability of jaguar presence in areas that received 1,500–1,800 mm of rainfall probably reflects vegetation loss. This rainfall range matches areas that have been devastated by monoculture and extensive deforestation (Coutinho, Reference Klein2000). Regions with a high probability of jaguar presence comprise suitable habitats with native vegetation near the Caatinga biome (320–1,400 mm rainfall), in the north-eastern Cerrado, where there is lower annual rainfall, and areas near the Amazon biome, in the western Cerrado (c. 2,000 mm).
The land-cover types most correlated with jaguar presence in our models were similar to those found by Vynne et al. (Reference Vynne, Keim, Machado, Marinho-Filho, Silveira, Groom and Wasser2011), who observed that jaguars preferred areas with native vegetation and avoided pastures and plantations, and found that jaguars selected areas of shrubland and grassland savannahs as well as forests. The high probability of jaguar presence in the forested grassland savannah with gallery forest indicates a preference for areas near water, which has been reported previously (Vynne et al., Reference Vynne, Keim, Machado, Marinho-Filho, Silveira, Groom and Wasser2011). Although several studies have shown that jaguars prefer primary forests when they are available (Cullen et al., Reference Cullen, Sana, Lima, de Abreu and Uezu2013), our model also indicated that secondary vegetation could have a positive influence on their occurrence. This reinforces the importance of including secondary vegetation and devising restoration actions for the maintenance of jaguar habitats.
Other variables that contributed significantly to the model (e.g. maximum enhanced vegetation index, forest height, mean annual temperature; Supplementary Material 3), indicate a high probability of jaguar occurrence in areas of savannah vegetation. The strong preference for areas with low vegetation height, high mean annual temperatures, and low maximum enhanced vegetation index coincides with characteristics of areas covered by savannah vegetation (Coutinho, Reference Klein2000; Bayma & Sano, Reference Bayma and Sano2015), and therefore those areas should be preserved for jaguar conservation in the Cerrado.
Despite our effort to select functional environmental predictors, species distribution models characterize only part of the species’ environmental niche and may lead to biased predictions about habitat suitability (Barbet-Massin et al., Reference Barbet-Massin, Thuiller and Jiguet2010). Our model identified jaguar core conservation areas similar to jaguar occupancy areas identified by Moraes (Reference Moraes2012) and Zeller (Reference Zeller2007), and increased some areas in the north-eastern Cerrado. However, our model omitted an area identified by Moraes (Reference Moraes2012) and Zeller (Reference Zeller2007) for jaguar conservation in Goiás and Tocantins states, because of low environmental suitability, despite its native vegetation. Nonetheless, this area should be considered in jaguar conservation plans because, besides its regional importance, it may be relevant for connecting jaguar conservation units in the northern Cerrado.
We identified 31 high-priority jaguar conservation units (occupying 174,825 km2) in the Cerrado, compared to previous studies that identified five to seven units (occupying c. 130,000 km2; Sanderson et al., Reference Sanderson, Redford, Chetkiewicz, Medellin, Rabinowitz, Robinson and Taber2002; Zeller, Reference Zeller2007). Units of medium and low priority can still improve total extension and connectivity among jaguar conservation units. Not all jaguar conservation units have confirmed records of resident jaguars within their limits but most are in regions where we presume jaguars are present.
Jaguar conservation units in the northern and north-eastern Cerrado may be vital for maintaining the connectivity between the Amazon and Caatinga biomes and preventing genetic losses among populations. Recent studies reported the effects of habitat deterioration on jaguar genetics in the Caatinga and Atlantic Forest (Haag et al., Reference Haag, Santos, Sana, Morato, Cullen and Crawshaw2010; Roques et al., Reference Roques, Sollman, Jácomo, Tôrres, Silveira and Chávez2016). The Amazon, Cerrado and Pantanal populations still maintain good genetic diversity, but the genetic connectivity in central areas of Brazil, mainly the Cerrado, needs to be maintained to avoid further declines (Roques et al., Reference Roques, Sollman, Jácomo, Tôrres, Silveira and Chávez2016). Preserving the connectivity between jaguar conservation units in the Cerrado may prevent genetic losses in this biome.
The Cerrado eastern corridor, which encompasses the largest jaguar conservation units, is particularly threatened because it lies in the new soybean frontier referred to as MaToPiBa, a region with cheap land, which accounted for 10% of Brazilian soybean production during 2011–2012 (Reynolds, Reference Reynolds2012). We recommend that actions listed in Table 4, such as the creation of new strictly protected areas and corridors, be implemented as soon as possible to preserve jaguar conservation units in these regions (Moraes, Reference Moraes2012; Desbiez et al., Reference Desbiez, Beisiegel, Campos, Sana, Moraes and Ramalho2013). We also recommend the creation of new protected areas and corridors for those jaguar conservation units in areas for which the Brazilian government has no suggested actions.
The Cerrado has 8.2% of its territory protected but < 3% is within strictly protected areas (MMA, 2016). Many of the jaguar conservation units are in regions where the government has recommended the creation of new strictly protected areas, which would alleviate threats to the jaguar's survival and habitat. Some jaguar conservation units are in regions where the government advocates the creation of sustainable-use protected areas (MMA, 2015), where jaguars could persist with adequate sustainable use, proper management and controlled land-cover change. However, half of the sustainable-use protected areas in the Cerrado are in the category ‘environmentally protected areas’ (IUCN category V), which allows agriculture, pastures and other human uses and considers biodiversity conservation a secondary aim (Rylands & Brandon, Reference Rylands and Brandon2005). Although other types of sustainable-use protected areas could be adequate for jaguar conservation because of lower human occupation and habitat impact (Rylands & Brandon, Reference Rylands and Brandon2005), environmentally protected areas may not be the best type for jaguar conservation. This category may include a negligible portion of natural habitat, as well as threats to jaguars, including vehicular traffic, poaching and habitat fragmentation (Vynne et al., Reference Vynne, Keim, Machado, Marinho-Filho, Silveira, Groom and Wasser2011; Morato et al., Reference Morato, Beisiegel, Ramalho, Campos, Boulhosa, Beisiegel, Morato, Paula and Morato2013). Jaguar conservation could be feasible in protected areas of this category if their management plans alleviated these threats and specified areas with restricted use.
Less than 1% of the jaguar conservation units we identified in the Cerrado are within strictly protected areas, and therefore we recommend new protected areas should be created to improve the conservation of jaguars in this biome and at a continental scale. The expansion of protected areas coupled with political actions, including law enforcement, could slow the rate of deforestation, protecting native habitats (Nepstad et al., Reference Nepstad, Mcgrath, Stickler, Alencar, Azevedo and Swette2014) and other species. The Cerrado has 430 threatened faunal species (ICMBIO, 2014), including large mammals that are jaguar prey (e.g. Tayassu pecari and Myrmecophaga tridactyla; Astete et al., Reference Astete, Sollmann and Silveira2008). Maintaining jaguar conservation units, and connectivity between them, could contribute to the conservation of biodiversity at all levels.
Acknowledgments
We thank the National Council for Scientific and Technological Development for a PhD scholarship to MPP (Proc. 141266/2013-9) and productivity scholarships to CMJ (Proc. 305403/2013-3), FHGR (Proc. 306695/2015-4), KMPMBF (Proc. 308503/2014-7) and RGM (301652/2015-5), the National Predator Research Center, Chico Mendes Biodiversity Conservation Institute, the collaborators of the National Conservation Action Plan for the Jaguar, the SISBIO database, Rafael Aarão, José Roberto Moreira, Marina Motta Carvalho and Leo Caetano for providing jaguar records, Milton Ribeiro for methodological advice, and Thiago Vieira and Carol Couto for updating the land-cover map.
Author contributions
Research lead, writing: MPP; technical advice, writing, revision: RGM, KMPMBF, FHGR, CMJ.
Conflicts of interest
None.
Ethical standards
This research abided by the Oryx Code of Conduct.


