


To stop pathogen transmission during a healthcare-associated outbreak, transmission pathways need to be hypothesized. 1 Once potential routes of transmission are defined, whether they are probable or confirmed though person, place, and time, intervention measures can be initiated or continued to interrupt pathogen spread. Transmission pathways may be complex; the type of contact that occurred and the time and space in which the event occurred may not be completely clear. Compared to traditional epidemiological case investigations using only line-list data, visualizing transmission pathways can improve hypothesized relationships in time and space and can, therefore, promote more timely initiation of infection prevention and control measures. Reference Rutter, Parker and Stahl-Timmins2
No standard data visualization tool exists for describing transmission pathways. Typically, line lists comprising patient characteristics, event dates, and elements of clinical care provided are used to generate hypotheses of transmission pathways, with or without accompanying bed traces. Infection surveillance software allows users to review admission locations during the hospital stay, which can provide basic information about shared time and space and therefore transmission opportunities. However, transmission may occur even when patients do not share a proximate admission location at, or close to, the same time. Reference Sundermann, Chen and Kumar3
Tools for data visualization of transmission pathways have been described for use by healthcare-associated infection prevention teams for cluster investigation, and the extent of use these tools is not known. Two examples include Dotmapper and HospMapper: Dotmapper was developed by researchers as an easily accessible interactive mapping tool to visualize infection clusters over large geographic regions using Geographic Information Systems (GIS) (Esri, California). Reference Smith and Hayward4 HospMapper was developed for nosocomial transmission and can show data for patients who have a positive test for a pathogen, with outputs of an epidemic curve, a timeline, and a schematic ward plan. Reference Smith, Allen and Nawaz5
Furthermore, no guidelines or standards have been established to evaluate data visualization tools for transmission events. Salinas et al Reference Salinas, Kritzman, Kobayashi, Edmond, Ince and Diekema6 provided advice for best practices when creating a data visualization. In a systematic review published in 2014, Carroll et al Reference Carroll, Au, Detwiler, Fu, Painter and Abernethy7 found that usability and utility were important functions when determining helpfulness of a data visualization tool. Davis et al Reference Davis, Sevdalis and Drumright8 contemporaneously reported that 15% of published outbreak investigations included spatiotemporal analyses.
In infection prevention and hospital epidemiology, there is a need not only to describe the data visualizations that can be used to generate hypotheses about transmission pathways but also a critical analysis of the characteristics of each data visualization, as well as the software used to create them. Such an analysis would allow infection prevention and hospital epidemiology teams to choose a most effective data visualization tool for the cluster being investigated, to generate hypotheses about transmission pathways more effectively and therefore improve cluster investigations, to implement interventions to interrupt transmission more quickly to ultimately better prevent patient harm.
In this scoping review, we have evaluated the infectious-pathogen transmission data visualizations used in healthcare settings to determine which methods and elements of visualizing transmission in healthcare settings are effective at generating hypotheses regarding transmission pathways.
Methods
Published evidence eligibility criteria
Articles eligible for inclusion in the scoping review were peer reviewed, written in English, and published after 1985 (when infection preventionists (IPs) first documented using electronic surveillance including electronic medical records and information technology tools that allow for automated data collection). Reference Schifman and Palmer9,Reference Grota, Stone, Jordan, Pogorzelska and Larson10 All eligibility criteria were selected in the search algorithm.
Articles were excluded if they did not contain patient data with a methodology appropriate for evaluating a healthcare-associated infectious disease or infectious pathogen cluster, such as observational cluster investigation methods. 11 Therefore, cost–benefit analyses, meta-analyses, randomized control trials, community outbreaks, and other nonhealthcare studies were not included in the review.
Full article review used the following 4 inclusion criteria to select screened articles for data abstraction: (1) Infectious diseases met healthcare-associated infection definitions using National Healthcare Safety Network criteria (NHSN) 12 but could be an infectious disease not defined using NHSN healthcare-associated infection criteria if ≥1 transmission event occurred within a healthcare facility. This was done to capture all potential pathogen transmission in the healthcare setting. (2) The source described an infectious disease cluster. Multiple clusters in an outbreak or publication were included if each cluster was contained in 1 healthcare facility. (3) The results contained 1 or more data visualizations demonstrating pathogen transmission pathways with data observable by an infection preventionist showing temporal and/or spatial relationships using patient health data and epidemiological data. For example, data visualizations could not contain only a phylogenetic tree, which alone would not include various person type data (ie, patients, healthcare workers) or test positive dates; however, a phylogenetic tree could serve as a data visualization if it incorporated other nongenetic epidemiologically relevant data. (4) The facilities where transmission occurred was considered a healthcare facility. Healthcare facilities were defined as structures whose primary purpose was designed to provide care to individuals where person-to-person transmission can occur and where healthcare personnel are present. Healthcare facilities include long-term care facilities, acute-care facilities, rehabilitation facilities, and behavioral health facilities.
Information sources and search strategy
Medline (Ovid) was searched by a health sciences librarian (H.M.V.V.) with systematic review experience. The date of the search was August 24, 2021. Concepts that comprised the search were healthcare-acquired infections and cluster analysis or geographic mapping. A combination of MeSH terms and title, abstract, and keywords was used to develop the Medline search that was checked against a known set of studies (Supplementary Table S1 online). Articles were also considered for review if they were cited as references within the papers found through the original Medline search and appeared to have relevance for this review.
Citations were uploaded from EndNote (Clarivate, UK) to DistillerSR (Evidence Partners, Canada) for the study selection process. All study selection decisions were stored in DistillerSR. Two authors (M.B.B. and J.F.W.) conducted the title, abstract, and full-article eligibility screening. When a consensus on article eligibility could not be reached, a third investigator (G.M.S.) independently reviewed the citation, abstract, and manuscript to determine eligibility. The data charting was completed by 3 reviewers (M.B.B., J.F.W., and N.J.R.) for articles that passed the full-text screening process. The protocol was published on Open Science Framework prior to beginning the literature search. Reference Brady, VonVille and White13
Data abstraction
Data abstraction was completed independently by 3 reviewers (M.B.B., J.F.W., and N.J.R.) from the eligible articles using DistillerSR using a data abstraction form developed by the investigators. The data abstracted included the nature of the cluster(s) including pathogen, scope of transmission, and individuals involved. Characteristics of the transmission pathway data visualization(s) included type of visualization, elements of transmission incorporated into the visualization, and software used in the visualization (Supplementary Table S2).
Data visualization categorization
Data visualization categories were defined data visualization types within specified categories of hypothetical examples (Fig. 1). If data visualizations were unable to be grouped within the established example types, new categories were added to ensure that all data visualizations were incorporated and analyzed.

Fig. 1. Examples of data visualization types from reported healthcare-associated infectious diseases outbreaks. Note: Citations for information for the data visualizations: heat map, Reference Ohannessian, Bénet and Argaud49 dot maps, 50 timelines, 50 Gantt chart, transmission networks, and social networks. Reference Varia, Wilson and Sarwal17 All visualizations are hypothetical examples created by the author this year.
Statistical analysis
Statistical analysis, the calculations of means, medians, and totals, were performed using Excel. Characteristics of the studies and data visualizations are described using aggregate averages.
The project, including a subsequent evaluation and implementation of a software tool for data visualization, underwent formal review and was granted ethical approval (Project 3405) as a quality improvement project by University of Pittsburgh Medical Center’s Quality Improvement Review Committee.
Results
Study characteristics
With the exclusion of 1 duplicate article, 1,957 articles were identified through the Ovid Medline database search (Fig. 2) and 1,707 (87.2%) articles were included after review of the citation and abstract. Among the articles that were excluded, 335 did not include an infectious pathogen, 829 were not human studies, and 1,691 used nonpertinent study methodology. The remaining 250 (12.7%) articles underwent full text review, of which 220 did not meet ≥1 inclusion criteria: 13 did not study an NHSN-defined or healthcare-associated organism, 95 did not describe an infectious diseases cluster, 200 did not include ≥1 data visualization, 40 did not occur in a healthcare facility, and 1 reported an outbreak in >1 facility. The remaining 30 articles (1.5%) fulfilled the eligibility criteria and were included in data abstraction and analysis.
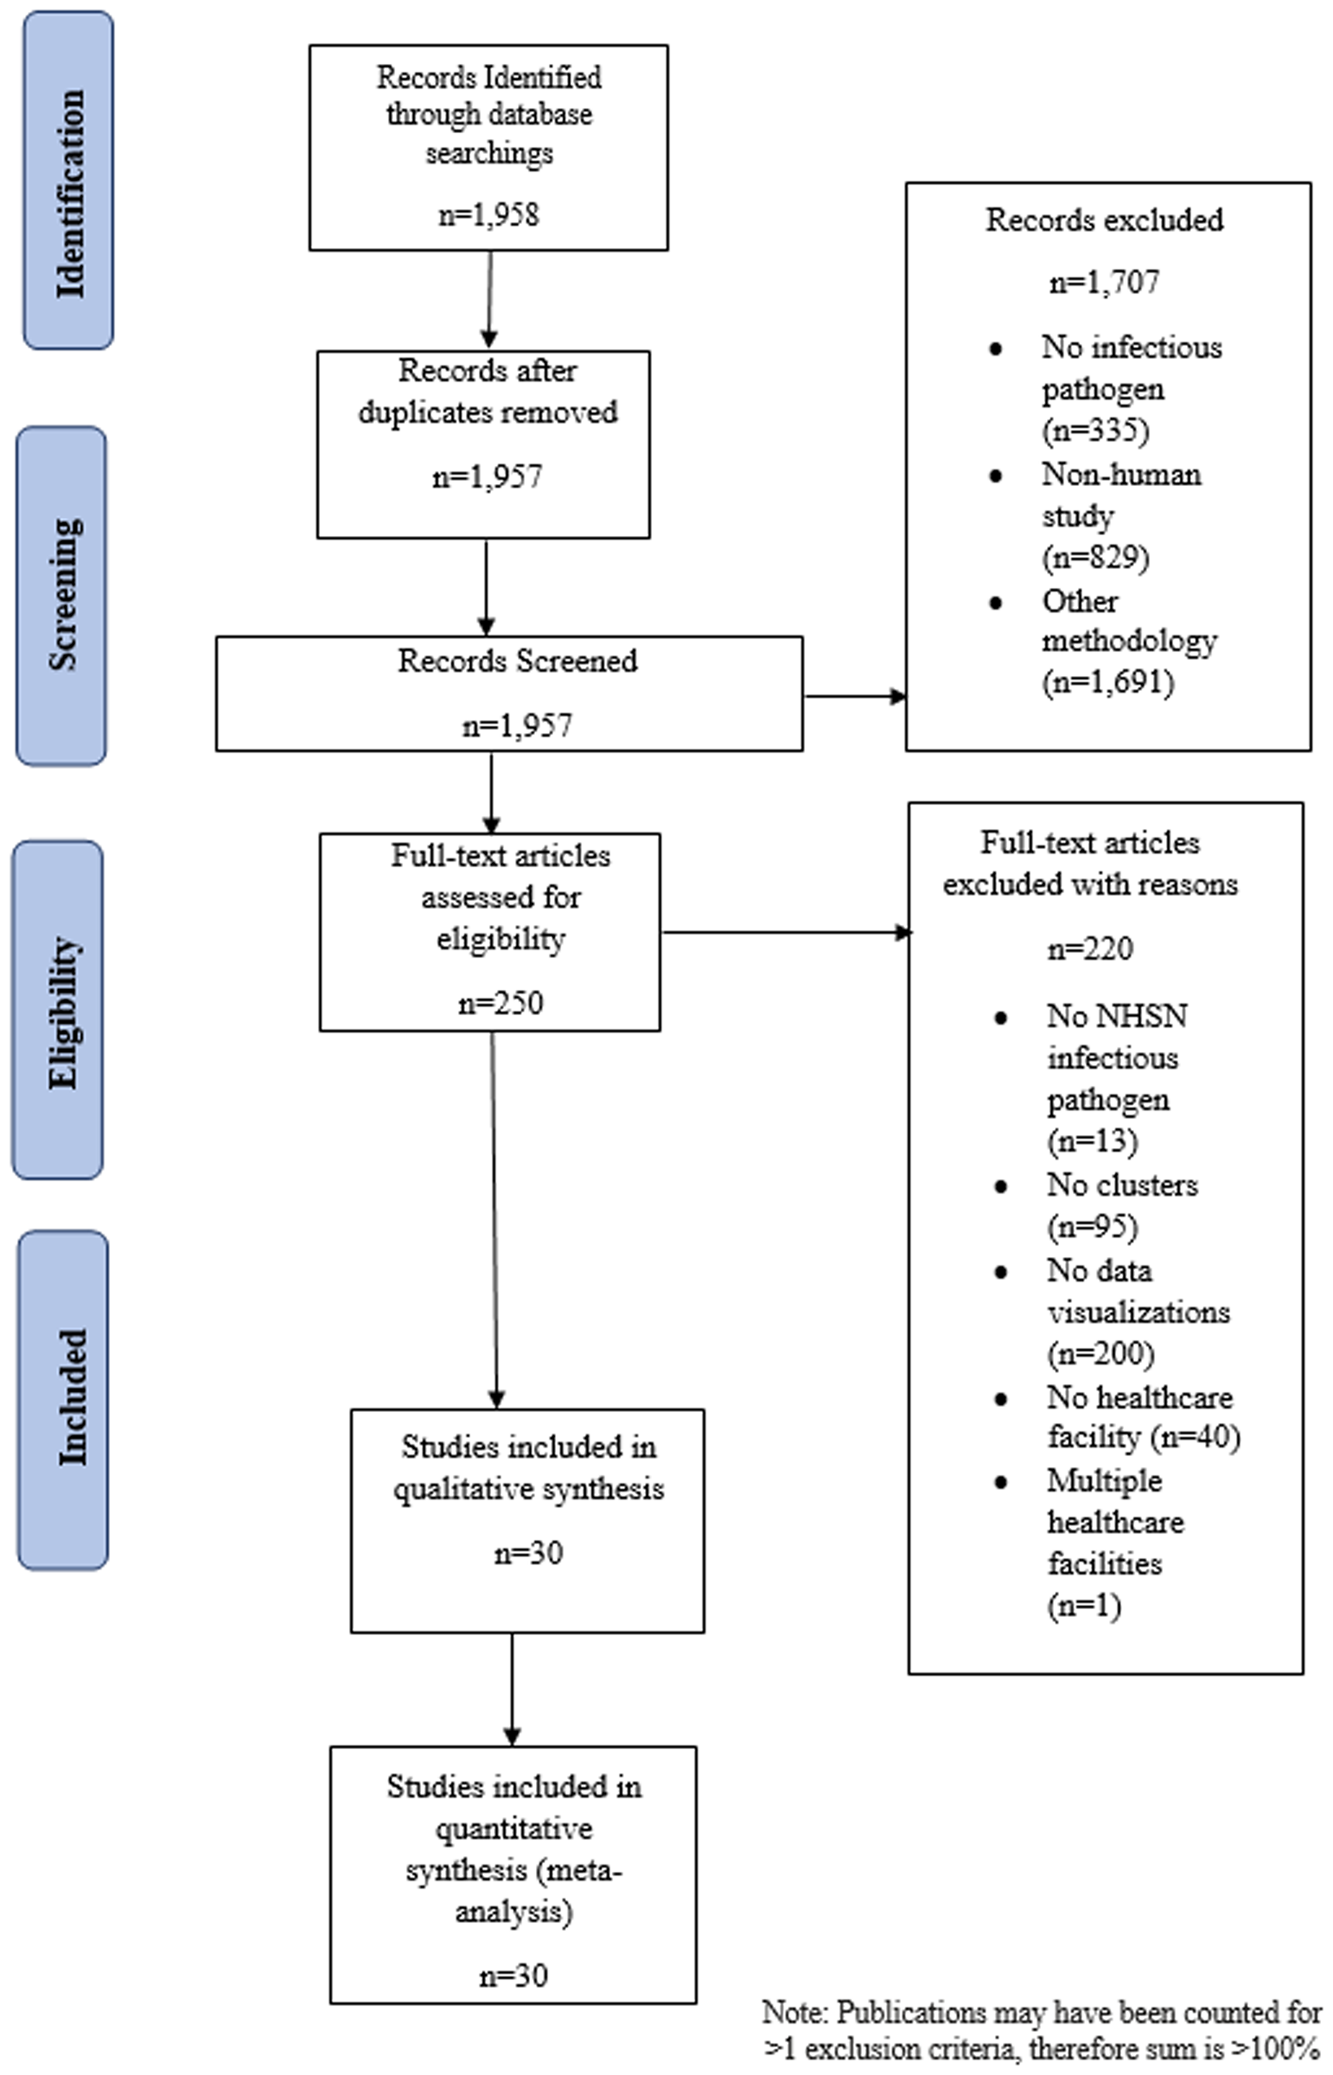
Fig. 2. PRISMA-P flow diagram depicting articles identified through literature search, including those included in the analysis of data visualizations of transmission pathways in healthcare-associated infectious diseases outbreaks. Note. NHSN, National Healthcare Safety Network.
The 30 analyzed studies were conducted in healthcare facilities in North America, Reference Klompas, Baker and Rhee14–Reference Moldovan, Suh, Liu and Jolly18 South America, Reference da Silva, da Silva and Rodrigues19 Europe, Reference Abbas, Robalo Nunes and Cori20–Reference Borges, Isidro and Macedo31 Africa, Reference Gandhi, Weissman and Moodley32,Reference Jacobson, Manesen and Moodley33 Asia, Reference Duong and McLaws34–Reference Wee, Sim and Conceicao42 and Australia Reference Marmor, Daveson, Harley, Coatsworth and Kennedy43 (Table 1). Fourteen studies (46.7%) described outbreaks occurring in acute-care facilities Reference Javaid, Ehni and Gonzalez-Reiche15,Reference Pai, Polgreen, Segre, Sewell and Pemmaraju16,Reference da Silva, da Silva and Rodrigues19,Reference Burns, Heslin and Crowley21,Reference Nevez, Le Gal and Noel25,Reference Spada, Abbate and Sicurezza29–Reference Gandhi, Weissman and Moodley32,Reference Duong and McLaws34–Reference Shen, Ning and Zhou38 and 11 (36.7%) studies were conducted in a tertiary-care hospitals. Reference Klompas, Baker and Rhee14,Reference Moldovan, Suh, Liu and Jolly18,Reference Charpentier, Garnaud and Wintenberger22–Reference Kossow, Kampmeier, Schaumburg, Knaack, Moellers and Mellmann24,Reference Pérez-Lago, Martínez-Lozano and Pajares-Díaz27,Reference Rabodonirina, Vanhems and Couray-Targe28,Reference Jacobson, Manesen and Moodley33,Reference Wong, Lee and Li40,Reference Wee, Sim and Conceicao42,Reference Marmor, Daveson, Harley, Coatsworth and Kennedy43 Of the remaining studies, 2 studies took place in a community hospital, Reference Varia, Wilson and Sarwal17,Reference Yang, Chen and Wang41 2 studies took place in a geriatric hospital, Reference Pagani, Thomas and Huttner26,Reference Tsutsumi, Nishiura and Kobayashi39 and 1 study took place in a long-term care facility with a rehabilitation care ward. Reference Abbas, Robalo Nunes and Cori20 Of the 30 studies, 17 (56.6%) were prospective studies. Reference Javaid, Ehni and Gonzalez-Reiche15,Reference Varia, Wilson and Sarwal17,Reference Burns, Heslin and Crowley21,Reference Cherifi, Delmee, Van Broeck, Beyer, Byl and Mascart23,Reference Kossow, Kampmeier, Schaumburg, Knaack, Moellers and Mellmann24,Reference Pagani, Thomas and Huttner26,Reference Rabodonirina, Vanhems and Couray-Targe28–Reference Borges, Isidro and Macedo31,Reference Jacobson, Manesen and Moodley33–Reference Furusyo, Kubo, Nakashima, Kashiwagi, Etoh and Hayashi35,Reference Shen, Ning and Zhou38,Reference Wong, Lee and Li40–Reference Wee, Sim and Conceicao42
Table 1. Characteristics of 31 Studies Examining Clusters of Infectious Pathogens With Data Visualizations in Healthcare Settings

Note: End date of cluster in calculation (1 day was added).
a Article did not describe the type of care provided at the healthcare facility so acute care was marked.
The 30 studies described clusters with a median cluster size of 20.5 individuals (range, 7 to 1,963) and a median duration of 214 days (range, 12–5,204) (Table 1). Also, 15 (50%) of the causative pathogens described in clusters were viral, Reference Klompas, Baker and Rhee14,Reference Javaid, Ehni and Gonzalez-Reiche15,Reference Varia, Wilson and Sarwal17,Reference Abbas, Robalo Nunes and Cori20,Reference Burns, Heslin and Crowley21,Reference Pagani, Thomas and Huttner26,Reference Pérez-Lago, Martínez-Lozano and Pajares-Díaz27,Reference Spada, Abbate and Sicurezza29,Reference Borges, Isidro and Macedo31,Reference Duong and McLaws34,Reference Furusyo, Kubo, Nakashima, Kashiwagi, Etoh and Hayashi35,Reference Lee, Kim and Lee37,Reference Shen, Ning and Zhou38,Reference Wong, Lee and Li40,Reference Wee, Sim and Conceicao42 10 (33.3%) were bacterial, Reference Pai, Polgreen, Segre, Sewell and Pemmaraju16,Reference Moldovan, Suh, Liu and Jolly18,Reference da Silva, da Silva and Rodrigues19,Reference Cherifi, Delmee, Van Broeck, Beyer, Byl and Mascart23,Reference Kossow, Kampmeier, Schaumburg, Knaack, Moellers and Mellmann24,Reference Gandhi, Weissman and Moodley32,Reference Jacobson, Manesen and Moodley33,Reference Jia, Du and Yang36,Reference Yang, Chen and Wang41,Reference Marmor, Daveson, Harley, Coatsworth and Kennedy43 (10, 33.3%), and 5 (16.6%) were other organism types Reference Charpentier, Garnaud and Wintenberger22,Reference Nevez, Le Gal and Noel25,Reference Rabodonirina, Vanhems and Couray-Targe28,Reference Vindrios, Argy and Le Gal30,Reference Tsutsumi, Nishiura and Kobayashi39 (Table 1 and Supplementary Table S3). In the clusters describing the composition of infected individuals, most were patients, Reference Klompas, Baker and Rhee14–Reference Burns, Heslin and Crowley21,Reference Cherifi, Delmee, Van Broeck, Beyer, Byl and Mascart23,Reference Kossow, Kampmeier, Schaumburg, Knaack, Moellers and Mellmann24,Reference Pagani, Thomas and Huttner26,Reference Pérez-Lago, Martínez-Lozano and Pajares-Díaz27,Reference Spada, Abbate and Sicurezza29,Reference Borges, Isidro and Macedo31–Reference Shen, Ning and Zhou38,Reference Wong, Lee and Li40,Reference Yang, Chen and Wang41,Reference Marmor, Daveson, Harley, Coatsworth and Kennedy43 nurses, Reference Klompas, Baker and Rhee14,Reference Varia, Wilson and Sarwal17,Reference Borges, Isidro and Macedo31,Reference Lee, Kim and Lee37 advanced practice practitioners, and physicians, Reference Klompas, Baker and Rhee14,Reference Varia, Wilson and Sarwal17,Reference Lee, Kim and Lee37 and other healthcare workers. Reference Klompas, Baker and Rhee14,Reference Javaid, Ehni and Gonzalez-Reiche15,Reference Varia, Wilson and Sarwal17,Reference Kossow, Kampmeier, Schaumburg, Knaack, Moellers and Mellmann24,Reference Pagani, Thomas and Huttner26,Reference Borges, Isidro and Macedo31,Reference Lee, Kim and Lee37,Reference Wee, Sim and Conceicao42,Reference Abbas, Robalo Nunes and Martischang44 Of 3,359 persons described in the clusters, 93.1% were patients and the remainder were healthcare workers (Supplementary Table S4).
Data visualization types and elements
In total, 37 data visualizations were reported in the 30 eligible articles (Supplementary Table S3), with up to 2 visualizations per study. More than half of the data visualizations contained spatial elements, Reference Klompas, Baker and Rhee14–Reference Pai, Polgreen, Segre, Sewell and Pemmaraju16,Reference da Silva, da Silva and Rodrigues19,Reference Charpentier, Garnaud and Wintenberger22–Reference Pérez-Lago, Martínez-Lozano and Pajares-Díaz27,Reference Borges, Isidro and Macedo31,Reference Jacobson, Manesen and Moodley33–Reference Lee, Kim and Lee37,Reference Tsutsumi, Nishiura and Kobayashi39–Reference Wee, Sim and Conceicao42,Reference Memish, Al-Tawfiq and Alhakeem45 and/or person type, Reference Klompas, Baker and Rhee14,Reference Javaid, Ehni and Gonzalez-Reiche15,Reference Varia, Wilson and Sarwal17–Reference Charpentier, Garnaud and Wintenberger22,Reference Kossow, Kampmeier, Schaumburg, Knaack, Moellers and Mellmann24–Reference Gandhi, Weissman and Moodley32,Reference Duong and McLaws34–Reference Jia, Du and Yang36,Reference Tsutsumi, Nishiura and Kobayashi39,Reference Wong, Lee and Li40 and half contained time elements. Reference Javaid, Ehni and Gonzalez-Reiche15–Reference Varia, Wilson and Sarwal17,Reference Burns, Heslin and Crowley21,Reference Charpentier, Garnaud and Wintenberger22,Reference Kossow, Kampmeier, Schaumburg, Knaack, Moellers and Mellmann24–Reference Rabodonirina, Vanhems and Couray-Targe28,Reference Vindrios, Argy and Le Gal30,Reference Borges, Isidro and Macedo31,Reference Duong and McLaws34,Reference Jia, Du and Yang36,Reference Tsutsumi, Nishiura and Kobayashi39,Reference Marmor, Daveson, Harley, Coatsworth and Kennedy43 Case type (confirmed, probable, or suspected) Reference Klompas, Baker and Rhee14,Reference Varia, Wilson and Sarwal17,Reference da Silva, da Silva and Rodrigues19,Reference Cherifi, Delmee, Van Broeck, Beyer, Byl and Mascart23,Reference Kossow, Kampmeier, Schaumburg, Knaack, Moellers and Mellmann24,Reference Pérez-Lago, Martínez-Lozano and Pajares-Díaz27,Reference Rabodonirina, Vanhems and Couray-Targe28,Reference Jacobson, Manesen and Moodley33,Reference Furusyo, Kubo, Nakashima, Kashiwagi, Etoh and Hayashi35,Reference Jia, Du and Yang36,Reference Tsutsumi, Nishiura and Kobayashi39,Reference Marmor, Daveson, Harley, Coatsworth and Kennedy43 and pathway type were less frequently incorporated. Reference Varia, Wilson and Sarwal17,Reference Charpentier, Garnaud and Wintenberger22,Reference Rabodonirina, Vanhems and Couray-Targe28–Reference Borges, Isidro and Macedo31,Reference Duong and McLaws34,Reference Jia, Du and Yang36 None of the data visualizations contained contagious periods, and very few contained symptom-onset date (Table 2). Reference Klompas, Baker and Rhee14,Reference Jia, Du and Yang36
Table 2. Types of Data Elements Included Across 37 Transmission Visualizations Grouped by Data Visualization Type in the 30 Eligible Articles Reviewed

a Data visualizations with specific software stated, see Supplementary Table 5.
Timeline-type data visualizations were more likely to include person type Reference Javaid, Ehni and Gonzalez-Reiche15,Reference Kossow, Kampmeier, Schaumburg, Knaack, Moellers and Mellmann24,Reference Pagani, Thomas and Huttner26,Reference Rabodonirina, Vanhems and Couray-Targe28,Reference Jia, Du and Yang36 but more than half of timelines included spatial elements Reference Javaid, Ehni and Gonzalez-Reiche15,Reference Kossow, Kampmeier, Schaumburg, Knaack, Moellers and Mellmann24,Reference Pagani, Thomas and Huttner26 and test positivity date. Reference Javaid, Ehni and Gonzalez-Reiche15,Reference Kossow, Kampmeier, Schaumburg, Knaack, Moellers and Mellmann24,Reference Jia, Du and Yang36 Among floor-plan transmission maps, Reference da Silva, da Silva and Rodrigues19,Reference Cherifi, Delmee, Van Broeck, Beyer, Byl and Mascart23,Reference Pérez-Lago, Martínez-Lozano and Pajares-Díaz27,Reference Jacobson, Manesen and Moodley33,Reference Furusyo, Kubo, Nakashima, Kashiwagi, Etoh and Hayashi35,Reference Tsutsumi, Nishiura and Kobayashi39–Reference Wee, Sim and Conceicao42 time elements were only included in 20% of the studies. Reference Pérez-Lago, Martínez-Lozano and Pajares-Díaz27,Reference Tsutsumi, Nishiura and Kobayashi39 All 3 cluster maps Reference Klompas, Baker and Rhee14,Reference Javaid, Ehni and Gonzalez-Reiche15,Reference Lee, Kim and Lee37 prioritized spatial elements; however, 1 cluster map Reference Klompas, Baker and Rhee14 successfully incorporated person type, case type, transmission pathways, symptom-onset date, and positive test date. Transmission trees Reference Abbas, Robalo Nunes and Cori20 and social networks Reference Moldovan, Suh, Liu and Jolly18 successfully incorporated person types. For the heat map Reference da Silva, da Silva and Rodrigues19 and case proximity map Reference Pai, Polgreen, Segre, Sewell and Pemmaraju16 analyses, spatial elements were included. However, transmission networks Reference Varia, Wilson and Sarwal17,Reference Charpentier, Garnaud and Wintenberger22,Reference Nevez, Le Gal and Noel25,Reference Pérez-Lago, Martínez-Lozano and Pajares-Díaz27,Reference Spada, Abbate and Sicurezza29,Reference Vindrios, Argy and Le Gal30,Reference Gandhi, Weissman and Moodley32,Reference Duong and McLaws34,Reference Jia, Du and Yang36,Reference Shen, Ning and Zhou38,Reference Marmor, Daveson, Harley, Coatsworth and Kennedy43 were more variable in the type of elements included to display transmission events; more than half contained time elements Reference Varia, Wilson and Sarwal17,Reference Charpentier, Garnaud and Wintenberger22,Reference Nevez, Le Gal and Noel25,Reference Pérez-Lago, Martínez-Lozano and Pajares-Díaz27,Reference Vindrios, Argy and Le Gal30,Reference Duong and McLaws34,Reference Jia, Du and Yang36,Reference Marmor, Daveson, Harley, Coatsworth and Kennedy43 and/or person types. Reference Varia, Wilson and Sarwal17,Reference Charpentier, Garnaud and Wintenberger22,Reference Nevez, Le Gal and Noel25,Reference Pérez-Lago, Martínez-Lozano and Pajares-Díaz27,Reference Spada, Abbate and Sicurezza29,Reference Vindrios, Argy and Le Gal30,Reference Gandhi, Weissman and Moodley32,Reference Duong and McLaws34,Reference Jia, Du and Yang36
Only 2 studies reported the software used to create data visualizations (2 [5.4%] of 37 data visualizations). Reference Moldovan, Suh, Liu and Jolly18,Reference da Silva, da Silva and Rodrigues19 The following software programs were used to create data visualizations: AutoCAD, Reference da Silva, da Silva and Rodrigues19 QGIS, Reference da Silva, da Silva and Rodrigues19 and Pajek 4.9018 (Supplementary Table S5).
Discussion
In this scoping review of 1,957 articles, 30 studies with 37 data visualizations were identified that described clusters of infections in healthcare settings. Across the 37 data visualizations, more than half included spatial elements and patients, and half included time. Almost half contained case type and none included contagious periods. Overall, this scoping review has demonstrated the wide range of data visualization practices used in characterizing outbreaks. Although none of the data visualizations analyzed in this review incorporated all data elements (ie, contagious period, healthcare workers, pathways, symptom onset date, and test positive date), several types of visualizations incorporated multiple elements.
We observed significant variability the data elements included across visualization types. With the wide range of data elements included in each of the visualizations analyzed for this review, an infection preventionist should explore different data visualization types to analyze the specific circumstance of the cluster most effectively. This variability also suggests an opportunity to develop a data visualization software tool that incorporates all the elements or has the capability to create different visualizations from the same cluster data set. The very infrequent reporting of software programs in these clusters did not allow us to evaluate whether a specific program could create hypothesized transmission pathways using different visualization types.
Among all data visualizations, 26 (70%) used spatial elements Reference Klompas, Baker and Rhee14–Reference Pai, Polgreen, Segre, Sewell and Pemmaraju16,Reference da Silva, da Silva and Rodrigues19,Reference Charpentier, Garnaud and Wintenberger22–Reference Pérez-Lago, Martínez-Lozano and Pajares-Díaz27,Reference Borges, Isidro and Macedo31,Reference Jacobson, Manesen and Moodley33–Reference Lee, Kim and Lee37,Reference Tsutsumi, Nishiura and Kobayashi39–Reference Marmor, Daveson, Harley, Coatsworth and Kennedy43 and 19 (51%) included time elements. Reference Javaid, Ehni and Gonzalez-Reiche15–Reference Varia, Wilson and Sarwal17,Reference Burns, Heslin and Crowley21,Reference Charpentier, Garnaud and Wintenberger22,Reference Kossow, Kampmeier, Schaumburg, Knaack, Moellers and Mellmann24–Reference Rabodonirina, Vanhems and Couray-Targe28,Reference Vindrios, Argy and Le Gal30,Reference Borges, Isidro and Macedo31,Reference Duong and McLaws34,Reference Jia, Du and Yang36,Reference Tsutsumi, Nishiura and Kobayashi39,Reference Marmor, Daveson, Harley, Coatsworth and Kennedy43 The high frequency of these data element types may be related to accessibility and availability of information at a given healthcare facility. Less frequently utilized data visualization elements, such as contagious period and symptom-onset date, may relate to data accessibility. Despite the additional burden that collection of these elements place on healthcare facilities, symptom-onset dates and contagious periods should be collected and considered important features in cluster-transmission visualizations. For contact tracing and the development of hypotheses of transmission, these types of elements are essential to fully understanding the extent of the transmission event.
Specific data elements including patient information, microbiology cultures, as well as locations of patients and/or healthcare workers in space fit into the way in which standard outbreak investigations are conducted by infection preventionists. However, these data may not necessarily be in a form extractable directly from electronic health records (EHR). Thus, a standardized data visualization tool would need to be aware of the data infection preventionists have readily available. Additionally, the adoption of data visualization tools must include the consideration of data integration because EHR data may be difficult to extract and the software must work in tandem. EHR data mining has been effective at identifying transmission routes in healthcare outbreaks. Reference Sundermann, Miller and Marsh46 A data visualization tool that can be used to visualize and hypothesize transmission routes and that seamlessly integrates with the existing EHR could aid in informing interventions to stop transmission. However, data visualization tools need operational data integration to be effective.
Within the 37 data visualizations we analyzed, the frequency of spatial elements and time elements was higher than the 15% frequency of spatiotemporal elements reported among data visualizations in 2014. Reference Davis, Sevdalis and Drumright8 Of the eligible articles, 19 of the 30 were published after 2014, which may account for some of the change. Of these 19 articles, 11 included spatial and time elements in data visualizations. The increased inclusion of spatiotemporal elements may be an indicator of improving data visualization utility over time.
We observed a slight pattern in the types of visualizations used to analyze droplet versus contact transmission. Infection clusters due to bacteria, most commonly requiring contact precautions, used case-proximity maps, floor-plan transmission maps, and transmission networks more frequently. In contrast, clusters due to viruses, more likely requiring droplet precaution isolation (excepting hepatitis B and C viruses), used timelines, cluster maps, Gantt charts, and transmission networks most often. In addition, many of the viral cluster visualizations included patients and healthcare workers, whereas bacterial cluster visualizations mostly included patients. Inclusion of both healthcare workers and patients in viral cluster visualizations may be due to transmission patterns of respiratory pathogens such as SARS-CoV-2 and influenza A. Reference Sepkowitz47,Reference Sepkowitz48 Data visualizations used for different infectious pathogens and the data elements used to describe the clusters could be tailored to the mechanisms of transmission of the pathogen under investigation.
Only 2 of the evaluated visualizations described the type of software used. Software such as R and GIS require training to use; other software created to aid in cluster visualization, such as DotMapper and HospMapper, require specific software knowledge and have technological limitations including data formatting (Supplementary Table S5). An ideal data visualization software program would not only be easily integrated into the current infection prevention workflow but would also be accessible for those with minimal programming expertise.
All the outbreaks in the articles were described after the outbreak occurred within the healthcare facility and after infection prevention measures were initiated. The data visualizations contained within these articles illustrated the transmission events and pathways that were already known. Therefore, the ability of these software tools to derive hypotheses about transmission pathways is limited, and this feature is essential when an outbreak is first identified to advance the investigation. Other limitations of this analysis include a small sample size of only 30 publications and 37 data visualizations, with most studies describing outbreaks in acute-care facilities. The common elements found in these articles may not be generalizable to other healthcare facilities seeking to visualize transmission pathways, such as long-term care facilities, behavioral health facilities, or psychiatric facilities. Our review may have been affected by publication bias toward acute-care facilities, which have better data accessibility, and by bias toward reporting larger outbreaks. Our findings may underrepresent smaller outbreaks and investigations in lower-resourced facilities. Although the findings of this study included outbreaks reported internationally, limiting the search to English language and 1 database may have excluded less readily accessible and non–peer-reviewed data.
The data gathered from these articles will be used to inform the creation of a standardized visualization tool that can aid in current SARS-CoV-2 cluster investigations, with the overall goal of allowing for visualization of other infectious pathogen clusters in healthcare settings to reduce nosocomial transmission. Data visualization should include spatial elements, time elements, and elements that inform the exposure window and incubation period, as well as epidemiologic characteristics potentially associated with transmission such as healthcare worker type. No single data visualization may capture all informative elements, however. By understanding the types of common data visualization elements utilized in transmission visualizations, IPs can develop a generalized understanding of the types of possible data visualizations and data elements that can be included for different infectious pathogens. This study also highlights the need for a standardized data visualization that can utilize electronic medical records to allow for the generation of hypotheses regarding transmission and, therefore, improve public health measures and patient safety through faster infection prevention and control interventions to interrupt transmission.
Acknowledgments
We thank the UPMC Presbyterian-Shadyside Infection Prevention & Control team, as well as instructors and advisors at the University of Pittsburgh School of Public Health for their support on this manuscript.
Financial support
No financial support was provided relevant to this article.
Conflicts of interest
All authors report no potential conflicts of interest relevant to this article.
Supplementary material
To view supplementary material for this article, please visit https://doi.org/10.1017/ash.2022.237


 Open access