


Introduction
Despite an ever evolving increase in maritime safety and security measures, ship accidents and distress at sea situations are still a common occurrence today due to the harsh sea environment many commercial vessels and even private boats operate in. Search and rescue (SAR, not to be confused with synthetic aperture radar) at sea is considered to be a very time critical task due to the hostility of the environment, especially when people are already in life rafts, or even worse, directly in the water itself [Reference Burciu, Abramowicz-Gerigk, Przybyl, Plebankiewicz and Januszko1].
While SAR organizations can generally rely upon ship- or airborne (imaging) radar and thermal imaging sensor suites to reduce the search time, these specialized rescue assets generally take considerable time to arrive at the scene of the accident, even in coastal waters. Individual vessels however generally lack special SAR sensors and can only rely upon the man overboard maneuver, assisted by its navigation systems, until further assistance arrives. Nowadays the only viable improvement to this response is the use of emergency radio beacons or SARTs (Search and Rescue Radar Transponder), using a GNSS receiver in conjunction with a radio transmitter that should be thrown into the sea as quickly as possible to float along a similar path or trajectory as the person who has gone overboard in addition to the simultaneous deployment of pneumatic life rafts.
Nevertheless, many people are still not located after falling into the water. While more advanced personal systems using complex transceiver transponders (short: tags) are available, they are not widely adopted due to high unit cost and logistical challenges such as charging facilities, high power usage, maintenance requirements, and long cold start times for the GNSS position fix.
This paper, of which an earlier version was presented at the European Microwave Conference [Reference Heuermann, Harzheim and Mühmel2], introduces a new maritime search and rescue system (SRS), similar to the RECCO rescue system [3] used for SAR in mountainous regions, that has been tested and developed to potentially use the ship's own navigation radar (S-band at 2.9–3.1 GHz) as the illumination source for locating both passive and active tags and can be seen as an SAR extension to an on-board solid-state radar. Furthermore, the integration of the SRS component with an X-band maritime navigation radar system is shown in this paper. The SRS functionality is based on the “Stepped Frequency CW (Harmonic) Radar” (SFCW) principle [Reference Entsfellner and Heuermann4–Reference Gallagher6], to perform complex-valued mixed-frequency transfer function measurements. The frequency conversion at the target is achieved by very low-cost tags that can eventually be integrated into clothing, life jackets, and life rafts. These tags are either purely passive, using only the illumination signal power, for detection up to a range of just under 1 km, or active, with a demonstrated range of almost 6 km.
The outstanding feature of a harmonic radar(HR) system in the maritime SAR environment is its inherent clutter rejection, as the receiver only detects the second harmonic generated from the transmitter's fundamental frequency illumination signal by the non-linear response of the tag and strongly rejects the otherwise dominant linear reflections, or clutter, on the fundamental frequency caused by waves or heavy rainfall. The correlation of the (SFM-) CW ranging waveform is preserved in the frequency conversion process, which can in turn be used to suppress other in-band non-correlated interfering signals in the RX-band using digital signal processing and filtering [Reference Harzheim7].
The harmonic radar equation and harmonic SFCW ranging
In order to understand the operation of a SFCW HR system operating in the frequency domain, it is beneficial to analyze the two components of the harmonic return signal phasor, its amplitude or power and its phase argument conveying the range information, separately.
According to [Reference Gallagher6, Reference Gallagher, Mazzaro, Martone, Sherbondy and Narayanan8], the harmonic return signal power P RX,2 at the receiving antenna feed point of the interrogator can be calculated using the HR equation by evaluating

using the non-linear pseudo harmonic radar cross-section (RCS) σ2 of the tag defined as

with G RX,2 for the gain of the interrogator harmonic receiver antenna, G TX for the gain of the interrogator's fundamental frequency illumination signal antenna, G RXT for the gain of the tag's illumination signal reception antenna, and G TXT for the gain of the tag's harmonic re-transmission antenna. Furthermore, λ1 and λ2 denote the free-space wavelengths of the illumination and harmonic return signals, while R denotes the slant range between the interrogator and the tag. Finally, P TX denotes the input power at the interrogator's illumination signal transmit antenna feed point, while d 2 describes the harmonic conversion efficiency of the doubler in the HR tag. A graphical representation of all these key HR system variables is shown in Fig. 1, while an extensive experimental validation of the validity of equation (1) can be found in [Reference Harzheim7, Reference Gallagher, Mazzaro, Martone, Sherbondy and Narayanan8].
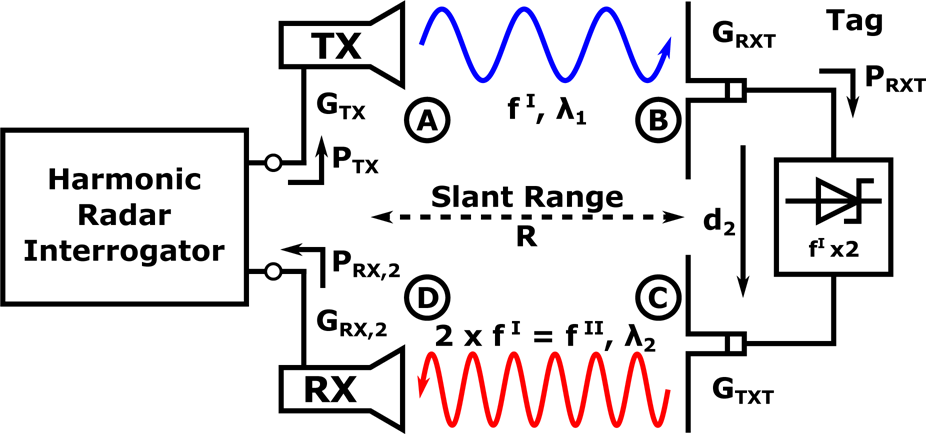
Fig. 1. Simplified schematic diagram of a harmonic radar system using a Schottky diode frequency doubler in the tag.
When comparing equation (1) with the classical (monostatic) radar equation, two important observations fundamental to the optimization of HR systems can be made. The first is the different proportionality of the return signal strength for a given system and constant RCS target when the transmission power or range to target is varied – the HR return signal

for a standard primary radar system. Additionally, it is easily observed that all fundamental frequency signal path components up to the input of the tag's frequency doubler show a square law dependency with regard to the harmonic return signal, which is caused by the non-linear input power-dependent transfer function of the doubler circuit.
An important metric for optimizing the non-linear frequency doubler is the actual received power P RXT at its input. P RXT can be calculated by combining the normal one-way path loss formula to calculate the illumination field strength at the slant range R and the effective antenna area of the fundamental frequency receiving antenna of the tag in the form of

when omitting negligible loss contributors, such as the insertion loss of the transmission lines on the PCB.
Real non-linear frequency doublers are however far from ideal components. An important behavior, which is often neglected in HR publications, is the effect of harmonic output power compression and saturation caused by the onset of large-signal operation of the non-linear element at elevated input power levels. The onset of conversion gain compression and harmonic output power saturation define a hard boundary condition for the validity of equation (2) and in turn equation (1), depending on P RXT and the doubler's properties. A visualization of the impact of harmonic power saturation upon key parameters of a HR tag is shown in Fig. 2. Additionally, an exemplary evaluation of equation (1), including a numerical simulation of frequency doubler harmonic saturation effects upon the non-linear RCS of the tag in equation (2) using the tag performance presented in Fig. 2, is shown for a typical short-range HR interrogator system in Fig. 3 for different illumination signal power levels over HR-tag slant range.

Fig. 2. Visualization of the effects upon key harmonic radar tag parameters caused by harmonic output power saturation of the non-linear element.

Fig. 3. Visualization of the results obtained by a numerical evaluation of the harmonic radar equation including frequency doubler saturation for an exemplary short-range HR interrogator system for different illumination signal power levels over tag slant range.
The SFCW ranging waveform consists of a list of N discrete sinusoidal CW waveforms of frequencies $f_1\ldots\, f_N$ which are transmitted sequentially, i.e. stepped, as the illumination signal. This waveform is essentially identical to the stimulus signals used for S-parameter measurements performed by a VNA and can be described as a time-dependent frequency series f(t) in the form of

with t Point = t Sys. + t TOF + t Dwell + t Acq., which is used for the frequency deviation of the illumination signal

with A 0 as the initial signal amplitude, φ0 as an unknown but repeatable phase offset unique for each frequency point. t Sys. captures the sum of all system delay components that are required to change the frequency, for example, PLL lock times. t TOF represents the maximum expected time of flight of the signal itself, t Dwell is the time required for the settling of all RX filter responses and finally t Acq. accounts for the time required by the interrogator to acquire the signal with sufficient accuracy and resolution.
In order to understand the frequency domain phase argument of the harmonic SFCW radar return signal, it is helpful to evaluate its progression through the signal chain at distinct points A to D in the system, as highlighted in Fig. 1. For the sake of compactness, the expression y(i) is used to denote the argument of the wave function at point i and the progression of the signal amplitude is purposefully omitted.
Beginning at point A, which corresponds to the illumination signal at the interrogator's TX antenna, the argument of the signal is equivalent to the argument of equation (5), and therefore

With the phase propagation velocity $\nu _p = c_0 ( \sqrt {\varepsilon _r \mu _r}) ^{-1}$ and the assumption of propagation in a loss-less medium, the phase propagation constant β1 at the fundamental frequency f I = f(t) can be calculated and used in combination with the slant range R to determine the argument of the wave at the tag's RX antenna at position B, yielding

When a memory-less power series approximation of the frequency doubler's square transfer function is assumed [Reference Gallagher6, Reference Harzheim7], the instantaneous phase is doubled by the non-linear element in addition to its frequency, therefore

On the return trip back to the interrogator, the signal is now doubled in frequency and the phase progression over distance therefore follows the phase propagation constant β2 at the harmonic frequency f II with


When a non-dispersive propagation medium is assumed, νp(f) = const. and the substitution f II = 2 · f I is used, equation (10) can be rewritten to

which can be rearranged to the more convenient form

From equation (12) it is obvious that the slant range to the tag can only be determined by measuring the illumination signal y(A), as the initial phase offset φ0 is still present in the argument of the harmonic return signal.
In order to remove this component, it is beneficial to rephrase this problem into a mixed frequency S-parameter measurement [Reference Heuermann9] in the form $\angle S_{21}^{II, I} = y( D) / y( A)$ , which would completely remove the illumination signal component while leaving the range information untouched, when an ideal non-linear measurement system is used. Unfortunately, most frequency domain measurement architectures cannot perform CW frequency hopping while also providing a repeatable signal phase [Reference Harzheim7, Reference Heuermann9]. This in turn introduces a new phase offset component φLO capturing these random offsets often caused by fractional-N synthesis, and therefore a residual (random) phase error $\varphi _\Delta = \varphi _0 - \varphi _{\rm LO}$
 remains, which results in the expression

In classical non-linear VNA measurement systems, elaborate phase corrections schemes combining LO-coupled vector receivers in addition to an external harmonic phase reference connected to a dedicated receiver are used to correct for this residual random phase error, as shown on the left side of Fig. 4. Details about this correction can be found in [Reference Heuermann9]. Due to recent developments in integrated Fractional-N synthesizer phase repeatability by implementing a phase-resync procedure to an external reference clock, φLO can be made repeatable during the power-on time of the interrogator.

Fig. 4. Schematic diagram comparing the harmonic radar interrogator built as a classical non-linear VNA using a phase reference for receiver LO and synthesizer output phase correction and the new approach using time-invariant phase and amplitude repeatable synthesizers.
This enables the removal of the now repeatable, but unknown, initial phase offset $\varphi _\Delta$ from equation (13) by performing the measurement $S_{21, \text {Ref}}^{II, I}$
 of a non-linear calibration target at a known distance R Ref to normalize the actual measurement results $S_{21, M}^{II, I}$
 , resulting the expression

for the argument of the normalized received harmonic return signal. The interrogator architecture can be further simplified by employing these synthesizers in combination with a precision automatic-level control loop for the generation of I TX(t) in equation (5), enabling a time-invariant repeatable generation of the illumination signal [Reference Harzheim7]. In such an architecture, measuring the mixed frequency S-parameter

with $a_{1}^I$ denoting the outbound fundamental frequency signal and $b_{2}^{II}$
 the harmonic return signal, the normalization of the HR measurement to the calibration measurement at a known R Ref leads to the expression


and therefore allows the reduced interrogator architecture shown on the right side of Fig. 4, as no direct measurement of $a_{1}^I$ is required at any time. The reduction to only one vector receiver used exclusively for the harmonic return frequency range also simplifies the isolation of the receiver from the high-powered illumination signal and inadvertent local harmonic generation in the receiver front-end.
The maximum unambiguous distance for a given frequency spacing Δf can be calculated by extending the procedure introduced in [Reference Gallagher6] for the nomenclature used here by considering the measurement of two frequency sampling points f 1 and f 2 at a given slant range R. Then the angle of the mixed frequency S-parameter measurement results $( S_{21}^{II, I}) \vert _{f_1}$ and $( S_{21}^{II, I}) \vert _{f_2}$
 can be described using equation (14) by


which must adhere to a phase distance between frequency sampling points of

to avoid range aliasing due to angular ambiguity. When equations (18) and (19) are inserted into equation (20), this results in

which can be rearranged in order to express the frequency step-size $\Delta f = f_2^I - f_1^I$ to
to

The maximum unambiguous range R max can now be calculated from equation (22) by solving for R max using the upper unambiguous phase advance limit of 2π, yielding

When classical complex IDFT time domain transformation radar signal processing is applied to the acquired frequency domain data, the range resolution ΔR of the harmonic SFCW radar system can be directly determined from equation (23) by dividing both sides of the equation by the amount of sampling points N, yielding

It is important to note here that the discrete SFCW frequency domain sampling used to acquire the data using the stepped frequency sweep f(t) is equivalent to a rect(f) brick-wall band-pass filter in the frequency domain. In order to avoid false target detection adjacent to a valid harmonic return due to sinc(x)-sidelobes caused by the brick-wall filter transformation, a suitable window function must be applied to the frequency domain sweep data prior to the IDFT time domain transformation.
Design of the harmonic radar tags
The passive harmonic radar tag
The passive tag only consists of two antennas, planar transmission lines and a diode as the sole SMD and can therefore be manufactured very inexpensively in large quantities. Combined with their indefinite shelf-life, this makes these tags very attractive for large-scale deployments such as on cruise ships. An earlier prototype of this tag still containing lumped elements is shown in Fig. 5, while Fig. 6 shows the final version of the tag where both antennas are matched to the optimal impedance of the Schottky diode using distributed transmission line elements.

Fig. 5. Picture of the first passive Schottky diode harmonic radar tag doubler prototype still containing lumped element passive components, as used for initial verification and tests of the system (antennas not shown).

Fig. 6. Top and bottom side view of the final passive tag design showing the S-band input antenna, the Schottky diode frequency doubler, and the C-band output antenna. G RX = 3 dBi H-polarized, G TX = 2 dBi V-polarized.
The initial design of the tag was obtained by following the design guides for creating passive Schottky diode-based frequency doublers for HR tags presented in [Reference Presas, Weller, Silverman and Rakijas10–Reference Rasilainen, Ilvonen, Hannula and Viikari12]. The simplified schematic of the first generation of the passive tag is shown in Fig. 7. After successive optimizations, both the internal biasing network and the discrete SMT capacitors could be omitted while still showing sufficient performance, leaving only distributed planar elements on the PCB. A S-band input impedance of 50 Ω and a C-band output impedance of 36 Ω were used for the doubler design to facilitate a direct connection to the tag antennas without additional matching circuits, while still allowing for a 50 Ω instrument-based coaxial characterization of the circuit with reasonable return loss (15 dB) on the output side.

Fig. 7. Schematic of the first passive harmonic radar tag showing the matching, filter, and bias network of the Schottky diode.
A planar folded dipole S-band antenna with an associated planar balun (G RX = 3 dBi) and a C-band λ/4 monopole antenna (G TX = 2 dBi) were developed by the Fraunhofer FHR for integration into the PCB layout. The tag is built upon a two-layer 20 mil (0.512 mm) thick Isola Itera-MT microwave substrate.
The HSMS-286F diode from Avago is used as the non-linear element in this design. Starting with the conjugate matching for the two relevant frequency ranges (2.90–2.95 and 5.80–5.90 GHz), the conversion gain was improved further by harmonic balance simulation in Keysight ADS, followed by empirical on-board optimizations to account for part and process variations. The conversion loss of the frequency doubler was measured using SMA connectors attached to the connector footprints visible on the bottom side of the PCB. The resulting harmonic conversion gain values are shown in Fig. 8 as a function of received fundamental illumination signal frequency and input power to the Schottky diode doubler circuit. A peak conversion gain of -12.0 dB for an input power of -2 dBm at 2918 MHz was obtained for the tag.

Fig. 8. Measured conversion gain (S-band to C-band) of the final passive tag over frequency and received illumination signal input power.
Additional experiments to improve the conversion efficiency of the HSMS-286F doubler by applying an external active diode bias, as proposed in [Reference Tahir and Brooker13], were carried out with the earlier lumped element-based version of the circuit shown in Figs 5 and 7. However, no significant performance increase that would justify the use of an on-board power source could be observed for this configuration.
The active low-power BJT frequency doubler
While the diode biasing experiments yielded no significant results, these led directly to the idea of using a BJT with very low collector current as the non-linear element of the HR tag. The aim was to obtain a positive conversion gain for some range of input powers and revert the P RX,2 ∝ R 6 relation of passive doubler-based HR [Reference Gallagher, Mazzaro, Martone, Sherbondy and Narayanan8] back to the P RX ∝ R 4 (or even less) proportionality of a classical primary radar for a given (non-linear) RCS to extend the detection range of the system.
The BFP840FESD HBT from Infineon was chosen for this design due to its combination of high transit frequency at low collector currents and low collector-emitter voltages to allow for a simple 3 V button primary cell as its energy source during testing. In practice, the power requirements are so low that small water-activated primary batteries, e.g. Al-air [Reference Mutlu and Yazıcı14] or Cu-Zn, could be used to allow for long storage times with low maintenance, while still providing instantaneous power in case of an accident at sea.
The design of the active low-power BJT frequency doubler was entirely performed in Keysight ADS using its harmonic balance (HB) simulation core and a SPICE model of the BJT, with the design presented in [Reference Xin and Cheng15] for a 2.5 GHz BJT doubler based upon the BFP640 (I C = 30 mA, V CE = 3 V) used as a starting point. The basic topology of the doubler follows the same design idea of reflective termination for the fundamental frequency at the output and for the second harmonic at the input of the frequency active doubler circuit, as shown in [Reference Rauscher16, Reference Iyama, Iida, Takagi and Urasaki17].
The circuit was then iteratively modified for lower I C and V CE in the HB simulation, while monitoring the onset of H2 conversion gain at 5850 MHz via an input power sweep at 2925 MHz and performing a stability analysis of the doubler for each iteration. As the collector current was lowered below 5 mA, the instability of the circuit vastly increased to the point of self-oscillation at the harmonic output frequency. A small series resistance (5 Ω) was added to the base of the BJT for negative feedback to counter this effect, as current feedback via an added emitter impedance was found to be ineffective.
Through spectral frequency domain and time domain waveform analysis of the voltages and currents, it was found that the conversion efficiency of the doubler for low drain currents could be vastly improved by introducing higher harmonic (n ≥ 3) termination elements into the circuit, analogous to the harmonic termination schemes used in amplifiers. Stable operation of the doubler was achieved in the HB simulation for the operating point of U CE = 1.5 V, I C = 1.5 mA. The corresponding simplified schematic is shown in Fig. 9.

Fig. 9. Schematic of the non-integrated low power active HBT frequency doubler circuit. HBT Infineon BFP840FESD, U CE = 1.5 V, I C = 1.5 mA. TLF, reflective H1 / H2 transmission line filter stub; TLM, distributed element matching transmission line; TLH, higher order harmonic (3 and up) tuning and termination elements.
It is important to note for the reproducibility of the results that the amount of calculated harmonics for the HB simulation must be increased to very high numbers (in our case up to 50) and robust slow solvers and initial condition calculation procedures must be used to allow the HB simulation to converge because of the extreme non-linearity of the circuit caused by f T = f(U CE) modulation.
A prototype doubler circuit with 50 Ω SMA interfaces for characterization was built based upon the simulation results. A picture of the prototype is shown in Fig. 10.

Fig. 10. Picture of the active stand-alone BFP840FESD BJT S-band to C-band frequency doubler circuit prototype with 50 Ω SMA interfaces.
With empirical optimizations in the actual circuit to account for non-ideal component behavior and tolerances, a peak conversion gain of G max = 24.6 dB for a fundamental frequency input power of P H1 = −46 dBm at 2940 MHz, or G max = 24.1 dB at P H1 = −52 dBm and 2920 MHz respectively, was observed, as shown in Fig. 11. Furthermore, unity conversion gain was observed for an input power as small as P H1 = −85 dBm at 2915 MHz. A maximum saturated harmonic output power of P Sat = −5 dBm was determined for the circuit.

Fig. 11. Measured conversion gain (S-band to C-band) of the active BJT frequency doubler over frequency and received illumination signal input power.
Despite these initially promising results, it was unclear if the active doubler could provide a similar ranging accuracy comparable to the passive tag due to its different transfer function. Fortunately, subsequent extensive ranging test carried out between the passive Schottky diode tag and the active doubler fortunately found no deviation in ranging accuracy for low instantaneous bandwidth SFCW ranging waveforms. When more wide-band pulse-based ranging waveforms are used, a degradation of performance is expected due to fairly narrow-band gain maximum of the active doubler in comparison to a passive diode-based doubler tag. A picture of the active doubler used for these tests with additional external antennas to complete the active HR tag test platform is shown in Fig. 12.

Fig. 12. Picture of the first active stand-alone BJT S-band to C-band frequency doubler tag prototype, without the integrated antennas or an additional LNA. Planar microstrip fed S-/C-band half-wave dipole antennas, ROHACELL radome, and mounting back-plate made by the Fraunhofer FHR. G RX = 5 dBi H-polarized, G TX = 4 dBi V-polarized.
The integrated low-power active harmonic radar tag
After the successful tests of the active doubler circuit, a more compact and integrated version of the circuit was developed in the same basic form factor as the passive tag shown before, with only a slight increase in total height necessary to accommodate for the battery, its PCB mount holder, and a different C-band antenna structure.
Numerical simulations were carried out to find an optimal active tag configuration by evaluating the HR equation for different possible configurations of tag RX and TX antenna gain, BJT doubler gain, compression output power, power budget, and runtime, constrained by form factor of the tag. From these results it was obvious that an additional low current LNA for the fundamental frequency input of the doubler could yield significant advantages in achievable detection range by lowering the threshold for positive conversion gain and increasing the available illumination signal power for the doubler. This is easily explained by the HR equations (1) and (2), in combination with the square-law transfer function of the doubler, as every 3 dB increase in fundamental frequency power at the non-linear element leads to a 6 dB increase in harmonic power returned to the receiver when compression effects are neglected. Additionally, the onset of tag unity conversion gain with regard to the input power is lowered by twice the amount of illumination signal gain provided by the LNA. The additional LNA also uses the BFP840FEESD BJT and is based upon a re-scaled datasheet example for a 2.45 GHz Wi-Fi LNA. Optimization and analysis were again carried out using HB simulations in ADS. A gain of G = 12 dB was realized for a collector current of I C = 1 mA by allowing for a lower saturated output power in the design. Additional negative feedback measures using RC collector-base degeneration and emitter current feedback via distributed inductance were added to enhance stability of the circuit.
In order to achieve the goal of more than 48 h of continuous operation on a single CR2032 coin cell, the active doubler design received some minor modification to allow stable operation with an I C = 1.2 mA. This happened at the expense of some conversion gain and a slightly lower saturated output power. The power requirements of both circuits combined allow for 50 h of continuous operation using a CR2032 battery at a combined current of 2.2 mA.
Both the LNA and the active BJT doubler were integrated into the same footprint as the passive tag at a slightly increased height due to the battery and the change to a C-band ground plane antenna build from UT-085/RG-405 semi-rigid coax to clear the height of the battery required for an omnidirectional radiation pattern. Isola Itera-MT was used in a four-layer stack-up for the prototype. The component side of the tag is shown in Fig. 13, while the top side is shown in Fig. 14.

Fig. 13. Bottom component side view of the active tag showing the HBT active frequency doubler, the HBT S-band LNA, and the S-band planar folded dipole antenna (G RX = 3 dBi).

Fig. 14. Top side view of the active tag showing the S-band planar folded dipole antenna, the CR2032 battery, the deactivation reed switch used during tests, and the raised C-band λ/4 ground plane antenna (G TX ≈ 5 dBi).
The results of the characterization of the integrated low-power active tag are shown in Fig. 15. The measurements were performed using SSMP connectors on the component side of the tag (see footprints in Fig. 13) in a 50 Ω environment. A peak conversion gain G max = 32.2 dB was observed for an input power of − 60 dBm at 2930 MHz. The harmonic output power in compression was measured at − 13 dBm and unity conversion gain was achieved for a fundamental frequency input power of just −101 dBm.

Fig. 15. Measured conversion gain (S-band to C-band) of the active tag over frequency and received illumination signal input power.
Design of the stepped frequency harmonic radar system
System components
The basic signal chain of the SRS section of the radar system is shown as a block diagram in Fig. 16. The transmitter (TX) and receiver (RX) modules used in the system were manufactured by Heuermann HF-Technik GmbH and developed during research previously carried out at the IMP [Reference Harzheim7]. These modules were originally developed as part of a modular VNA system for non-linear S-parameter measurements, but due to the high similarity between harmonic vector transfer function measurements and the discretely stepped SFCW waveform used here, the modules are a drop-in solution for the HR interrogator system.
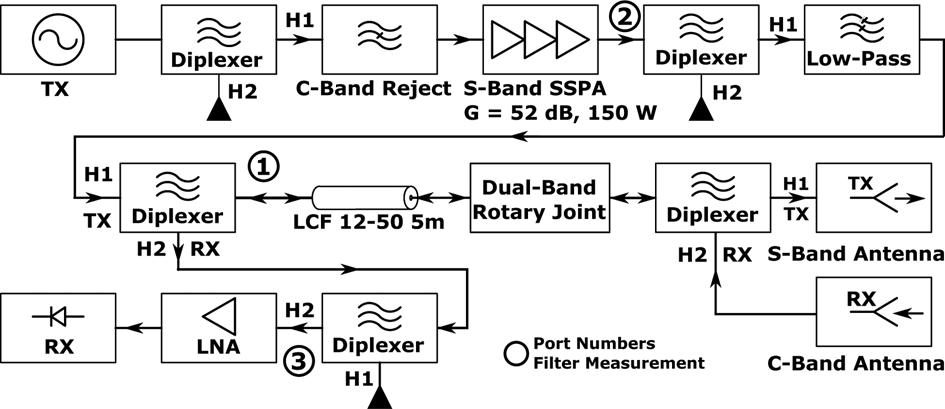
Fig. 16. Schematic block diagram of the S-band/C-band harmonic radar interrogator part of the search and rescue radar system.
A coherent signal generation, detection, correlation, and integration process is implemented in these modules to obtain high receiver sensitivity coupled with suppression of other signals in the harmonic reception frequency band. The RX and TX modules are mounted in separate 19-inch rack slide-in housings with multi-layered EMI-shielding and additional filters between interconnects to increase their RF isolation. The fundamental frequency illumination signal amplification is performed by a commercial off-the-shelf (COTS) S-band 150 W CW solid-state amplifier from Saras Technology with additional harmonic EMI-shielding added to the rack-mount enclosure and fan air ducts using fine copper mesh and conductive copper tape.
A picture of the interrogator system, including the high-power filters, the rack, the coaxial calibration target, and a custom very high IP2 C-band LNA including additional S-band rejection, is shown in Fig. 17.

Fig. 17. Picture of the harmonic radar interrogator part of the system with key components highlighted. (a) Gearbox rotation controller and interface, (b) C-band receiver module, (c) S-band small signal transmitter module, (d) Saras S-band 150 W CW solid-state amplifier, (e) Coaxial non-linear calibration target, (f) High-power absorptive diplexer low-pass filter, (g) Reflective distributed coaxial element low-pass filter, (h) S-band/C-band RX/TX diplexer, (i) High-IP2 C-band LNA.
Harmonic filtering using a combination of reflective low-pass and absorptive diplexer-based low- and high-pass filters is used at various points in the signal chain to achieve a harmonic system dynamic range in excess of 185 dB while radiating in the full system configuration. Absorptive filters are used to avoid both unintended harmonic load-pulling of the PA and mutual adverse interaction of the filter stop-band responses [Reference Narayanan, Gallagher, Mazzaro, Martone and Sherbondy18]. All large signal diplexers use custom low PIM filters built and designed by Rosenberger Hochfrequenztechnik, while the small signal diplexers use a planar narrow-band high isolation transmission line diplexer topology developed by the IMP. The measured performance of the harmonic suppression and diplexer filters, with port numbers referenced from Fig. 16, is shown in Fig. 18. A harmonic output suppression of 130 dB and a PA to LNA isolation of 129 dB in the S-band and 144 dB in harmonic C-band were achieved by the filters, which is essential for long-range HR operation to avoid desensitization and suppress local harmonic generation in the receiver.

Fig. 18. Selected measured S-parameters of the absorptive PA harmonic filter and front-end signal ways. S-parameter port numbers are referenced in Fig. 16. Plot (a) S-band PA to rotary joint connector, S-band, IL = 0.7 dB at 2.925 GHz. (b) S-band PA to rotary joint connector, C-band, Harmonic suppression 130 dB at 5.85 GHz. (c) PA to harmonic LNA input, S-band, isolation 129 dB. (d) PA to harmonic LNA input, C-band, isolation 144 dB at 5.85 GHz. (e) Rotary joint connector to harmonic LNA, S-band, isolation 142 dB at 2.925 GHz. (f) Rotary joint connector to harmonic LNA, C-band, IL = 1.6 dB at 5.85 GHz. R&S ZVA67, UOSM 3-port cal., RBW 1 Hz, 100x Coh. AVG, P = 10 dBm.
An interrogator dynamic range of more than 200 dB can be demonstrated when the signal is terminated into a Rosenberger high linearity low-PIM load after the RX/TX diplexer. This dynamic range was also possible while radiating by omitting the weakly non-linear dual-band rotary joint in the signal path – which is obviously only possible with a stationary antenna. The initial ranging calibration of the system is performed with a coaxial non-linear target that is inserted at a known electrical length in the combined S-band/C-band signal path with the illumination signal terminated in a Rosenberger low-PIM load.
The dual-band HR interrogator antenna, with a gain of 27 dB for both bands, matched horizontal beam widths of 1.9° and vertical beam widths of 27° and orthogonal S-/C-band polarization, was developed, built, and tested by the Fraunhofer Institute for High Frequency Physics and Radar Techniques (FHR) for this application. Background information on a smaller prototype of this antenna can be found in [Reference Badawy and Bertuch19] and for the final antenna used here in [Reference Badawy, Kremring, Nulwalla and Bertuch20]. The S-band illumination signal is transmitted in horizontal and the C-band harmonic response is received in vertical polarization by the antenna. The EIRP of the illumination signal for the configuration presented here is PEIRP ≈ 76 dBm.
The rotation and positioning of the antenna is performed by a Raytheon Anschütz S-band radar gearbox and T-bar assembly. The assembly is modified for coaxial interfacing and fitted with a purpose developed dual-band coaxial rotary joint assembly developed and manufactured by Raytheon Anschütz. The antenna azimuth position is controlled by a custom gearbox controller interface developed by the IMP to correlate the HR data with the current interrogator antenna beam vector and close the azimuth control loop for the SRS radar system.
The data acquisition, threshold detection, and first-stage plan position indicator (PPI) plotting is done by a custom MATLAB software developed by the IMP. In the last system expansion stage used for the final experiments at sea, valid HR contacts are then forwarded as a NMEA 0183 tracked target message (TTM) over Ethernet to a Raytheon Anschütz X-band maritime navigation radar control system to demonstrate automatic intercept rescue maneuver course planning and sensor data fusion with the X-band radar returns in the navigation radar PPI.
A summary of the key HR interrogator system parameters is summarized in Table 1 and a summary of the SFCW waveform parameters and settings used for the experiments is presented in Table 2. A maximum illumination signal bandwidth of 50 MHz with up to 401 discrete frequency points are supported by the system.
Table 1. Overview of the key parameters of the harmonic radar interrogator system used for the experiments

Table 2. Overview of the key SFCW harmonic radar signal parameters used for the experiments with the passive and integrated active tag

The harmonic radar front-end LNA
In an earlier version of the system presented here, a standard wide-band MMIC gain block (GVA-123+) was used as the C-band reception front-end amplifier. During early system verification measurements it became however very apparent that the IIP2 of the amplifier was not sufficient and reduced the capability to detect targets significantly. Even when excessive filtering was added to the input, local harmonic generation was still observed in significant amounts, most likely caused by fundamental frequency DC supply injection and coupling by the bias tee.
While some second harmonic generated locally in the LNA by fundamental frequency breakthrough can be countered by signal processing, it nevertheless reduces the overall dynamic range of the system and the ability to detect low-power target returns [Reference Narayanan, Gallagher, Mazzaro, Martone and Sherbondy18]. Additionally, a high amount of return power in the first SFCW IFFT range bin can lead to false target detection in other range bins due to side lobes caused by the brick wall discrete frequency domain filter function of the SFCW process. This especially also affects the range bins near the maximum SFCW unambiguous range by time domain aliasing, therefore masking valid weak tag returns at longer slant ranges.
In order to mitigate this effect, a highly linear C-band LNA with absorptive S-band termination and high illumination signal suppression was developed for this system. A simplified block diagram of this LNA used in the experiments is shown in Fig. 19, while a picture of the prototype without its enclosure is presented in Fig. 20.

Fig. 19. Signal path block diagram of the high-IP2 harmonic radar C-band LNA showing the S-band signal termination and suppression measures, the balanced configuration, and the active control of the LNA bias in combination with an output peak envelope power detection and lock-out circuit to protect the connected harmonic radar receiver circuit from excessive input signals (P Trip ≈ 7 dBm, P Out,Sat. ≈ 31 dBm, P RX,max = 13 dBm).

Fig. 20. Annotated picture of the high-IP2 harmonic radar C-band LNA with S-band termination and suppression. (a) Input S-/C-band diplexer with S-band termination, (b) C-band 180° input balun, (c) Reflective λ/4 S-band transmission line stub filters, (d) High-power, high linearity, C-band LNAs, (e) Reflective C-band LTCC band-pass filters, (f) Wideband (S-/C-band) 180° output balun, (g) Planar, high directivity, 20 dB saw-tooth transmission line coupler, (h) Peak envelope output power detector (VBW = 45 MHz), (i) LNA bias control, power comparator, and latch, as well as system support and integration circuits.
At its core, the LNA is built upon a balanced topology using two cascaded Guerilla RF GRF5511 high-power LNA gain stages in a narrow band 5.85 GHz tuning in each half of the amplifier. As each of the LNA MMICs is capable of a P Sat. ≈ 29 dBm, a large linearity headroom in the form of output power back-off is present in the signal path.
The input of the amplifier consists of a S-/C-band LTCC diplexer with a resistive termination for the S-band. This is followed by a narrow-band LTCC C-band balun with good reflective rejection properties for the S-band. Any residual S-band input signal is then further attenuated in each half of the balanced topology by a λ/4 open circuit transmission line stub filter. An additional reflective LTCC C-band band-pass filter is used to attenuate any residual amplified input or power supply coupled S-band components after each amplifier stage. Finally, both balanced signals are combined by a wide-band balun covering both bands using the argument that at this point in the signal chain, it is valid to assume that all residual fundamental frequency signals must have entered via the power supply lines of the LNAs. Length-matched star routing is used for both the bias and the power supply lines of the LNAs; therefore, it can be expected that most of the residual S-band signals entered via this path are in phase and will be canceled out by the wide-band 180° balun, hence lowering the amount of unwanted S-band reaching the HR C-band receiver.
As the balanced LNA configuration can achieve a P LNA,Sat. ≈ 31 dBm including losses, a protection scheme for the harmonic receiver (P RX,max = 13 dBm) is strictly necessary to prevent accidental destruction of the RX front-end by a tag in the direct vicinity of the interrogator antenna or other strong in-band signals. PIN diode limiters are generally used in normal radar systems for this exact purpose, but should not be used in HR systems due to their very low IP2. Instead, an active protection scheme consisting of a planar 20 dB micro-strip directional coupler, a high video bandwidth envelope power detector, and a fast threshold comparator, followed by a re-triggerable monostable multi-vibrator controlling the bias voltage of the LNAs, is used to provide safe RF blanking period for the receiver. The protection trips within less than 10 μs when an instantaneous output power level of +7 dBm is exceeded. While an automatic reset of the protection circuit after a time delay is implemented, the LNA was only operated with an additional safety latching function requiring a manual reset after tripping.
The measured unidirectional S-parameters of the LNA are shown in Fig. 21. A peak gain of G H2 = 29 dB in the C-band was achieved, while providing a S-band rejection of G H1 = −68 dB, resulting in gain advantage of ΔG H2,H1 = 97 dB for the tag's return signal. The IP2 of the LNA could unfortunately not be measured, because no significant harmonic generation from a low-pass filtered S-band input signal at 2.925 GHz could be observed on the spectrum analyzer (FSV7) at the LNA's output up to the maximum output power (+13 dBm) delivered by the signal generator (SRS SG384) used for this test.

Fig. 21. Measured unidirectional forward S-parameters (S 11, S 21) of the high-IP2 harmonic radar C-band LNA.
Passive harmonic radar system component considerations
High dynamic range HR system design is a challenging task due to the inherent non-linear effects present in all real components, as also mentioned in [Reference Narayanan, Gallagher, Mazzaro, Martone and Sherbondy18]. While this at first glance only matters for the active components of the interrogator system, such as the amplifiers, receivers, and signal generation, the IP2 of passive components in the system, such as cables, connectors, filters, and materials used for the antenna and other components, quickly becomes important as well when the peak envelope transmit power of the interrogator is increased.
In communication system engineering, the passive IP2 is generally neglected in the characterization of components in favor of the much more important passive IP3 to avoid out-of-band interference or degradation of multi-tone signals by passive intermodulation (PIM).
While a strong correlation between passive second- and third-order non-linear effects is not well established, it is in our experience advisable to only use components with PIM specification in the large signal path of the system. Furthermore, the PIM level specification in the datasheet can at least be used as a guideline when choosing between different components.
When components for the system are built from scratch, it is certainly wise to adhere to well-established practices of low-PIM design. Weak passive non-linearities can arise from a wide range of phenomena such as metal to metal junctions [Reference Quiles21], conductor surface roughness [Reference Ansuinelli, Schuchinsky, Frezza and Steer22], coaxial connector type [Reference Henrie, Christianson and Chappell23], connector torque or contact pressure [Reference Jin, Gao, Bi and Zhou24], electro-thermal heating effects [Reference Wilkerson25], and unsuitable galvanic surface finishes containing ferromagnetic nickel as a diffusion barrier [Reference Ng, Islam, Alevy, Mansor and Su26], such as ENIG.
By rule of thumb, it is advisable to re-use COTS equipment certified for LTE or 5G base stations. This especially includes cables, terminations, attenuators, and connectors. Connectors with flash gold plating, which applies to most of the general purpose SMA connectors, should only be used when there is no large fundamental frequency signal present due to the presence of a nickel diffusion barrier.
In hindsight, the authors recommend the exclusive use of special low-PIM RF connectors throughout the large signal part of the system. This includes 7–16 DIN connectors for frequencies up to 6 GHz, 4.3–10 connectors for up to 12 GHz, and the new NEX10 connectors for up to 20 GHz. While some components presented here use N connector interfaces, they were found to be a constant source of struggle and harmonic interference. The full dynamic range of the system could only be achieved when the elastomer gaskets in the N plugs were removed and a strict cleaning schedule using isopropanol and dried compressed air was maintained after each removal of the connection. Furthermore, the N connectors had to be slightly over-torqued and kept well away from any other mechanical stress and strain, which necessitated additional fixtures for filters, connectors, and cables. None of these issues were observed for the components using 7–16 DIN connectors.
Several inadvertent harmonic generation problems were also encountered with the support of electronics of the antenna gearbox and azimuth positioner assembly due to minor RF leakage of the coaxial dual-band rotary joint. Extensive additional external shielding, including bypass capacitors, feed-through capacitors, and RF foam absorber material had to be added to various assemblies, such as the photo-interrupter and the optical incremental encoder used for position feedback, to avoid harmonic generation by coupling to PN-junctions on their PCBs.
While all coaxial components could be tested for linearity using the interrogator system itself by using the high-power Rosenberger low-PIM load with the components in line, it was unclear, if the S-band illumination signal antenna itself was linear enough to avoid harmonic generation. Therefore, a radiated harmonic energy false target detection test was performed by placing a trihedral corner reflector with an S-band RCS of $\sigma _{f^I} = 13.67\, \text {m}^2$ and a C-band RCS of $\sigma _{f^{II}} = 54.68\, \text {m}^2$
 in the main lobe of the dual-band antenna at various distances to simulate superstructures of a vessel in the vicinity of the antenna, as shown in Fig. 22. The only false target return exceeding the detection threshold by this setup was generated at a reflector distance of only 3 m, which would be well within the spatial safety limit of the rotating antenna. It is likely that this return was generated by weak non-linearities in the reflector itself by high surface currents.

Fig. 22. Radiated harmonic energy false target detection test performed using a trihedral corner reflector with an RCS of $\sigma _{f^I} = 13.67\, \text {m}^2$ , $\sigma _{f^{II}} = 54.68\, \text {m}^2$
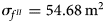 , placed in the main lobe of the antenna. View from antenna bore-sight. T-bar, gearbox, the output of the coaxial dual-band rotary joint, the antenna diplexer, and the two separate coaxial feeds to the dual-band antenna visible in the picture.
Antenna polarization, signal propagation, regulatory, and spectrum usage aspects
The choice of horizontal illumination signal and vertical harmonic return signal polarization (HV) was made based upon propagation simulations over sea water carried out by the Fraunhofer FHR, combined with regulatory and practical considerations. When considering the simulation results alone, a fully vertically polarized system (VV) would yield considerably better results than an (HV) or (HH) polarized system due to the lower susceptibility to multi-path and especially destructive wave interference caused by reflections from the seawater.
In these simulations, carried out for an interrogator antenna height of 10 m and a tag antenna height of 0.2 m over seawater, representing a tag fixed to an inflatable flotation device, an increase in received S-band illumination signal strength of 12 dB at a distance of 1000 m was observed when switching from the horizontal to a vertical signal polarization. This clear advantage of the vertical polarization even increased to a difference of 16 dB at a range of 5000 m, which would lead to a very significant increase in return signal strength due to the square law dependency of the harmonic return power from the illumination signal, as shown earlier in equations (1) and (2). A similar advantage of the vertical polarization was also observed for the C-band harmonic return signal.
Technological advancements and new inventions are however often bound to existing legacy infrastructure, conventions, and regulatory aspects – which is also the case here. Existing marine S-band navigation radar systems predominantly use a horizontal antenna polarization thought to reduce the intensity of (sea) clutter at high grazing angles [Reference Parsa and Hansen27–Reference Watts, Baker and Ward29], while providing a stronger radar returns from the predominantly horizontally oriented structures of vessels, especially when seen from the broadside [30], although multi-path fading caused by sea reflections at low sea states is a well-known problem even documented in the relevant standards [31]. No obligatory requirements from the regulatory bodies (IMO, ITU) exist to adhere to a horizontal polarization of the S-band navigation radar signal, although it was officially noted that this is the predominant polarization in use [32].
Based upon this realization, it was decided to go ahead with the horizontal polarization for the illumination signal to allow a dual-use function of the S-band antenna, which is built to IMO and IEC maritime navigation radar specifications [Reference Badawy, Kremring, Nulwalla and Bertuch20]. This was done despite a severe SNR penalty for the HR function at the expected tag height over water. This configuration presented here therefore sets a lower boundary for the achievable system performance. The C-band harmonic return was realized in vertical polarization. The system is designed upon an exclusivity status for the S-band antenna, allowing either maritime navigation using a standard marine S-band radar, including its signal processor tailored for (HH) polarization, or using the S-band antenna to emit the illumination signal of the HR interrogator.
As an S-band maritime navigation radar is always accompanied by at least one X-band navigation radar, according to the IMO International Convention for the Safety of Life at Sea (SOLAS), Chapter V, Regulation 19.2, the non-concurrent operation in the S-band was deemed feasible due to the presence of a distress situation and the availability of the X-band radar for short-range, high-resolution, collision avoidance, maneuver planning, and SAR coordination with other vessels.
The international spectrum coordination of the system is pretty straight forward when an illumination signal frequency range of 2900–2937.5 MHz is used. In the S-band, this signal is completely embedded into the international frequency allocation for S-band maritime mobile navigation radars or radiodetermination services (2.9–3.1 GHz) [33], although the emission of the SFCW waveform could generate a jamming warning in other radar sets, depending on the specific radar signal processor employed. The harmonic return signal then lies in the frequency range of 5800–5875 MHz, which is within the ITU-regulated 5.8 GHz ISM and SRD frequency allocation (RR 5.150, 5725–5875 MHz) [33], allowing international license-free operation of the HR SRS. Since this C-band spectrum is a contested and congested resource and interference, especially from 802.11ac/ax Wi-Fi systems installed on a ship, is likely, it would be beneficial to regulate and coordinate a small window for primary use above 5875 MHz and below 6100 MHz for a system like this via the ITU world radiocommunication conferences and other national regulatory bodies.
Experimental results
System trials on land
The concluding land-based evaluation measurements of the system without X-band navigation radar integration were performed in June 2019 at an auxiliary facility of the Fraunhofer FHR in Wachtberg / Werthoven in hilly agricultural terrain on top of a small hill with the antenna positioned approximately 1.8 m over ground on a trailer. A picture of the system is shown in Fig. 23. Detection range tests were conducted using the passive integrated tag, as shown in Fig. 6, and the active BJT doubler using external antennas, as shown in Fig. 12. The integrated active tag was not yet available for these tests. The location of the interrogator system is marked with a yellow arrow in Fig. 24.

Fig. 23. Picture of the harmonic radar interrogator system including the S-/C-band antenna and the gearbox assembly mounted to a trailer during the final system trials on land at the Fraunhofer FHR in Wachtberg.

Fig. 24. Annotated map of the recorded positions of detected tags in relation to the interrogator position during the land-based harmonic radar system pre-tests carried out with the Fraunhofer FHR in Wachtberg.
A passive stationary reference HR tag was positioned on a stack of hay rolls at a distance of 150 m from the HR interrogator system to provide a continuous indication of system function during the tests.
The maximum range tests with the passive tag were performed by holding the tag at chest height along several points of an agricultural road extending north from the radar system. A tag detection for all antenna azimuth sweeps was achieved for a slant range of 815 m, while a detection for approximately 20 % of the azimuth sweeps was achieved at a distance of 1020 m, as shown in Fig. 24. Larger distances in the same direction were not tried due to insufficient line-of-sight (LOS) caused by the sloping terrain.
The test of the active BJT doubler tag was conducted by attaching the assembly to the underside of a quadcopter UAV, which was launched at a distance of 2175 m to the interrogator and set to a climbing hover until LOS was established. The active BJT tag was detected by the interrogator at the same distance. Further maximum detection range experiments with the UAV could unfortunately not be conducted due to deteriorating weather conditions.
System trials at sea
The final measurements for determining the maximum range under calm sea conditions were carried out on one day in late August 2019 on the Baltic Sea in the Eckernförde bay to the north-west of Kiel from a jetty extending 300 m from the shoreline into the sea. The total height of the SRS antenna mounted upon a trailer was 7 m above sea level. The WMO sea state varied between 1 and 3 during the experiments, with the latter being the abort criterion for the experiments to assure safe navigation of the small sport boat used for deployment of the tags.
Figure 25 shows the setup of the HR system and the additional Raytheon Anschütz X-band maritime navigation radar system used for sensor data fusion demonstration purposes. In addition to the HR tags, the crew of the small boat also used an additional hand-held trihedral corner reflector for X-band radar RCS enhancement when needed to perform independent range measurements.
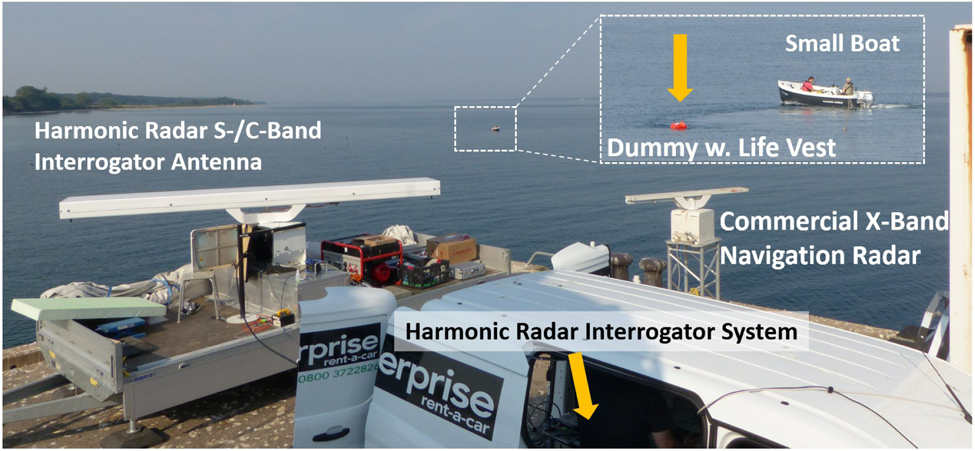
Fig. 25. Picture of the complete experimental setup, showing the harmonic radar S-/C-band system with the interrogator, the dual-band antenna mounted on a trailer, the maritime X-band navigation radar system for reference measurements and data integration demonstration, the boat and the tag and life vest equipped dummy.
A passive reference tag was fixed onto the top of a metal guard rail at a shore installation in a distance of 385 m to provide continuous feedback about the system function during the tests.
The passive tag designed for use in life vests was detected in the experiments involving a weighted body simulator fitted with an inflating live vest including the tags for up to a distance of 1 km (0.54 NM) in the water. The integrated active tag was detected without any interference in the small boat up to a distance of 5.8 km (3.13 NM).
The results of the active tag experiments are presented in Figs 26 and 27. The HR PPI shown in Fig. 26, which is generated by the MATLAB control and visualization software of the HR system, shows the return generated by the active tag in addition to the return of the passive reference tag fixed to a metal shore installation. Figure 27 shows the same measurement from the perspective of the X-band navigation radar PPI software developed by Raytheon Anschütz, clearly showing the NMEA 0183 TTM marker position generated by the HR system for the detected tag return. Several other marine contacts, in addition to a significant amount of land clutter, are visible on the X-band PPI, which is in stark contrast to the HR PPI and shows the effectiveness of the system for the application.

Fig. 26. Screenshot of the harmonic radar control computer screen including the distance and angle of the detected tags and harmonic return power measurement over distance as well as the GPS track points of the measurement series overlaid upon a satellite map of the area.

Fig. 27. Screenshot of the combined results from the SRS determined position, shown here as a NMEA 0183 tracked target message marker, and the X-band radar system data of the small boat at a distance of 5800 m (with the help of the trihedral corner reflector for X-band RCS enhancement).
Several measurements of the active tag were performed along the trajectory of the boat shown in the GPS track in Fig. 27, which are visualized as a scatter plot showing the received harmonic signal strength over measured slant range in Fig. 28. The small sport boat was stopped and anchored, when possible, for these measurements. Nevertheless, a small drift of the boat's position was observed on the X-band navigation radar as well as the S-band HR. A WMO sea state of 2 was prevalent during these measurements.

Fig. 28. Scatter plot showing the received harmonic signal power of all harmonic radar tag returns exceeding the detection threshold at various points along the test trajectory performed by the boat. d i: Distance measured by the X-band radar, n i: Number of total measurements at point i. (a) $d_A = 1.3\, \text {km}$ , n A = 6, (b) $d_B = 1.8\,\text {km}$
 , n B = 10, (c) $d_C = 2\, \text {km}$
 , n C = 4, (d) $d_D = 2.4 \, \text {km}$
 , n D = 9, (e) $d_E = 2.9 \, \text {km}$
 , n E = 9, (f) $d_F = 2.9 \, \text {km}$
 , n F = 3, (g) $d_G = 3.5 \, \text {km}$
 , n G = 5, (h) $d_H = 4.3 \, {km}$
 , n H = 7, (i) $d_I = 5.1 \, {km}$
 , n I = 6, (j) $d_J = 5.8 \, {km}$
 , n J = 12.
Two distinct types of measurements are shown in Fig. 28. A first series, where the tag was held at approximately 10–20 cm from the waterline, mimicking the position of the tag on the inflatable live vest in the water, as shown in Figs 29 and 30, and a second series, where the tag was positioned at the height of the boat's railing at approximately 30–50 cm, depending on the wave height. The transition between these to heights was performed at a distance of d E = d F = 2.9 km, when the detection probability rapidly decreased to 55 % for tags close to the waterline.

Fig. 29. Picture of the weighted body simulator wearing the inflatable life jacket floating in the water. Tag position highlighted, distance of the tags to the waterline approximately 20 cm.

Fig. 30. Picture of the waterproofed passive harmonic radar tags in a vacuum bag sealed milled Styrodur enclosure, fixed to the inflatable life jacket with velcro tape, worn by a weighted body simulator used for maritime search and rescue trainings. S-band azimuth coverage planes of the tags highlighted.
Selected HR A-scope plots (return intensity over distance) for each of the positions A to J are shown in Fig. 31, separated into two plots by the tag to waterline distance. Measurements at the points A–H were performed with SFMCW signal parameters corresponding to an unambiguous R Max = 4675 m initially thought to be sufficient for the experiment. Due to the very good results achieved at position H, d H = 4.3 km, these were changed to the settings shown earlier in Table 2.

Fig. 31. HR A-scope plots of selected active tag returns at specific points along the test trajectory performed by the boat. Intensity shown relative to the initial calibration of the interrogator using the coaxial non-linear target. Upper plot: Active tag held just above the waterline. Lower plot: Active tag held at the boat's railing height. d i: Distance as measured by the X-band radar. $d_A = 1.3 \, \text {km}$ , $d_B = 1.8 \, \text {km}$
 , C: $d_C = 2 \, \text {km}$
 , $d_D = 2.4 \, \text {km}$
 , $d_E = 2.9 \, \text {km}$
 , $d_F = 2.9 \, \text {km}$
 , $d_G = 3.5 \,\text {km}$
 , $d_H = 4.3 \, \text {km}$
 , $d_I = 5.1 \, \text {km}$
 , $d_J = 5.8 \, \text {km}$
 .
.
Two important observations can be made in the plots shown in Fig. 31. The first finding is the fairly large SNR of approximately 21 dB still present at position J, $d_J = 5.8\, \text {km}$ , with regard to the A-scope noise floor. As this was the furthest position where tag detection could be achieved, this hints at a problem with the local peak finding algorithm used for target discrimination and detection at greater distances could have been possible, but were not classified as such. This is possibly connected with the second phenomenon shown in Fig. 31, which is the elevated harmonic signal power of +10 dB compared to the noise floor in the first and the last few range-bins. This was caused by residual non-linearities present in the dual-band rotary joint of the system, affecting the first bins, and subsequent range aliasing affecting the bins close to R Max.
The aforementioned reduction in performance for a horizontal polarized illumination signal close to the surface of the water is easily visible in the 6 dB increase in received harmonic signal power strength when the tag's height over water was increased at d E = d F = 2.9 km. Furthermore, it is easy to see that the measurements of the tag close to the surface show a much larger variance in return signal power, despite a higher absolute median power and SNR, compared to the measurements performed at higher distances with an increased tag height. This provides additional evidence for the fading effects at high grazing angles associated with horizontal polarization in this application.
It would have been beneficial to perform the same trajectory twice using one of each tag heights over water to obtain more insights into this predicted effect, but the low top speed of the boat in combination with administrative time constraints of the facility where the measurements were performed only allowed for one round trip in total, which is the reason this approach was followed.
Discussion of the results
While the topic of HR is now approaching more than 40 years of research, only a few actually built systems that were able to successfully exceed a tag detection slant range of more than 100 m were reported in literature. All of these long-range HR systems were developed and purpose-built for the application of tracking insect movement and behavior and were often not covered in radar and microwave literature. Thankfully, an extensive overview over the current and historical advancements in HR can be found in [Reference Mazzaro, Martone, Ranney and Narayamam34, Reference Mazzaro, Gallagher, Sherbondy and Martone35], which was used in addition to our own literature review for the overview of long-range HR systems shown in Table 3.
Table 3. Overview of the key parameters of other harmonic radar interrogator systems that exceeded a detection range of 100 m [Reference Mazzaro, Martone, Ranney and Narayamam34, Reference Mazzaro, Gallagher, Sherbondy and Martone35]

When looking at the compiled data, it is strikingly obvious that all of these systems used a high peak power pulse-based (modulated) ranging waveform in addition to an illumination signal operating frequency in the marine navigation radar X-band. This choice is understandable, as it allows to re-purpose marine COTS pulse magnetrons, antennas, and components for the interrogator and the higher frequency allows to more easily meet the size and weight limitations for the tags and their antennas imposed by the insects.
The system presented here is free from both of these restrictions and can use higher gain antennas or even small active elements and batteries for the tag, therefore a direct comparison between systems would not actually be fair. The comparison with other HR systems is complicated even further by the fact that, up until now, no SFCW-based HR system was able to compete with high peak power pulse radar waveform approaches for distances above 100 m due to linearity and dynamic range problems at elevated CW transmit power levels.
Nevertheless, it is safe to say that the SFCW HR system presented here, with an P EIRP,Peak of 77 dBm, and coupled with a much more spectrum-efficient ranging waveform than a pulse-based system, significantly advanced the state of what HR – and especially SFCW radar – is able to achieve, considering a maximum demonstrated detection range of 1020 m for passive and 5800 m for active HR tags, which were just introduced extensively in this paper.
It is also important to note that these figures only represent a lower boundary of what is possible using the system presented here. The horizontal polarization used for the illumination signal, chosen for direct compatibility with existing marine navigation radar signal processors and systems, caused a severe reduction of the illumination signal power received by the tag close to the water surface. When a predicted increase of 16 dB received power is assumed for the tag according to the propagation simulations at a height of 20 cm over the water when switching to a (VV) interrogator and tag configuration, then equations (1) and (2) allow the rough estimation that a 3.4 times increase in slant range is possible at high grazing angles with the system presented in this paper. The (VV)-system would result in theoretical maximum detection ranges of up to 3.4 km for the passive and up to 19.8 km for the active tag, ignoring other propagation effects such as the radio horizon for a given interrogator antenna height, under the same conditions.
The presented advancement in the state of HR is especially important for safety-critical applications, as SFCW HR is considerably more robust against harmonic in-band interference than simple pulse magnetron-based solutions due to its low instantaneous signal bandwidth, which in turn allows for lower receiver bandwidths to be used. This argument is even more emphasized by the fact that coherent signal processing and correlation is much easier to achieve for CW waveforms than for incoherent magnetron-generated radar signals that require full Nyquist-Shannon bandwidth TX and RX pulse sampling to obtain signal processing gain.
The combination of the S-/C-band SAR radar system with the data obtained by the X-band marine navigation radar also allows to significantly reduce the remote probability of false positives that could be obtained by illuminating other ships or structures, such as buoys, and their possibly corroded and therefore weakly non-linear metal structures or electronic devices by correlating the return of both systems with a suitable algorithm using the estimated X-band RCS as a measure. This procedure would allow the system to assert an even higher degree of confidence to even a single HR return received by the system, which is especially important at higher sea states where a high probability of LOS path disruption by waves is to be expected. This is in contrast to statistical approaches used to locate a stationary person in water using the navigation radar directly [Reference Parsa and Hansen27], which requires many subsequent successful measurements with LOS to build up detection confidence in sea clutter using statistical radar processing methods, such as the procedures shown in [Reference Panagopoulos and Soraghan44].
As today's electromagnetic spectrum is getting more and more crowded, a sufficiently small occupied bandwidth for such a system will also certainly help the international regulatory process to allocate a fixed pair of harmonic frequency bands to such a system, similar to the narrowband allocations already in place for the RECCO avalanche rescue system.
Despite all the advancements presented here, further research into the usability of active HR tags in (modulated) pulse radar-based systems and the development of a comparison metric for the performance of different complex HR systems, considering more than just a EIRP versus range metric, is certainly necessary to aid in the choice for a specific system technology in other applications.
This comparison is further complicated by the observation that harmonic output power compression and saturation of the tag's non-linear element is seldom taken into account, but could play a significant role in modeling high crest factor pulse-based HR systems, and in turn adequately comparing them with SFCW/FMCW low crest factor-based approaches.
Conclusion
A new SRS based upon clutter-free HR S-/C-band measurements in a maritime environment was successfully demonstrated for tag distances up to 5800 m and presented in this paper.
The theoretical background of HR, the development process of the components and the performance of a new conventional passive tag, a new active low-power BJT frequency doubler, and a novel active tag offering positive harmonic conversion gain was extensively presented. The SFCW HR interrogator system, including a new LNA architecture especially suitable for the challenges present in these systems, was presented in detail and several guidelines for obtaining high system linearity were given.
A new HR detection and ranging distance record using passive HR tags was achieved despite a significant reduction in peak illumination signal power compared to other published interrogator systems.
Additionally, it was demonstrated that the usable range of the system was increased by a factor of 6 to a tag detection range of 5800 m by using the new active low-power HR tag presented in this paper.
A major step has been taken toward creating a new and viable maritime quick response SRS which can be combined and integrated with a ship's on-board navigation radar in the future to form a cost-effective and independent solution for the time-critical non-assisted initial phase of SAR at sea.
Acknowledgment
The authors would like to thank the German Ministry of Education and Research (BMBF) for funding the research under the reference number 13N14117, administrated by K. Reichel, VDI. In addition, the authors would especially like to thank our project partners Th. Bertuch, T. Badawy, D. Nulwalla, and A. Kremmring from the Fraunhofer Institute for High Frequency Physics and Radar Techniques (FHR), Wachtberg, and A. Schaab, C. Reiter, W. C. Bruhn, and A. Mues from Raytheon Anschütz GmbH, Kiel. The authors would also like to thank C. Entsfellner and B. Kaindl from Rosenberger Hochfrequenztechnik GmbH & Co. KG for their assistance with the high-power diplexer filters and discussions about passive component linearity and Michael Dibowski from KADEMATIC Seenotrettungsgeräte GmbH for providing the modified inflatable life jacket and the weighted body simulator used for the experiments in the Baltic Sea.
 Thomas Harzheim received his B.Eng. and M.Eng. in electrical engineering from the FH Aachen, University of Applied Sciences, in 2010 and 2012, and received his Ph.D. in electrical engineering from the University of Luxembourg in 2019. Since 2012, he has been with Heuermann HF-Technik GmbH as an RF, mixed signal and embedded design engineer. Since 2014, he also has been a researcher with the Institute for Microwave and Plasma Technology (IMP) at the FH Aachen. His current research interests include modular VNA systems for linear and non-linear measurements, NVNA phase reference standards, PIM measurement systems, Hot-S-parameter measurements on SSPA, and magnetron-driven RF plasmas and SFCW harmonic radar.
 Marc Mühmel received his B.Eng. degree in electrical engineering from the FH Aachen, University of Applied Sciences, in 2017. Since 2017, he has been a research engineer with the Institute for Microwave and Plasma Technology (IMP) at the FH Aachen, where he was involved in the design of microwave components, VNA systems for linear and non-linear measurements, frequency doublers, and antennas. His current research interest is mainly located in the field of microwave-driven plasmas and high-frequency ignition systems for combustion motor vehicles.
 Holger Heuermann received the Ph.D. degree in electrical engineering from the University of Bochum, Germany, in 1995. From 1991 to 1995, he was a research assistant with the University of Bochum, working in the field of RF measurement techniques.From 1995 to 1998, he worked at Rosenberger Hochfrequenztechnik, Germany, where he was engaged in the design of RF equipment for measurements with network analyzers. In 1998, he joined Infineon Technologies, Germany, leading a development group for wireless front-end modules. Since 2002, he has been with the Aachen University of Applied Sciences, Germany, where he is currently a Professor, leading the Institute for Microwave and Plasma Technology (IMP). Since 2008, he is leading the company Heuermann HF-Technik GmbH. His current research interests include transceiver circuits, RF plasmas, as well as mixed frequency scattering parameter measurements. He has authored and coauthored over 90 papers and over 35 patents.


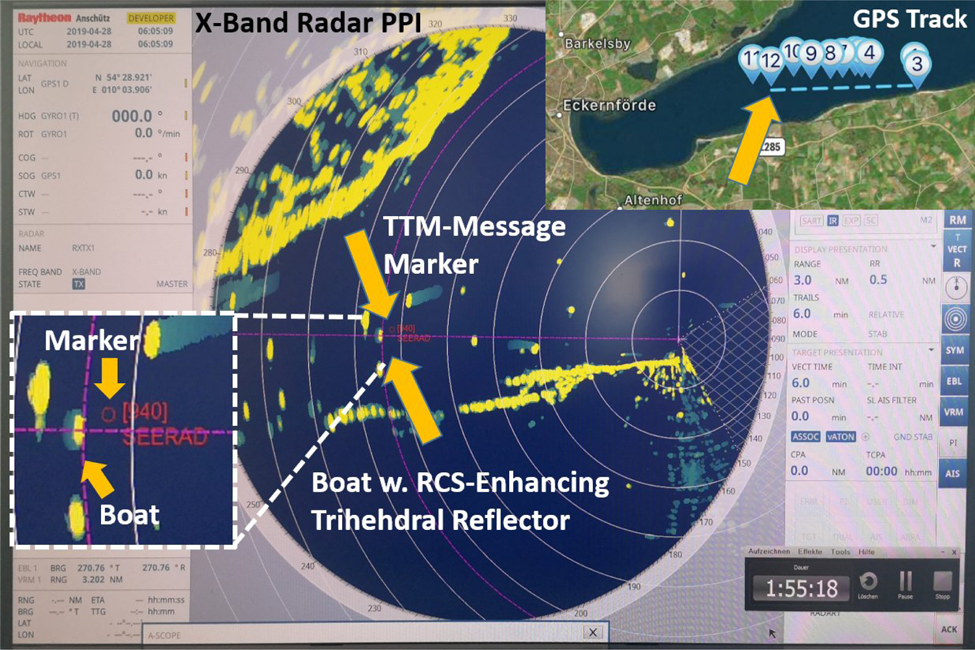


 Open access