


Introduction
The harvesting and trading of wild animals for human consumption are widespread in Africa. Meat from wild animals (commonly termed bushmeat or wildmeat) contributes significantly to food security and people's livelihoods, especially for the rural poor (Cawthorn & Hoffman, Reference Cawthorn and Hoffman2015). However, the transition from subsistence to large-scale commercial harvesting has become a serious problem for biodiversity conservation (Abernethy et al., Reference Abernethy, Coad, Taylor, Lee and Maisels2013; Wilkie et al., Reference Wilkie, Wieland, Boulet, Le Bel, van Vliet and Cornelis2016). This challenge is driven by factors such as a growing human population, increased demand, increased accessibility to wild animals because of the expansion of extractive industries and use of modern firearms (Poulsen et al., Reference Poulsen, Clark, Mavah and Elkan2009; Coad et al., Reference Coad, Schleicher, Milner-Gulland, Marthews, Starkey and Manica2013; McNamara et al., Reference McNamara, Fa and Ntiamoa-Baidu2019).
In many parts of Africa, particularly in West and Central Africa, bushmeat markets are common and the business is well-developed (Fa et al., Reference Fa, Olivero, Farfan, Marquez, Duarte and Nackoney2015; McNamara et al., Reference McNamara, Rowcliffe, Cowlishaw, Alexander, Ntiamoa-Baidu, Brenya and Milner-Gulland2016). These markets typically serve as important collection points for wild animals harvested from surrounding catchment areas. Patterns of trade flow are often dynamic, with temporal and spatial fluctuations in species composition, volume and price. Data on the profiles and volumes of wild animals on sale in local markets are valuable for assessing the condition and status of fauna in surrounding catchments (Cowlishaw et al., Reference Cowlishaw, Mendelson and Rowcliffe2005; Dupain et al., Reference Dupain, Nackoney, Mario Vargas, Johnson, Farfán, Bofaso and Fa2012; McNamara et al., Reference McNamara, Rowcliffe, Cowlishaw, Alexander, Ntiamoa-Baidu, Brenya and Milner-Gulland2016). Market analyses have been used to provide estimates of extraction, types of wild animals hunted in those areas and the status of the species in the wild (Fa et al., Reference Fa, Olivero, Farfan, Marquez, Duarte and Nackoney2015; McNamara et al., Reference McNamara, Rowcliffe, Cowlishaw, Alexander, Ntiamoa-Baidu, Brenya and Milner-Gulland2016). Although the confounding effects of market dynamics may not permit strong conclusions regarding sustainability (Ling & Milner-Gulland, Reference Ling and Milner-Gulland2006; Waite, Reference Waite2007), analysis of species trade profiles and volumes can provide useful insights into and broad understanding of bushmeat use and offtake across landscapes (Fa et al., Reference Fa, Olivero, Farfan, Marquez, Duarte and Nackoney2015). This can facilitate the identification of key areas for effective management and conservation planning. Bushmeat market data have also been used to explore various characteristics of the trade to better understand the behaviour of consumers, hunters and traders. Previous studies have highlighted the importance of understanding such behaviours as they influence the dynamics of the trade (Allebone-Webb et al., Reference Allebone-Webb, Kümpel, Rist, Cowlishaw, Rowcliffe and Milner-Gulland2011; McNamara et al., Reference McNamara, Kusimi, Rowcliffe, Cowlishaw, Brenyah and Milner-Gulland2015, Reference McNamara, Rowcliffe, Cowlishaw, Alexander, Ntiamoa-Baidu, Brenya and Milner-Gulland2016). These types of data are invaluable for conservation management, for identifying species or landscapes under threat and for developing targeted interventions to address the unsustainable supply or consumption of bushmeat.
In Ghana, a number of bushmeat markets have been studied at various times. However, these studies have only collected data for markets and trade patterns in the southern part of the country (e.g. Ntiamoa-Baidu, Reference Ntiamoa-Baidu1997; Cowlishaw et al., Reference Cowlishaw, Mendelson and Rowcliffe2005; McNamara et al., Reference McNamara, Rowcliffe, Cowlishaw, Alexander, Ntiamoa-Baidu, Brenya and Milner-Gulland2016). Information on almost all aspects of the bushmeat trade is scarce for northern Ghana (Aalangdong, Reference Aalangdong, Nanang and Nunifu2010). In addition to this need for data, the north, being a savannah ecosystem, has different biotic and socio-cultural characteristics from the humid south, and therefore northern markets could potentially exhibit different characteristics from southern markets. Generally, the bushmeat trade in savannahs is less studied than that in forest ecosystems (Lindsey et al., Reference Lindsey, Balme, Becker, Begg, Bento and Bocchino2013), with the majority of studies focused on East and Southern Africa (e.g. Lindsey et al., Reference Lindsey, Romañach, Matema, Matema, Mupamhadzi and Muvengwi2011; Nielsen & Meilby, Reference Nielsen and Meilby2015).
Here we use bushmeat market data to provide an in-depth analysis of the dynamics of the bushmeat trade in northern Ghana. Undertaking the first comprehensive survey of local markets, we gathered information on the type and volume (carcass numbers and biomass) of bushmeat taxa on sale at three market sites. We use these data to examine species composition and volumes traded and to estimate annual bushmeat trade in each market site to gain insights into the condition of wildlife resources. We examine differences between sites to understand potential spatial variation and investigate factors influencing fluctuations in trade volumes. We assess and compare the prices of different bushmeat species as well as other animal protein available in the study area, to gain insights into the behaviours of consumers and traders. We present an overview of the bushmeat trade flow to understand how the market operates. Finally, we draw some general conclusions regarding the bushmeat trade in this understudied region and the implications of these findings for bushmeat exploitation and the conservation of exploited species.
Study area
We conducted our study in the Upper East Region of Ghana, in the north-east, bordered by Burkina Faso to the north and Togo to the east (Fig. 1). Typically, there is a wet season in May–October and a dry season in November–April, with highest temperatures in March. The natural vegetation is savannah woodland, comprising mainly open savannah, with grassland separating fire- and drought-resistant trees such as the shea nut Vitellaria paradoxa (Ghana Statistical Service, 2013). This region is one of the least urbanized in Ghana. The rural savannah zone has the highest poverty incidence (67.7%, with average annual income equivalent to < USD 306 per adult in 2016/2017; Ghana Statistical Service, 2018). The majority (80%) of the economically-active population is engaged in crop farming, an activity that is part of their tradition and their main source of food (Ghana Statistical Service, 2013). A variety of crops are cultivated in the study area, including millet and maize. Livestock and poultry rearing are common.
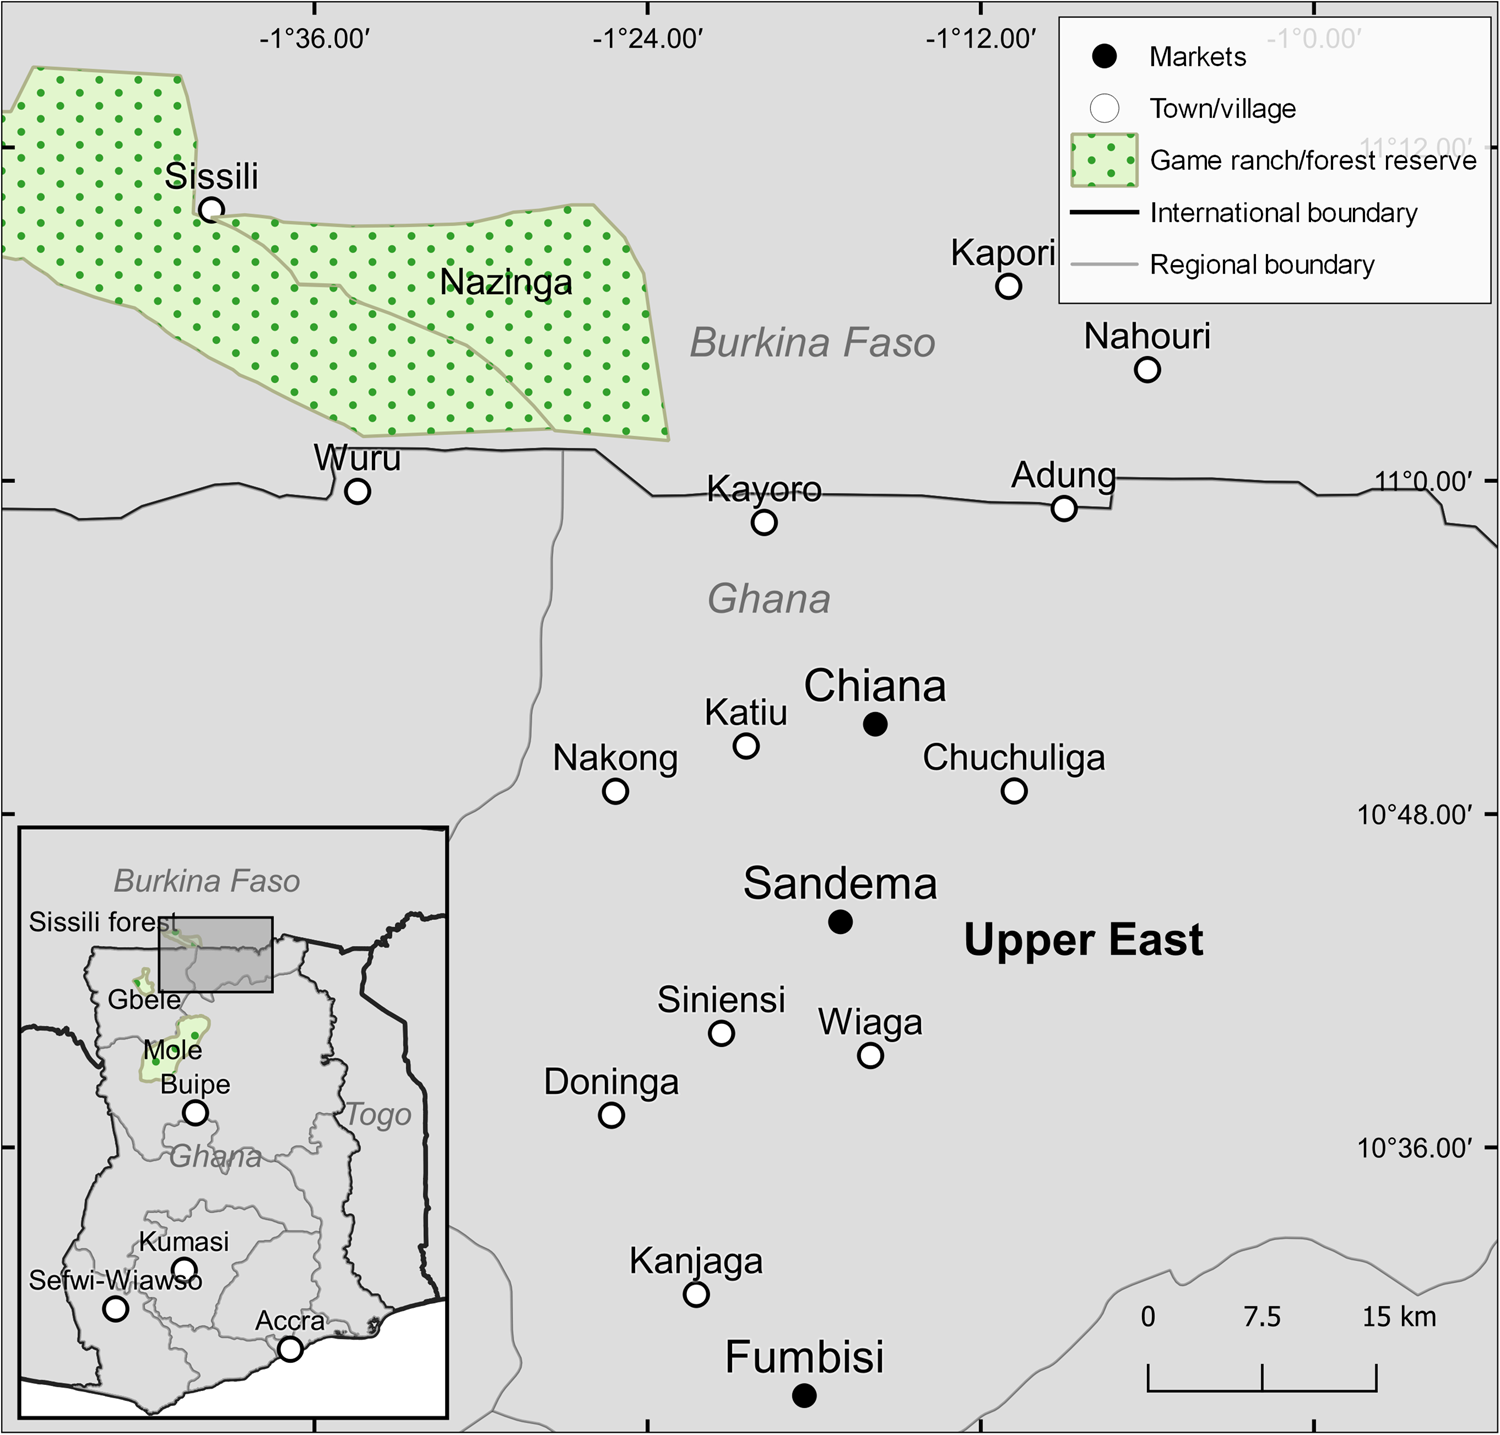
Fig. 1 The location of the three surveyed markets in Chiana, Sandema and Fumbisi in northern Ghana, and of Nazinga Game Ranch in Burkina Faso and Mole National Park and Gbele Game Production Reserve in Ghana.
We focused on three towns, Sandema, Chiana and Fumbisi, with populations of 5,226, 1,038 and 2,647 people, respectively, in 2010 (Ghana Statistical Service, 2012). These towns were selected based on expert knowledge from previous studies that suggested they held substantial bushmeat markets (Ntiamoa-Baidu, Reference Ntiamoa-Baidu2016; Fig. 1). The markets of the three towns, where both agricultural and manufactured goods are sold, are the major commercial centres in their respective districts. Of the three, the Fumbisi market is the largest in terms of the number of market attendees. The markets serve the surrounding small communities and villages and are well integrated with major source locations supplying bushmeat. There are three important protected areas < 200 km from these towns (Ghana's largest wildlife park, Mole National Park, to the south-west, Gbele Game Production Reserve to the west and Nazinga Game Reserve < 40 km to the north in Burkina Faso).
Methods
Data collection
We surveyed bushmeat traded in the Sandema, Fumbisi and Chiana markets during October 2018–October 2019. A three-member team (HNKS, a field assistant and a trained local assistant) visited the markets in the mornings before the traders started selling their bushmeat and stayed throughout the day until the traders departed from the market. The markets are open only on market days, once per week for the Fumbisi and Chiana markets and twice per week for Sandema. Data were collected on two consecutive market days within a 2-week period every other month. On each visit all traders were asked for consent to collect information on their bushmeat carcasses traded that day, with the assurance that all personal information would remain confidential and their identities anonymized.
The surveys involved direct observations of the species and counts of bushmeat carcasses on sale. To avoid double counting of bushmeat carcasses during each survey, each member of the team was allocated to a specific group of traders and stayed with them throughout the day. The traders set up mostly in groups according to their village of origin and hence each member of the survey team could reliably observe all traders within their assigned location in the market. Data on the condition of meat (live, fresh or smoked) were recorded and animal carcasses were weighed with a spring scale to convert prices per carcass/piece to prices per kg. Although most carcasses sold were whole, when pieces from body parts were encountered, we estimated the minimum number of individuals from a collection of body parts. For example, two hind legs from the same species would be recorded as one animal (Fa et al., Reference Fa, Olivero, Farfan, Marquez, Duarte and Nackoney2015). Information on source and destination (for 89.8% of carcasses sold) and prices of carcasses were obtained from traders and by observing transactions. Not all information could be collected on individual carcasses (e.g. in situations where traders were in a hurry to sell their bushmeat, if the smoked carcasses were too delicate to be handled for weighing or if the traders did not consent to their bushmeat being handled). In such cases, only the species were recorded. Good rapport with the traders facilitated data collection, so such situations were infrequent, except for obtaining data on weight as most carcasses were smoked. Some individual birds and monkeys were not identifiable to species and were therefore combined into grouped categories. To maintain consistency in data collection, the composition of the survey team remained the same throughout the survey.
We collected additional information regarding trading activities, peak trading periods and other livelihoods through 21 interviews with traders on the markets and opportunistic conversations held during the market surveys. For comparison, we also collected data (type, weight and price) for other types of animal protein sold, mainly fish and beef.
Data analysis
Statistical analyses were conducted using R 3.6.1 (R Core Team, 2019). We analysed the data collected for species composition and number of individual carcasses and compared the proportions for the three markets. A total of 41 market days were surveyed across all three markets (Sandema 18 days, Chiana 10 days, Fumbisi 13 days). Because of variation in the number of sampling sessions at the different markets, we reported trade volumes (carcasses and biomass) as mean quantities per sampling day in each market. This standardized our data and controlled for variation in sampling effort. We estimated and compared biomasses for the various wild animal groups traded using the total number of individuals recorded per species at the markets multiplied by the average adult body mass (in kg) of the species as reported in the literature (Hoffman & Sales, Reference Hoffman and Sales2007; Borrow & Demey, Reference Borrow and Demey2010; Parr et al., Reference Parr, Wilson, Leary, Schulz, Lans and Walley2014; Sackey, Reference Sackey2014; Kingdon, Reference Kingdon2015). We assigned the mean body mass of related taxa for those individuals that were not identifiable to species. We then estimated annual quantities of bushmeat traded within each market by multiplying the mean quantity of carcasses traded per survey day at each market with the total number of market days per year for each of the markets (52 days for Fumbisi and Chiana and 104 days for Sandema). We calculated annual estimates of bushmeat traded in this way because bushmeat was traded only during market days, outside of which no trading activities occur. We then obtained robust 95% confidence intervals associated with these estimates by bootstrapping for 10,000 replications using the package boot (Canty & Ripley, Reference Canty and Ripley2017) in R. We divided the study duration into the dry (November–April) and wet (May–October) seasons and compared the numbers of bushmeat carcasses recorded in the two seasons.
We performed regression analyses to investigate the factors influencing the variation in the numbers of carcasses recorded at the markets. We used a generalized linear model with Poisson errors because the response variable is counts of number of carcasses recorded per market day. The covariates investigated included market (to account for differences in market trade patterns), season (to account for trade variations between the wet and dry seasons) and taxonomic group of species traded (to account for differences in the composition of bushmeat species traded). We performed an analysis of deviance to test the statistical significance of each categorical variable. Because of the extremely large numbers of amphibians recorded relative to other species and the possibility of such large numbers influencing the rest of the dataset, we performed all univariate and regression analyses on two datasets: one with amphibians and one without. We examined all models to ensure that the model assumptions of homoscedasticity of variance and normality were met (Zuur et al., Reference Zuur, Ieno, Walker, Saveliev and Smith2009).
We estimated average prices (per kg) of species from carcasses for which complete information on weight and price was obtained. We described and mapped the bushmeat trade flow using data on trade volumes and the sources and destinations of different bushmeat species as reported during the market surveys. We mapped trade flows using QGIS 3.12.1 (QGIS Development Team, 2020).
Results
Species composition, carcass numbers and biomass of bushmeat
Nearly all the bushmeat recorded was sold as smoked meat, with the exception of one species (Senegal flapshell turtle Cyclanorbis senegalensis), which was traded alive. We recorded 28 species of wild animals but this could be an underestimate, as some individual bushmeat items were not completely identifiable to species and had to be assigned to groups. The total number of bushmeat carcasses recorded (10,407) comprised 20 mammal species (nine ungulates, three primates, four rodents, three carnivores and one lagomorph), three amphibian species, three bird species and two reptile species (Table 1). Frogs constituted the bulk (82%) of the carcasses recorded (Fig. 2). The edible bullfrog Pyxicephalus edulis, one of three frog species recorded, was the most numerous, with a total of 5,243 carcasses, accounting for c. 50% of all the bushmeat carcasses sold (Table 1). We recorded low numbers of rodents (7% of the total), lagomorphs (4%) and birds (3%), and few carnivores, primates and ungulates, which together comprised 2% of all carcasses. We recorded single individuals for five species of mammals: African buffalo Syncerus caffer, marsh mongoose Atilax paludinosus, olive baboon Papio anubis, red-flanked duiker Cephalophus rufilatus and roan antelope Hippotragus equinus. Table 1 lists all the bushmeat species recorded as being traded during the study, their legal status under Ghana's Wildlife Conservation Regulation, and their category on the IUCN Red List.
Table 1 Number of carcasses of bushmeat species recorded in the three markets (Fig. 1) and overall during October 2018–October 2019, with the protection status of each species according to Ghana's Wildlife Law and IUCN Red List status and population trend.

1 First Schedule, hunting prohibited; Second Schedule, hunting prohibited in closed season and no hunting of young/adult with young; Third Schedule, hunting prohibited in closed season; Unscheduled, no restrictions. (L.I. 685 Wildlife Conservation Regulation, 1971, and L.I. 1357 Wildlife Conservation (Amendment) Regulation, 1988).
2 LC, Least Concern; NT, Near Threatened; VU, Vulnerable (IUCN, 2022).
3 Local name of frog, unidentifiable to species.
4 Unidentifiable to species.
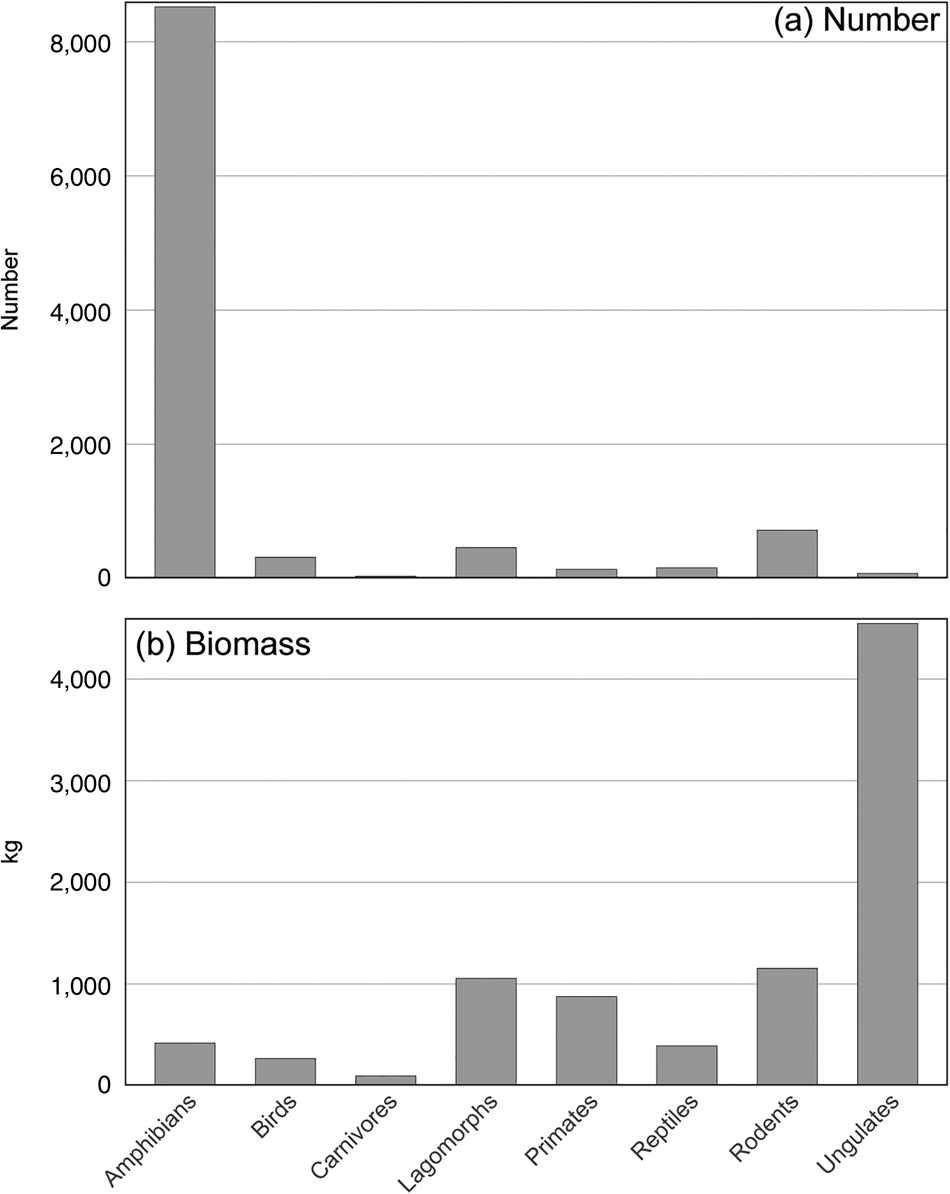
Fig. 2 (a) Number of carcasses and (b) biomass of bushmeat recorded in the three markets (Fig. 1) during the study period, grouped by taxonomic groups.
A total of 8,803 kg of bushmeat was traded in the markets during the study. Ungulates contributed the highest proportion (52%) of this, followed by rodents (13%; Fig. 2). Lagomorphs comprised 12% of the traded biomass, primates 10%, frogs 5% and the remaining groups combined another 8%.
Differences between markets
The highest biomass of bushmeat was observed in Chiana (46% of the total) and the lowest in Sandema (11%) mainly because of the species composition for sale. Extrapolating these results, an estimated 48,277 bushmeat carcasses are traded each year at the three markets, of which an estimated 26,432 carcasses (95% CI 8,960–52,716) are traded in Fumbisi, 20,904 (95% CI 11,122–32,367) in Sandema and 941 (95% CI 541–1,399) in Chiana annually. These estimated numbers correspond to an annual total biomass of 41.84 t of undressed meat (of which an estimated 21.04 t are traded in Chiana, 15.03 t in Fumbisi and 5.77 t in Sandema). These estimates of annual trade are approximate indications only.
Delivery and trading of bushmeat at the sites varied from day to day and over the course of the year. The three study markets also differed in terms of species composition and numbers of carcasses recorded as well as in their seasonal patterns (Fig. 3, Table 1). Of the 28 species recorded, only seven were common to all three markets. Species diversity was highest in Chiana and lowest in Sandema. This disparity could be because of differences in bushmeat catchment or preferences of customers, traders or hunters. Amphibian trade also varied between markets: the trade in Fumbisi and Sandema was dominated by amphibians, but trade in amphibians was absent in Chiana (Fig. 3).
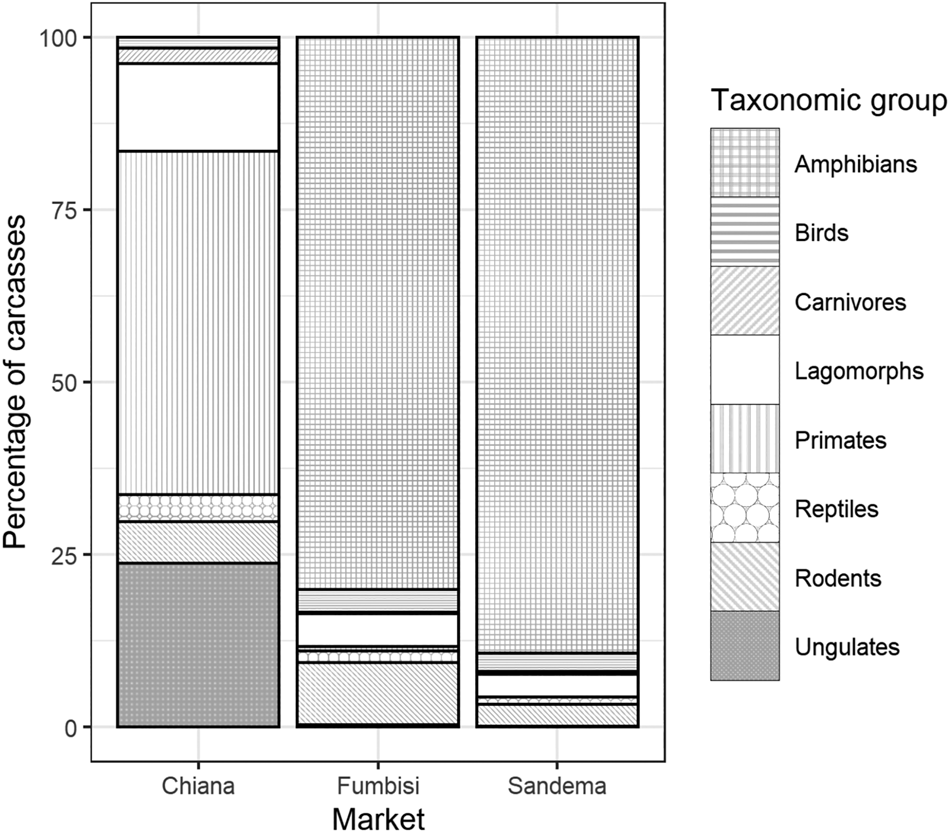
Fig. 3 Characteristics and compositions (per cent of the total number of carcasses) of bushmeat recorded in the three markets, by taxonomic group.
Where amphibians were traded, they were available in large numbers. During the study, totals of 5,289 and 3,231 frogs, accounting for 80 and 89% of total trade (in terms of individual carcasses), were recorded in Fumbisi and Sandema, respectively. There was seasonal variation in this trade, with a peak during the dry season. This trend was seen in trade in general, with the majority (76%) of the trade by carcass number recorded during the dry season, corresponding to 75% of the total biomass. This seasonal difference was observed across all three markets.
Generally, Sandema traded mainly in small-bodied species, largely amphibians, lagomorphs and rodents. Sandema accounted for only 7% of ungulate carcasses and primates were absent. The trade in Chiana was dominated by larger-bodied animals. Aardvarks Orycteropus afer, African buffalo, olive baboon and roan antelope were recorded exclusively in Chiana. The majority of the primates (90 of 134; 67%) and ungulates (43 of 73; 59%) were recorded in Chiana (Fig. 3), with primates comprising the bulk of the trade by carcass number in this market (50% of the animals recorded).
Determinants of the numbers of bushmeat carcasses recorded
Variations between markets in numbers of carcasses traded per survey day were further highlighted in the results from the generalized linear models (Table 2). Whether or not amphibians were included, the modelled estimates of the numbers of carcasses sold in Chiana per survey day were significantly lower than those in the other two markets (trade volumes were 4.78 times and 0.24 times higher in Fumbisi and Sandema, respectively). Overall, carnivores followed by ungulates were the least traded species group. Fewer carcasses were sold in the wet season than in the dry season. These results were similar whether or not amphibians were included in the analysis, although the effects of market and season were more pronounced with the inclusion of amphibians (Table 2).
Table 2 Results of Poisson generalized linear model analysis to assess the effects of market, season and taxonomic group on the number of bushmeat carcasses recorded per survey day for two datasets (without and with amphibians).

Model outputs also reflected the observed seasonal trends across all three markets (Poisson generalized linear model analysis of deviance; χ (1,324) = 10.90, P < 0.01). These differences were evident even with the exclusion of amphibians from the analysis (Poisson generalized linear model analysis of deviance; χ (1,283) = 10.32, P < 0.01). Estimates from the generalized linear model demonstrated that a mean of 57.4% fewer animals were traded in the wet season (Table 2).
Price of bushmeat
Bushmeat was sold in various forms. Smaller-sized species such as birds, reptiles, lagomorphs and rodents were sold as whole carcasses, whereas frogs were sold in bundles comprising 7–25 whole carcasses. Larger species were butchered and sold as pieces. The prices of mammal species ranged from a minimum of GHS 4 (USD 0.74 based on exchange rates estimated for the second quarter of 2019) for a whole giant rat Cricetomys gambianus to GHS 42 (USD 7.82) per piece of common warthog Phacochoerus africanus meat. Based on the price of smoked meat for which weight data were available (168 observations), monkey species were the cheapest bushmeat recorded at GHS 11.15 ± SD 3.14 per kg (USD 2.07), whereas the helmeted guinea fowl Numida meleagris had the highest mean price of GHS 33.7 ± SD 7.4 per kg (USD 6.27; n = 13), followed by grasscutter Thryonomys swinderianus GHS 29.7 ± SD 8.1 per kg (USD 5.51) (Fig. 4). These premiums are unsurprising as guinea fowl and grasscutters are popular with bushmeat consumers in urban areas and command high prices.

Fig. 4 Mean ± SD price per kg of fish, beef and various bushmeat species on sale in the three markets. USD 1 was equivalent to GHS 5.37 in the second quarter of 2019. *Unidentifiable to species.
Generally, the price of bushmeat was more variable throughout the year and higher than that of domestic meats such as beef. In contrast, the price of fish was relatively consistent from month to month, with a price of GHS 18.7 ±SD 1.9 per kg (USD 3.47; n = 63), which was cheaper than most of the smaller-bodied bushmeat species such as birds and rabbits but higher than for some bushmeat species such as grey duiker and monkey (Fig. 4). Beef was the cheapest animal protein sold at the markets, with a consistent mean sale price of GHS 10.2 ± SD 1.8 per kg (USD 1.89; n = 15).
Trade flows
Bushmeat traded in the three markets came from several localities and neighbouring villages in the study area and from Burkina Faso. Information on the destinations of the traded bushmeat carcasses obtained from the market surveys revealed two types of trade: purchase for local consumption and purchase by wholesalers for transport beyond the study area. More than half (60%) of the total biomass passing through all three markets was destined for other locations, mostly major markets in southern Ghana. This long-distance trade was particularly important in Fumbisi and Chiana in terms of biomass, where traders sold their stock almost exclusively to traders in urban centres (85% for Fumbisi, 98% for Chiana), who purchased and then distributed the meat even more widely. Of the bushmeat carcasses purchased by wholesalers in Fumbisi for resale in urban markets (526 of 6,608; c. 2,052 kg of meat), the bulk (79% of the biomass) was transported via road to Buipe market, an important but previously undocumented bushmeat hub c. 237 km south of Fumbisi (Fig. 5). Another 6% of the meat was transported > 500 km southwards to the major city of Kumasi in the Ashanti Region. In Chiana, of the 2,946 kg of meat (164/181 carcasses) purchased by wholesalers for resale in urban markets, 91% was transported to Kumasi (608 km away) and 7% to Sefwi-Wiawso in the Western North Region (c. 720 km away). Some meat was also transported even further south to the capital city Accra.
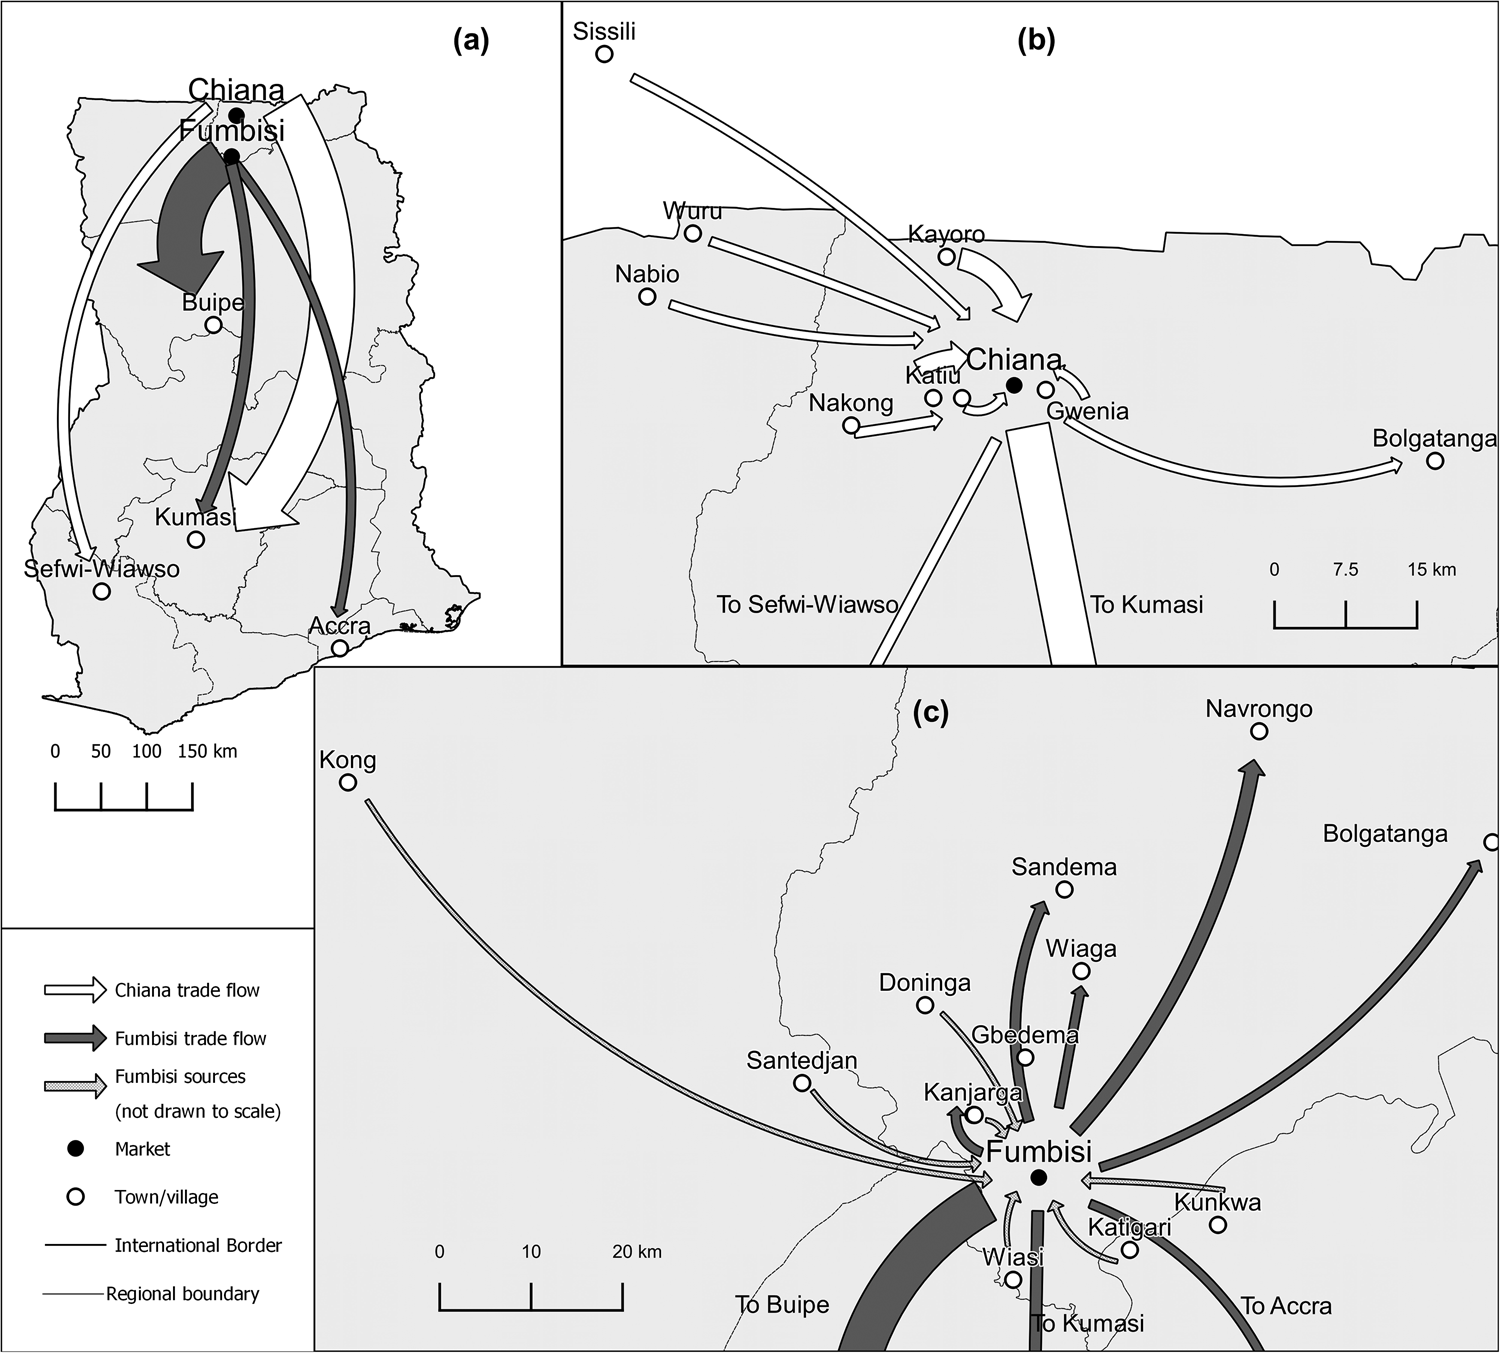
Fig. 5 Bushmeat trade flow patterns in the rural–urban commodity chain in Ghana based upon our market surveys in Fumbisi and Chiana, showing the importance of southern urban markets for the bushmeat trade in the north. (a) Long-distance trade and (b, c) local trade. The arrows illustrate the directions of trade and the widths of the arrows are proportional to the volumes of bushmeat traded (in kg) with the exception of the Fumbisi source data which is not to scale.
Our data underlined differences in species composition between local and long-distance trades. The majority (95%) of bushmeat carcasses traded locally were of amphibians and smaller-bodied animals (Fig. 6). The long-distance trade was dominated by larger-bodied animals and included mostly rodents (36%), lagomorphs (20%) and primates (18%). Wholesalers did not purchase amphibians for long-distance trade to urban markets. Conversely, primates and ungulates were purchased exclusively for long-distance trade to southern markets (Fig. 6).
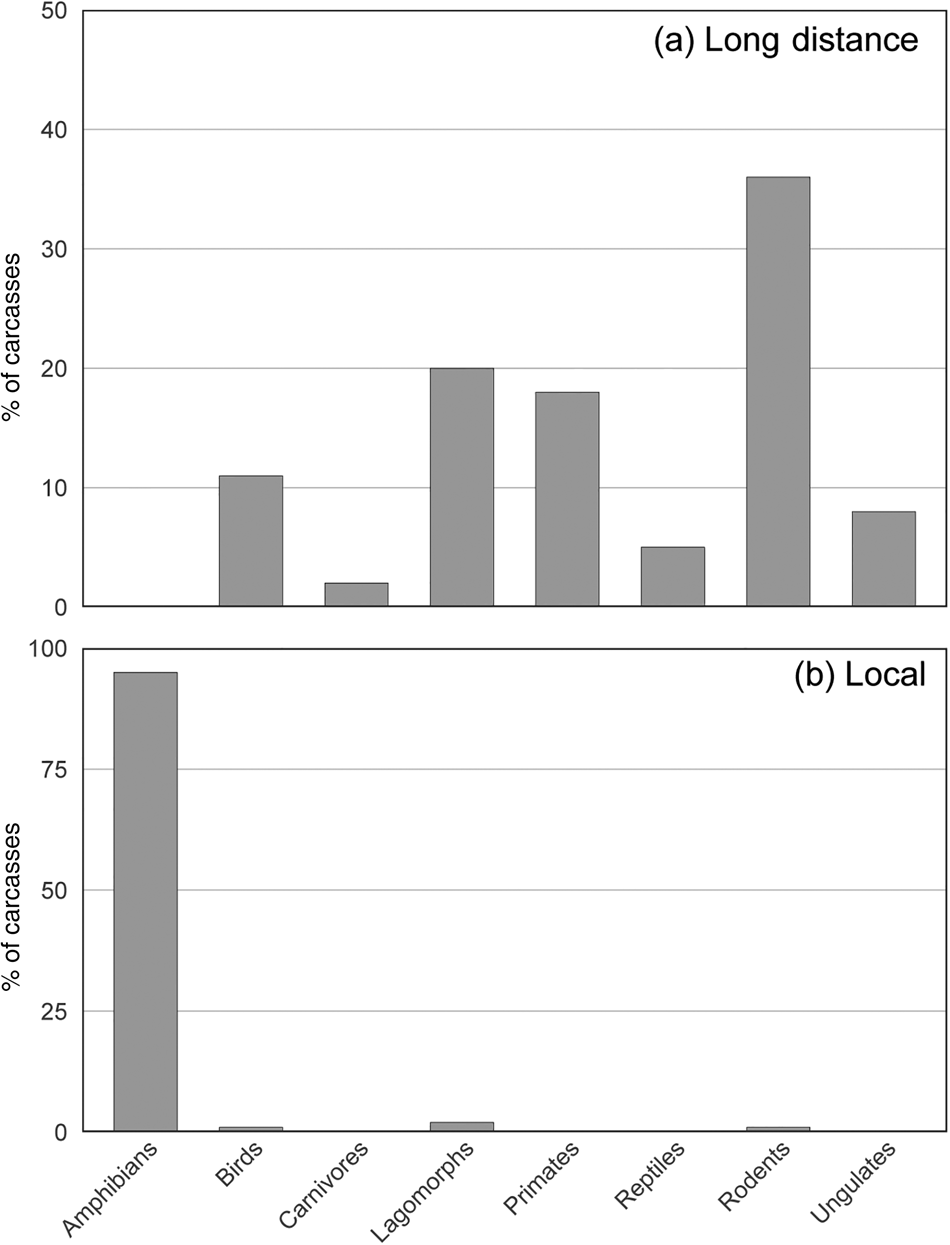
Fig. 6 Composition of carcasses traded (a) over long distances (n = 698) and (b) locally (n = 9,008). The local trade data are drawn from survey records of carcasses traded by market retailers in Fumbisi and Sandema (where this type of trade was recorded). The long-distance trade data are drawn from survey records of carcasses purchased by wholesalers in Fumbisi and Chiana (this type of trade was not recorded in Sandema).
Discussion
Species composition and trade volumes
Frogs were by far the most commonly traded species we encountered. Two of these frog species, edible bullfrog and African groove-crowned frog Hoplobatrachus occipitalis, have also been reported as heavily traded elsewhere in West Africa (Mohneke et al., Reference Mohneke, Onadeko, Hirschfeld and Rödel2010). The large trade in frogs in our study indicates that they provide an important source of protein, although this seems likely to be for local consumption. This conclusion is supported by the fact that frogs have not been reported in studies of urban markets in southern Ghana (e.g. Cowlishaw et al., Reference Cowlishaw, Mendelson and Rowcliffe2005; McNamara et al., Reference McNamara, Rowcliffe, Cowlishaw, Alexander, Ntiamoa-Baidu, Brenya and Milner-Gulland2016). This finding highlights a marked difference between northern and southern markets. In southern markets, rodents and ungulates usually dominate the trade, accounting for > 90% of trade volumes (in terms of total carcasses) in some instances. These trends have been reported in southern markets such as Kantamanto (Ntiamoa-Baidu, Reference Ntiamoa-Baidu1998, Reference Ntiamoa-Baidu2016), Takoradi (Cowlishaw et al., Reference Cowlishaw, Mendelson and Rowcliffe2005) and Kumasi (McNamara et al., Reference McNamara, Rowcliffe, Cowlishaw, Alexander, Ntiamoa-Baidu, Brenya and Milner-Gulland2016). However, in our study rodents and ungulates comprised only 14% of the total carcass numbers, although ungulates still comprised the bulk of the biomass.
The most important explanation for the differences in bushmeat species composition and trade volumes between the northern markets we surveyed and those in southern Ghana is probably the ecology of the ecosystems the markets are drawing from. For example, some species, such as the lagomorphs, helmeted guinea fowl and African buffalo, are native to savannah zones and would be expected to be found in northern markets. These ecological differences may also manifest in other ways. For example, the forest–farmland mosaic of the humid south provides a favourable habitat for small-bodied, generalist ungulates, such as royal antelope Neotragus pygmaeus and Maxwell's duiker Philantomba maxwellii. Evidence suggests these species are better able to persist in these landscapes, even when hunting levels are high, and they dominate the ungulate trade in the south (Cowlishaw et al., Reference Cowlishaw, Mendelson and Rowcliffe2005). In contrast, the relatively low number of large ungulates observed in northern markets during our study suggests that in the more open savannah landscape of the north they have been overhunted.
Generally, savannah systems support large numbers of grazing herbivores such as ungulates (Robinson & Bennett, Reference Robinson and Bennett2004). This is evident in the nearby Mole National Park, and Nazinga Game Ranch in Burkina Faso, both of which support large numbers of ungulates (Brashares et al., Reference Brashares, Arcese and Sam2001; Bouché et al., Reference Bouché, Lejeune, Bailly, Muyle, Zinque and Mercier2016), providing insight into the natural species composition of the landscape under low levels of disturbance. The fact that we recorded low numbers of ungulates traded in local bushmeat markets may therefore be an indication that the savannah landscapes within our study site (and outside these protected areas), have been depleted of wild ungulates.
Hunting is likely to be a major cause of this depletion. This is evidenced by the high prices paid for ungulates and their almost exclusive trade onwards to the larger and wealthier southern markets where preferred bushmeat species can command high prices (McNamara et al., Reference McNamara, Rowcliffe, Cowlishaw, Alexander, Ntiamoa-Baidu, Brenya and Milner-Gulland2016). The combination of high prices and national trade networks is indicative of a high level of consumer demand, and likely creates strong incentives for the hunting of and trade in ungulates compared to less valuable species. However, another explanation for the low number of ungulates recorded could lie in the historical management of trypanosomiasis in the region. In a failed attempt to tackle this disease, wild ungulate populations in northern Ghana were culled under the tsetse fly control programme in the 1930s. This led to drastic declines in ungulate populations (Ntiamoa-Baidu, Reference Ntiamoa-Baidu2008; Aalangdong, Reference Aalangdong, Nanang and Nunifu2010). Even after the programme was terminated c. 25 years later in the late 1950s, populations of wild ungulates in the region continued to fall, mainly because of overhunting, agricultural expansion and widespread bush burning (Aalangdong, Reference Aalangdong, Nanang and Nunifu2010). It is possible that this legacy of ungulate declines may in part explain the continued low numbers of ungulates being traded in local markets.
The greater incidence of ungulates in Chiana compared to the other two markets could be a result of the proximity of Nazinga Game Ranch to the north. Poaching by hunters from both Burkina Faso and Ghana has been reported within this game ranch and its buffer zones (Bouché et al., Reference Bouché, Lejeune, Bailly, Muyle, Zinque and Mercier2016; Hema et al., Reference Hema, Ouattara, Parfait, Di Vittorio, Sirima and Dendi2017). Protected areas are often the only places in a landscape where large ungulates persist and so can be important sources of bushmeat for communities living nearby (Rentsch & Damon, Reference Rentsch and Damon2013; Hema et al., Reference Hema, Ouattara, Parfait, Di Vittorio, Sirima and Dendi2017). It seems likely that large game species sold at Chiana were hunted illegally from the Nazinga Game Ranch and/or in its buffer zones.
Fluctuations in quantities of bushmeat traded
Fluctuations in the quantities of bushmeat in markets are often linked to factors such as season, behaviour of the hunted species and the seasonal nature of hunting activities (Allebone-Webb et al., Reference Allebone-Webb, Kümpel, Rist, Cowlishaw, Rowcliffe and Milner-Gulland2011; Santos-Fita et al., Reference Santos-Fita, Naranjo and Rangel-Salazar2012). Our findings indicate greater bushmeat offtake in the dry season compared to the wet season. In the case of frogs, the observed seasonality in carcass numbers is probably a reflection of the species' behaviour. Several of these frog species, including H. occipitalis, accumulate at waterbodies during the dry season when water levels have declined, facilitating collection in large quantities (Mohneke et al., Reference Mohneke, Onadeko, Hirschfeld and Rödel2010). The seasonality associated with hunters' livelihood portfolios is also likely to be a key factor. Hunting effort and bushmeat trade volumes are frequently linked to farming seasons, being lower during periods when farming commitments are high (Schulte-Herbruggen et al., Reference Schulte-Herbrüggeb, Cowlishaw, Homewood and Rowcliffe2013). Most hunters in Ghana are primarily farmers (Sackey, Reference Sackey2014) and are busiest with farm work during the wet season. This aligns with trade volumes falling during the wet season, when farming commitments are high, and peaking in the driest months (February–April) when farming commitments are low. The observation of seasonal trade fluctuations was confirmed by interviews with bushmeat traders who revealed they engaged in farming to supplement their income. Seasonality could also be relevant to certain practices in the study area. Burning of vegetation in the dry season, which opens up the terrain and facilitates hunting, is typical in the north (Aalangdong, Reference Aalangdong, Nanang and Nunifu2010).
Prices of bushmeat species
The price of bushmeat, although variable, was generally higher than those of alternative animal protein such as fish and beef. This is surprising because in rural areas bushmeat is typically cheaper than alternatives (van Vliet et al., Reference van Vliet, Nebesse, Gambalemoke, Akaibe and Nasi2012; Nielsen & Meilby, Reference Nielsen and Meilby2015). Possible explanations for this difference are that bushmeat is becoming scarce or that harvesting costs are high, thereby increasing prices (Cowlishaw et al., Reference Cowlishaw, Mendelson and Rowcliffe2005).
Price could also influence the prevalence of frogs in local markets. Although seasonal abundance is probably a key determinant of frog supply, the relatively low price and high profit margins for frogs could also play a role. Frogs were amongst the cheapest meats, with only beef being cheaper per kg. Frogs are also small, making their portion size affordable. Our study area falls within the region with the highest poverty rates in Ghana and with some of the lowest consumption expenditures, and thus it is unsurprising that a cheap form of protein such as frog meat is traded abundantly. Furthermore, conversations with traders revealed that those who sold frog meat made a substantial profit despite its low price, probably because of frogs being relatively low-cost and easy to harvest by hand (unlike other species for which harvesting could require access to firearms).
Price probably also has an effect on the form in which some bushmeat is sold. For example, bushmeat species that are more expensive per kg, such as giant rat, were traded in small, affordable portion sizes, whereas cheaper species, such as monkeys, were sold in larger portion sizes. This could also be related to monkey species tending to be transported to the more valuable southern markets. It is therefore difficult to disentangle the interacting effects of affordability for local people, preferences in different parts of Ghana and cost-effectiveness of transportation on the overall relationship between price and the form in which bushmeat is sold.
These price dynamics highlight how the preferences and behaviours of market participants can shape the species profile of bushmeat markets. Other studies have highlighted similar dynamics. For example, a study in Equatorial Guinea suggested that profitability was an important factor whereby trade in certain locations comprised those species that generated the most profits for traders, whereas in other locations species that maximized returns for hunters were favoured (Allebone-Webb et al., Reference Allebone-Webb, Kümpel, Rist, Cowlishaw, Rowcliffe and Milner-Gulland2011). The fact that high-priced products at the markets in our study area were also from those species known to be favoured by consumers in urban centres (e.g. helmeted guinea fowl, grasscutter; McNamara et al., Reference McNamara, Fa and Ntiamoa-Baidu2019; H.N.K. Sackey, pers. obs., 2019, 2020) suggests that similar factors could be important. Considering that most bushmeat recorded during our study was exported to the south, where bushmeat is more expensive, it seems possible that the influence of southern markets results in higher prices in the northern markets. These are complex dynamics that require further study.
Bushmeat trade flows
Our trade-flow analysis emphasized the influence that southern markets have on trade dynamics in the north. The large supply of bushmeat to southern Ghana could indicate rising demand for or increasing levels of depletion in southern areas, requiring traders to source meat from farther afield (McNamara et al., Reference McNamara, Kusimi, Rowcliffe, Cowlishaw, Brenyah and Milner-Gulland2015). Another potential explanation for the flow of bushmeat to southern markets is that price premiums motivate bushmeat traders from the north to supply the larger and more lucrative urban markets in the south. This needs more detailed assessment; however, urban demand is recognized as a strong driver of bushmeat hunting and trade (Allebone-Webb et al., Reference Allebone-Webb, Kümpel, Rist, Cowlishaw, Rowcliffe and Milner-Gulland2011).
Implications for wildlife conservation
The bushmeat trade is one of the biggest direct threats to exploited wild animal populations in Ghana and the wider region. Our market surveys revealed that a wide range of protected species are hunted and openly traded in markets. Four of the species we recorded are classified under the First Schedule of Ghana's Wildlife Conservation Regulation of 1971 (LI 685; Table 1), prohibiting any person from hunting or being in possession of those species at any time. We also recorded seasonally protected species (Second and Third Schedules; Table 1) that were traded all year round. The trade in these protected species indicates that wildlife laws are not being effectively enforced.
Furthermore, although many of the species we recorded in trade are categorized as Least Concern on the IUCN Red List, several have declining population trends, including the unscheduled but heavily traded edible bullfrog (Table 1). From a conservation perspective, the implications are that these wildlife populations could experience significant declines in the future if management actions are not adopted to monitor and improve the sustainability of the trade in these species. In addition, one of the species we recorded in trade, the Senegal flapshell turtle, is categorized as Vulnerable on the IUCN Red List but is not scheduled by Ghana's Wildlife Conservation Regulation. Intervention measures should focus on more appropriate ways to protect such ecologically important species, such as scheduling under the Wildlife Conservation Regulation to ensure that legal protections under national legislation align with international standards and classifications.
Our data also suggest that protected areas could come under increasing pressure. Given that ungulates are fetching high prices in established trade networks to the south, numbers of ungulates in the broader landscape appear to have been depleted and there is evidence that hunters could be accessing national parks. We recommend investment in the effective management of these protected areas and increased enforcement of wildlife laws both in the north and across the country.
We also recommend further research on the exploitation of frogs, which could help tailor management interventions for sustainable harvests. It would be useful to explore the potential for captive breeding of frogs to provide affordable protein. Furthermore, our findings suggest that providing alternative livelihood sources and income-generating activities during the dry season could reduce bushmeat harvesting.
Conclusion
The market data presented here provide the first detailed overview of the commercial bushmeat trade in northern Ghana. The results are relevant for conservationists and researchers seeking to promote sustainable trade. The dominance of amphibians emphasizes the importance of this affordable local protein source for both traders and consumers in an economically deprived region. The low numbers of ungulates at the markets are surprising given the expected ecological characteristics of savannah systems. However, notwithstanding their low numbers, ungulates continue to represent the bulk of the traded biomass, suggesting that even at low numbers the trade in ungulates makes a significant contribution to the local economy.
Although caution must be exercised when using market data to assess the condition and status of fauna in the catchments supplying these markets, there is evidence that the local landscape may be depleted of large mammals, and there are some indications that neighbouring protected areas and reserves are sources of the bushmeat available in these markets. Seasonal variations in the quantities of bushmeat traded demonstrate that trade peaked outside the farming season, indicating that bushmeat hunting and trading are parts of a diversified livelihood strategy.
Our analysis could help inform conservation planning and the design of measures for the management of bushmeat hunting and trading in northern Ghana, and provide evidence to estimate the levels of extraction of certain species and of the effects that overexploitation has had on wildlife populations in the region. Any management intervention measures should consider the role of bushmeat in people's livelihoods, as the challenge for successful wildlife conservation involves balancing wildlife conservation objectives with people's socio-economic needs.
Acknowledgements
HNKS acknowledges funding from the University of Ghana–Building a New Generation of Academics in Africa Project, the support of an AfOx Fellowship from the University of Oxford (grant number AfiOx-173), and an ACCAI Partnership Fellowship, and thanks Timothy Kuiper of the Interdisciplinary Centre for Conservation Science, University of Oxford, for statistical support.
Author contributions
Study design: all authors; data collection: HNKS; data analysis, writing: all authors.
Conflicts of interest
None.
Ethical standards
This study was approved by the Ethics Committee for the College of Basic and Applied Sciences of the University of Ghana (ECBAS 040/18-19) and abided by the Oryx guidelines on ethical standards.


 Open access