


People living with serious mental illness (SMI) such as schizophrenia, related psychotic disorders, and bipolar affective disorder, develop metabolic syndrome and its components at rates considerably higher than the general population (RR = 1·4 to 2·0)(Reference Vancampfort, Stubbs and Mitchell1). Physical health comorbidities are the largest contributor to the 13–15-year mortality gap in people with SMI compared with the general population, drive psychotropic medication non-adherence(Reference Semahegn, Torpey and Manu2) and reduce quality of life(Reference Barnes, Murphy and Fowler3). The reasons for this are not fully understood but include medication side-effects(Reference Correll, Detraux and De Lepeleire4), characteristics of the mental illness(Reference Vancampfort, De Hert and Stubbs5), detrimental lifestyle(Reference Teasdale, Ward and Samaras6–Reference Vancampfort, Firth and Schuch8), stigma and diagnostic overshadowing(Reference Jones, Howard and Thornicroft9).
People living with SMI frequently experience significant weight gain early in the course of the illness and psychotropic medication exposure, particularly second-generation antipsychotic medications(Reference Correll, Manu and Olshanskiy10). These medications are often essential for managing psychiatric symptoms; however, appetite and binge eating behaviours may increase(Reference Cuerda, Velasco and Merchán-Naranjo11). A systematic critical reappraisal showed that without physical health intervention, people with first-episode psychosis commencing antipsychotic medication gain on average 7·1–9·2 kg in weight with olanzapine, 4·0–5·6 kg with risperidone and 2·6–3·8 kg with haloperidol in the first 10–12 weeks of treatment(Reference Alvarez-Jimenez, Gonzalez-Blanch and Crespo-Facorro12). This weight gain can continue for 10–20 years in those who receive ongoing antipsychotic medication treatment for enduring SMI(Reference Strassnig, Kotov and Cornaccio13). However, the higher risk for metabolic syndrome and its elements is not exclusively due to antipsychotic medication, with increased risk for abdominal obesity (OR = 4·43), metabolic syndrome (OR = 2·35) and diabetes (OR = 1·99) being observed in antipsychotic-naïve people with schizophrenia compared with general population controls(Reference Vancampfort, Wampers and Mitchell14).
A lower resting metabolic rate (RMR) in people with SMI compared with people without mental illness has been suggested as a potential driving factor. A review published in 2013 examined studies that assessed the impact of antipsychotic medications on RMR in healthy volunteers and in people with SMI(Reference Cuerda, Velasco and Merchán-Naranjo11). This review suggested that antipsychotic medications may impact RMR and questioned the validity of using predictive equations such as the Harris–Benedict and Schofield equations. However, it lacked the comprehensive approach of a systematic review(Reference Cuerda, Velasco and Merchán-Naranjo11). To the authors’ knowledge, a comprehensive systematic review and critical evaluation of the literature on RMR in people living with SMI has not been undertaken.
This study aims to systematically review whether RMR measured via indirect calorimetry (IC) in people with SMI differs: (i) from RMR via IC in controls, (ii) values derived from predictive equations (e.g., Harris–Benedict) and (iii) after administration of antipsychotic medication.
Methods
This systematic review was pre-registered on the PROSPERO database (CRD42022312667) and was reported in line with Preferred Reporting Items for Systematic Reviews and Meta-Analyses (PRISMA) guidelines (see online Supplementary Table 1 for completed PRISMA checklist)(Reference Page, McKenzie and Bossuyt15).
Search strategy
An online search was undertaken to identify studies published from database inception to March 2022. PubMed, Embase via Ovid, CENTRAL via Ovid, CINAHL via EBSCOhost and PsychINFO via Ovid were searched using a comprehensive search strategy (online Supplementary Tables 2(a)–(e)). The search strategy was developed by researchers in the fields of nutrition and psychiatry, experienced in systematic review. This was complemented by targeted Google Scholar searches and screening of the reference list of a relevant scoping review. For publications with insufficient or missing information, email contact was attempted with corresponding authors a maximum of two times, 2 weeks apart. Searches were restricted to human studies. There was no language restriction. Google Translate was used for studies published in a language other than English(Reference Jackson, Kuriyama and Anton16).
The following Participant, Intervention/exposure, Comparator, Outcome, Study Design (PICOS) framework was developed to define inclusion and exclusion criteria (Table 1). Studies were included if they provided data on RMR measured by IC for people with SMI, including clinical (Diagnostic and Statistical Manual of Mental Disorders (DSM), e.g., DSM-5(17) or International Classification of Diseases (ICD), e.g., ICD-11(18)) diagnosis of schizophrenia and related psychoses, and/or bipolar affective disorder, and compared this to data to: (i) RMR measured by IC for a control group, (ii) predictive equations and/or (iii) RMR measured by IC for people with SMI post-administration of antipsychotic medication.
Table 1. PICOS: inclusion and exclusion criteria of the review
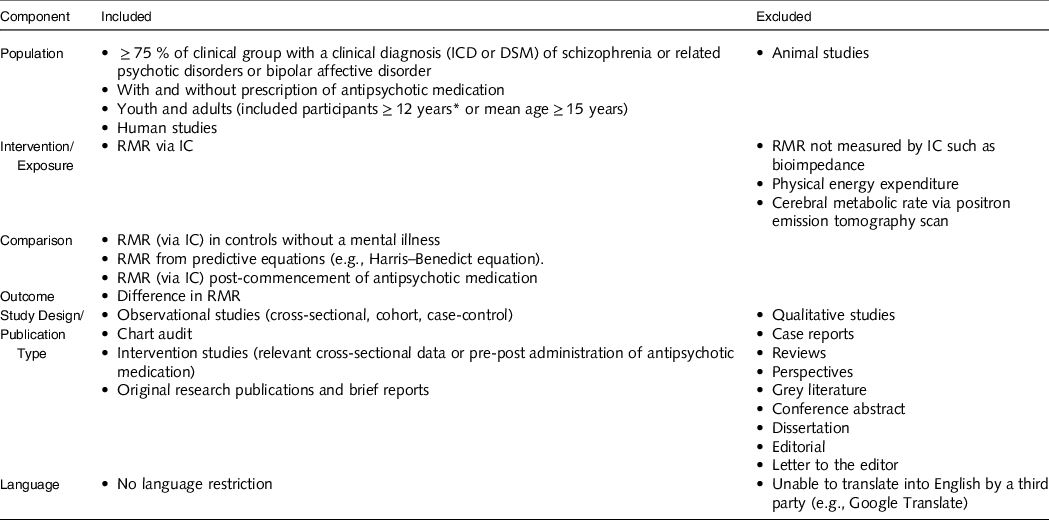
IC, indirect calorimetry; ICD, International Classification of Diseases; DSM, Diagnostic and Statistical Manual of Mental Disorders.
* Australian Institute of Health and Welfare defines youth age starts from 12 years.
Types of articles included were observational studies (cross-sectional, case–control, cohort) and intervention studies (baseline data or pre–post administration of antipsychotic medication). Included article types were full-length original data articles. Excluded study and article types were qualitative studies, case reports, reviews, perspectives, grey literature, conference abstracts, dissertations, editorials and letters to the editor.
Study selection
For the purpose of this review, a ‘study’ (or ‘studies’) refers to a publication(s) and a ‘dataset’ refers to a set of data within a study relevant to a single outcome of interest, so one study may have multiple datasets of interest. Completed searches were exported and combined in Endnote 20 (Clarivate, Philadelphia, 2013) and deduplicated. Two reviewers (SYN and ST) screened all identified records through Covidence (Veritas Health Innovation, Melbourne) in two phases (i) title/abstract screening and (ii) full-text screening. Disagreements on included and excluded studies were resolved through discussion between reviewers. Reasons for exclusion, e.g., ‘wrong population’, were agreed upon and recorded for all the studies that did not meet the inclusion criteria during full-text screening.
Data extraction
Data were extracted independently by two reviewers (SYN and ST) through Covidence (Veritas Health Innovation, Melbourne), and any disagreements were resolved through discussion. The following data were extracted: reference (author, year, country), study design, study aim, target group and comparator group details (diagnoses/comparator, sample size, gender, age and other reported factors that may impact RMR, e.g., BMI), RMR data such as group mean/median and/or between-group data (e.g., mean biases, p-values) and spread of data values, and other additional information relevant to RMR (e.g., gender differences, adjusting for other factors).
Risk of bias
Risk of bias assessment was conducted independently by two reviewers (SYN and OAY) using the Joanna Briggs Institute Critical Appraisal Checklists for observational studies (Checklist for Cohort Studies and Checklist for Analytical Cross-sectional Studies)(19) and Cochrane Risk of bias tool for intervention studies(Reference Higgins, Savović, Page, Higgins, Thomas and Chandler20). The Joanna Briggs Institute tools evaluated eleven and eight domains for cohort and cross-sectional studies, respectively, and scored as ‘yes’ (=1), ‘no’ (=0), ‘unclear’ (=?) or ‘not applicable’ (=NA). The Cochrane Risk of bias tool evaluated seven domains: sequence generation, allocation concealment, blinding of participants and personnel, blinding of outcome data, incomplete data outcome, selective reporting and other sources of bias. Then each domain was evaluated as ‘low risk’ (=1), ‘high risk’ (=0) or ‘unsure’ (=?). For each tool, a final score of ≥ 75 % was considered ‘high quality’, while < 75 % was considered ‘low quality’. In the Joanna Briggs Institute tool, the criteria for ‘were the outcomes measured in a valid and reliable way’ was identified as ‘not applicable’ as it was covered in the criteria for ‘was the exposure measured in a valid and reliable exposure way’. Any discrepancies with quality assessment were resolved through discussion between reviewers.
Certainty of evidence
Certainty of the evidence for each outcome was conducted independently by two reviewers (SYN and OAY) using Grades of Recommendation, Assessment, Development and Evaluation (GRADE)(Reference Schünemann, Brożek and Guyatt21). GRADE evaluated five domains: risk of bias, inconsistency, indirectness, imprecision and publication bias. Each domain was then evaluated to rate the certainty of evidence as ‘high’, ‘moderate’, ‘low’ or ‘very low’. Publication bias was rated as either ‘undetected’ or ‘strongly suspected’. Overall certainty of evidence for each outcome was then assessed as ‘high’, ‘moderate’, ‘low’ or ‘very low’. Any discrepancies with GRADE were resolved through discussion between the reviewers. All outcomes with ≥ 2 datasets were subjected to GRADE assessment.
Inconsistency was downgraded if studies under the same outcome had large variations in point estimates/presence of heterogeneity. Indirectness was downgraded if studies under the same outcome varied in the study population, prognostic factor (SMI) and outcomes. Imprecision was downgraded if sample sizes were too small to detect a significant difference and thus had wide CI. Publication bias was downgraded if there was a small sample size and if there was an unequal distribution presented in the funnel plot.
Data analysis
The group means or between-group difference in RMR between the target population group (SMI) and each comparator group (i) controls, (ii) predictive equations and (iii) after administration of antipsychotic medications were compared for strength (degree of difference and statistical significance) through narrative synthesis.
Outcomes with ≥ 2 datasets were pooled for meta-analysis using comprehensive meta-analysis(Reference Borenstein, Hedges and Higgins22). For a dataset to be included, there needed to be sufficient information reported, for example, group means, standard deviations (sd’s) and sample size, or mean difference, sd and sample size. For comparing RMR between people with SMI and controls, participants needed to be matched for age, sex, BMI and body fat percentage. Due to anticipated heterogeneity, a random effects model was applied. Outcomes were reported as standardised mean difference (SMD) and 95 % CI’s. SMD’s were considered small at 0·2, medium at 0·5 and large at 0·8(Reference Cohen23). Heterogeneity was assessed using the I 2 statistic. Publication bias was assessed by inspection of funnel plots and the Egger’s regression test. Duval and Tweedie’s trim and fill analysis was used to correct for publication bias. Statistical significance was set at P < 0·05 for SMD, heterogeneity and publication bias.
Results
Study selection
The systematic search identified 516 unique titles after the removal of 313 duplicates. A total of forty-three studies were eligible for full-text screening. From this, thirteen studies were included in the final analysis (Fig. 1).

Fig. 1. PRISMA flowchart.
Study characteristics
One RCT(Reference Park, Yi and Kim24), ten cross-sectional studies(Reference Sharpe, Byrne and Stedman25–Reference Sugawara, Yasui-Furukori and Tomita34) and two cohort studies(Reference Cuerda, Merchan-Naranjo and Velasco35,Reference Graham, Perkins and Edwards36) were included (Table 2). Five studies targeted schizophrenia and related psychoses(Reference Sharpe, Byrne and Stedman25,Reference Nilsson, Forslund and Olsson26,Reference Sharpe, Stedman and Byrne29,Reference Sugawara, Yasui-Furukori and Tomita34,Reference Graham, Perkins and Edwards36) , four targeted bipolar disorder I (BD-I)(Reference Caliyurt and Altiay27,Reference Fleet-Michaliszyn, Soreca and Otto28,Reference Soreca, Mauri and Castrogiovanni30,Reference Miniati, Calugi and Simoncini31) , three targeted both schizophrenia and related psychoses, and bipolar affective disorder(Reference Sharpe, Stedman and Byrne32,Reference Skouroliakou, Giannopoulou and Kostara33,Reference Cuerda, Merchan-Naranjo and Velasco35) and one targeted first episode psychosis(Reference Graham, Perkins and Edwards36). Sample size of SMI population groups ranged from n 9 to n 128. Nine studies included both males and females(Reference Park, Yi and Kim24,Reference Nilsson, Forslund and Olsson26,Reference Caliyurt and Altiay27,Reference Soreca, Mauri and Castrogiovanni30,Reference Sharpe, Stedman and Byrne32–Reference Graham, Perkins and Edwards36) , two studies were limited to only males(Reference Sharpe, Byrne and Stedman25,Reference Sharpe, Stedman and Byrne29) and two studies were limited to only females(Reference Fleet-Michaliszyn, Soreca and Otto28,Reference Miniati, Calugi and Simoncini31) . Selected studies were based in different countries including Australia (n 3)(Reference Sharpe, Byrne and Stedman25,Reference Sharpe, Stedman and Byrne29,Reference Sharpe, Stedman and Byrne32) , USA (n 2)(Reference Fleet-Michaliszyn, Soreca and Otto28,Reference Graham, Perkins and Edwards36) , Italy (n 2)(Reference Soreca, Mauri and Castrogiovanni30,Reference Miniati, Calugi and Simoncini31) , Spain (n 1)(Reference Cuerda, Merchan-Naranjo and Velasco35), Turkey (n 1)(Reference Caliyurt and Altiay27), Sweden (n 1)(Reference Nilsson, Forslund and Olsson26), Greece (n 1)(Reference Skouroliakou, Giannopoulou and Kostara33), South Korea (n 1)(Reference Park, Yi and Kim24) and Japan (n 1)(Reference Sugawara, Yasui-Furukori and Tomita34). All were published between the years 2005 and 2015. Individual study details are listed in Table 2.
Table 2. Characteristics of selected studies
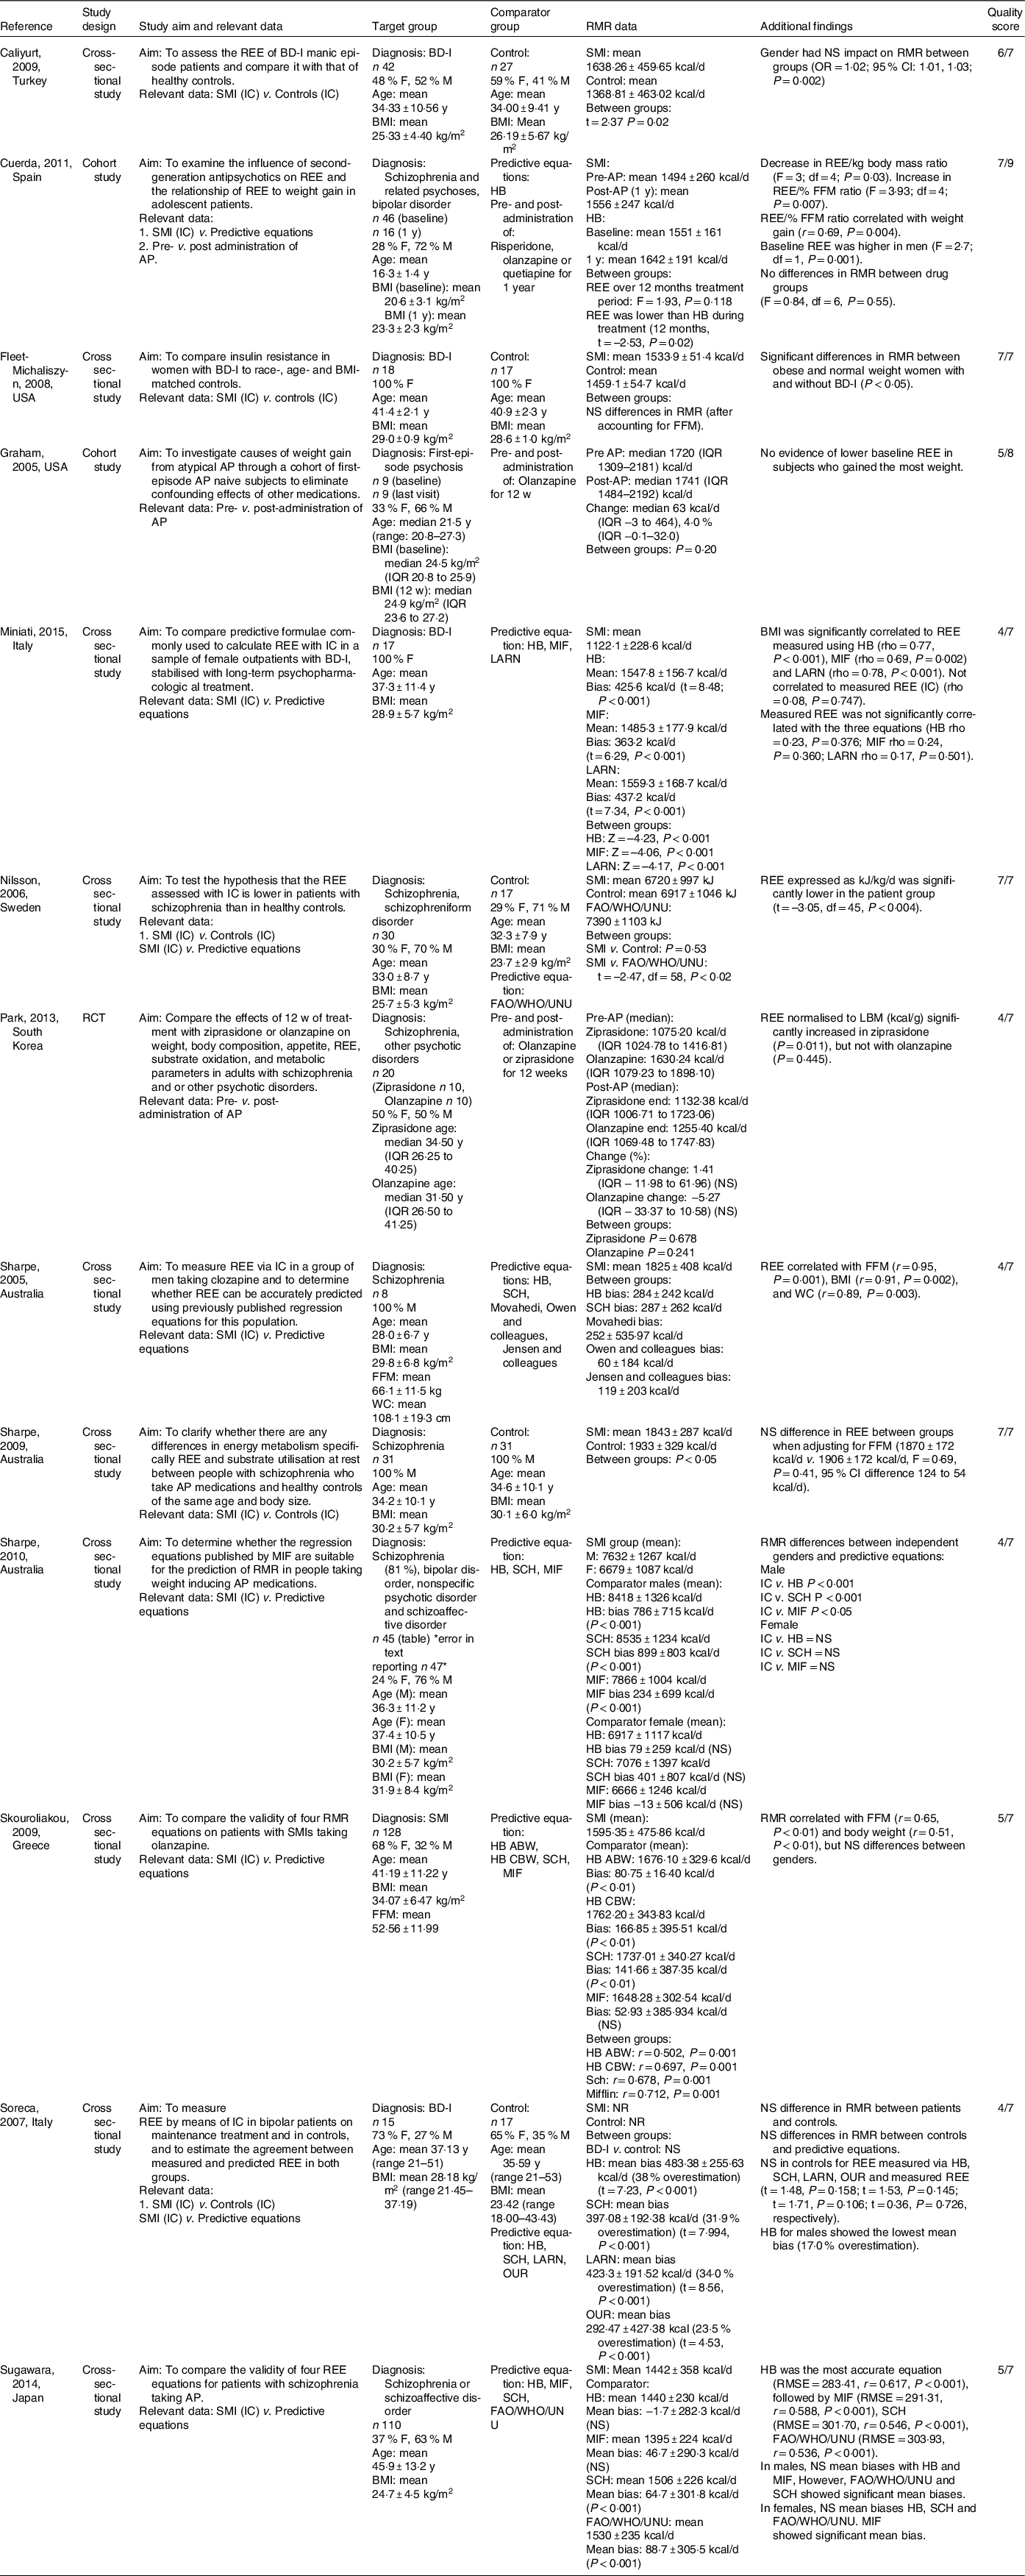
ABW, actual body weight; AP, antipsychotic(s); BD-I, bipolar disorder I; CBW, current body weight; d, day; F, female; FAO/WHO/UNU, Food & Agriculture Organisation/World Health Organisation/United Nations University; FFM, fat-free mass; HB, Harris Benedict; LARN, Recommended Nutrients Assumption Levels; LBM, lean body mass; M, male;, MIF, Mifflin–St. Jeor; REE, resting energy expenditure, SCH, Schofield; SMI, serious mental illness; w, week; wc, waist circumference; y, year.
Quality assessment using the Cochrane Risk of bias tool and Joanna Briggs Institute critical appraisal tools revealed that 5/13 studies were considered as ‘High quality’(Reference Nilsson, Forslund and Olsson26–Reference Sharpe, Stedman and Byrne29,Reference Cuerda, Merchan-Naranjo and Velasco35) , while 8/13 studies were considered as ‘Low quality’ (Reference Park, Yi and Kim24,Reference Sharpe, Byrne and Stedman25,Reference Sharpe, Stedman and Byrne29–Reference Miniati, Calugi and Simoncini31,Reference Skouroliakou, Giannopoulou and Kostara33,Reference Sugawara, Yasui-Furukori and Tomita34,Reference Graham, Perkins and Edwards36) , (online Supplementary Tables S2–S4).
Within the thirteen studies, there were nineteen primary datasets of interest. Eight studies provided a single dataset of interest(Reference Sharpe, Byrne and Stedman25,Reference Caliyurt and Altiay27–Reference Sharpe, Stedman and Byrne29,Reference Miniati, Calugi and Simoncini31,Reference Skouroliakou, Giannopoulou and Kostara33,Reference Sugawara, Yasui-Furukori and Tomita34,Reference Graham, Perkins and Edwards36) , three studies provided datasets for two different review questions(Reference Nilsson, Forslund and Olsson26,Reference Soreca, Mauri and Castrogiovanni30,Reference Cuerda, Merchan-Naranjo and Velasco35) , one study presented a dataset on men and women individually without an overall analysis(Reference Sharpe, Stedman and Byrne32), one study presented data compared with controls prior to antipsychotic medication exposure and then in a smaller sample at follow up subsequent to weight gain(Reference Cuerda, Merchan-Naranjo and Velasco35) and one RCT presented pre–post antipsychotic data separately for the two antipsychotic medication arms without a combined analysis(Reference Park, Yi and Kim24).
Five datasets investigated RMR between people with SMI and controls(Reference Nilsson, Forslund and Olsson26–Reference Soreca, Mauri and Castrogiovanni30). Ten datasets investigated RMR between people with SMI and predictive equations(Reference Sharpe, Byrne and Stedman25,Reference Nilsson, Forslund and Olsson26,Reference Sharpe, Stedman and Byrne29–Reference Miniati, Calugi and Simoncini31,Reference Skouroliakou, Giannopoulou and Kostara33–Reference Cuerda, Merchan-Naranjo and Velasco35) . Predictive equations that were reported included: Harris–Benedict (n 9)(Reference Sharpe, Byrne and Stedman25,Reference Sharpe, Stedman and Byrne29–Reference Miniati, Calugi and Simoncini31,Reference Skouroliakou, Giannopoulou and Kostara33–Reference Cuerda, Merchan-Naranjo and Velasco35) , Schofield (n 6)(Reference Sharpe, Byrne and Stedman25,Reference Soreca, Mauri and Castrogiovanni30,Reference Sharpe, Stedman and Byrne32–Reference Sugawara, Yasui-Furukori and Tomita34) , Mifflin–St. Jeor (n 5)(Reference Miniati, Calugi and Simoncini31–Reference Sugawara, Yasui-Furukori and Tomita34), FAO/WHO/UNU (n 2)(Reference Nilsson, Forslund and Olsson26,Reference Sugawara, Yasui-Furukori and Tomita34) , LARN (n 2)(Reference Soreca, Mauri and Castrogiovanni30,Reference Miniati, Calugi and Simoncini31) , OUR (n 1)(Reference Soreca, Mauri and Castrogiovanni30), Movahedi (n 1)(Reference Sharpe, Byrne and Stedman25), Owen and colleagues (n 1)(Reference Sharpe, Byrne and Stedman25) and Jensen and colleagues (n 1)(Reference Sharpe, Byrne and Stedman25). Four datasets investigated RMR pre and post-administration of antipsychotic medication(Reference Park, Yi and Kim24,Reference Cuerda, Merchan-Naranjo and Velasco35,Reference Graham, Perkins and Edwards36) . Antipsychotic medications that were reported included: olanzapine (n 3)(Reference Park, Yi and Kim24,Reference Cuerda, Merchan-Naranjo and Velasco35,Reference Graham, Perkins and Edwards36) , ziprasidone (n 1)(Reference Park, Yi and Kim24), risperidone (n 1)(Reference Cuerda, Merchan-Naranjo and Velasco35) and quetiapine (n 1)(Reference Cuerda, Merchan-Naranjo and Velasco35).
Study results
RMR of people with SMI compared with controls
Two of five datasets (40 %) appropriately matched people with SMI and controls for age, sex, BMI and body fat percentage(Reference Fleet-Michaliszyn, Soreca and Otto28,Reference Sharpe, Stedman and Byrne29) . Sharpe et al. (Reference Sharpe, Stedman and Byrne29) found that males with schizophrenia had a significantly lower RMR compared with controls (P < 0·05). However, when fat-free mass was controlled for, there was no difference between groups (F = 0·69, P = 0·41)(Reference Sharpe, Stedman and Byrne29). Fleet-Michaliszyn et al. (Reference Fleet-Michaliszyn, Soreca and Otto28) found no significant difference in RMR for women with bipolar compared with controls after accounting for body composition; however, people with SMI oxidised 13 % less fat at rest compared with controls. When pooled together, there was no significant difference in RMR between SMI and control (n 2, SMD = 0·58, 95 % CI –1·01, 2·16, P = 0·48, I 2 = 92 %) (Table 3 and Fig. 2).
Table 3. Standardised mean difference of RMR measured by indirect calorimetry compared with controls, predictive equations and pre–post commencement of antipsychotic medication
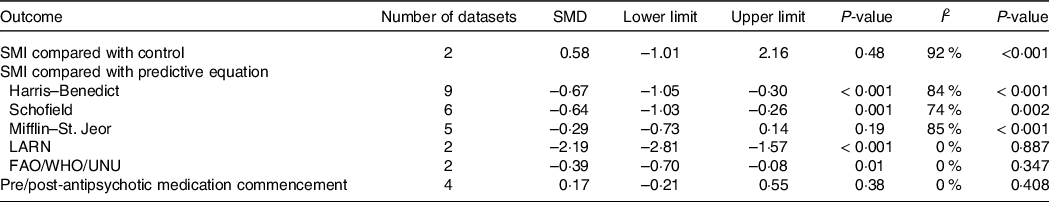
LARN, recommended nutrients assumption levels, FAO/WHO/UNU, Food & Agriculture Organisation/World Health Organisation/United Nations University; SMD, standardised mean difference; SMI, severe mental illness.

Fig. 2. RMR of people with severe mental illness measured by indirect calorimetry compared with controls.
Three datasets included groups that were not adequately matched. Caliyurt et al. (Reference Caliyurt and Altiay27) found that people with BD-I had significantly higher RMR compared with controls (t = 2·37, P = 0·02). In this study, there was a higher number of females in the control group compared with males (59 % compared with 48 %), and authors did not report on matching groups for body composition. Nilsson et al. (Reference Nilsson, Forslund and Olsson26) found no difference between people with SMI and controls (P = 0·53); however, when RMR was expressed by kg, RMR was significantly lower in the SMI group compared with control group (t = −3·05, df = 45, P < 0·004). In this study, BMI and body fat percentages were lower in the control group. Soreca et al. (Reference Soreca, Mauri and Castrogiovanni30) did not provide RMR data but stated no significant difference between the SMI and control groups. In this study, BMI was significantly lower in the control group, and no data were provided on body composition.
RMR of people with SMI compared with predictive equations
Seven out of nine datasets (78 %) revealed that the Harris–Benedict equation significantly overestimated RMR in people with SMI, with discrepancies ranging from 339 to 3,289 kJ/d(Reference Sharpe, Byrne and Stedman25,Reference Soreca, Mauri and Castrogiovanni30–Reference Cuerda, Merchan-Naranjo and Velasco35) . In the two datasets that did not find a significant between-group difference, Sharpe et al. (Reference Sharpe, Stedman and Byrne32) found that the Harris–Benedict equation did not show any significant mean biases in females with schizophrenia or schizoaffective disorder, and Sugawara et al. (Reference Sugawara, Yasui-Furukori and Tomita34) found the Harris–Benedict equation to be the most accurate predictive equation for people with schizophrenia, when compared with Schofield, Mifflin–St-Jeor and FAO/WHO/UNU equations. Pooled effects found a significant overestimation for the Harris–Benedict Equation (n 9, SMD = –0·67, 95 % CI –1·05, –0·30, P < 0·001, I 2 = 84 %) (Table 3; Fig. 3(a)). Publication bias was identified (Fig. 3(b); Egger’s regression: P = 0·04); however, trim and fill analysis did not alter the pooled effects.
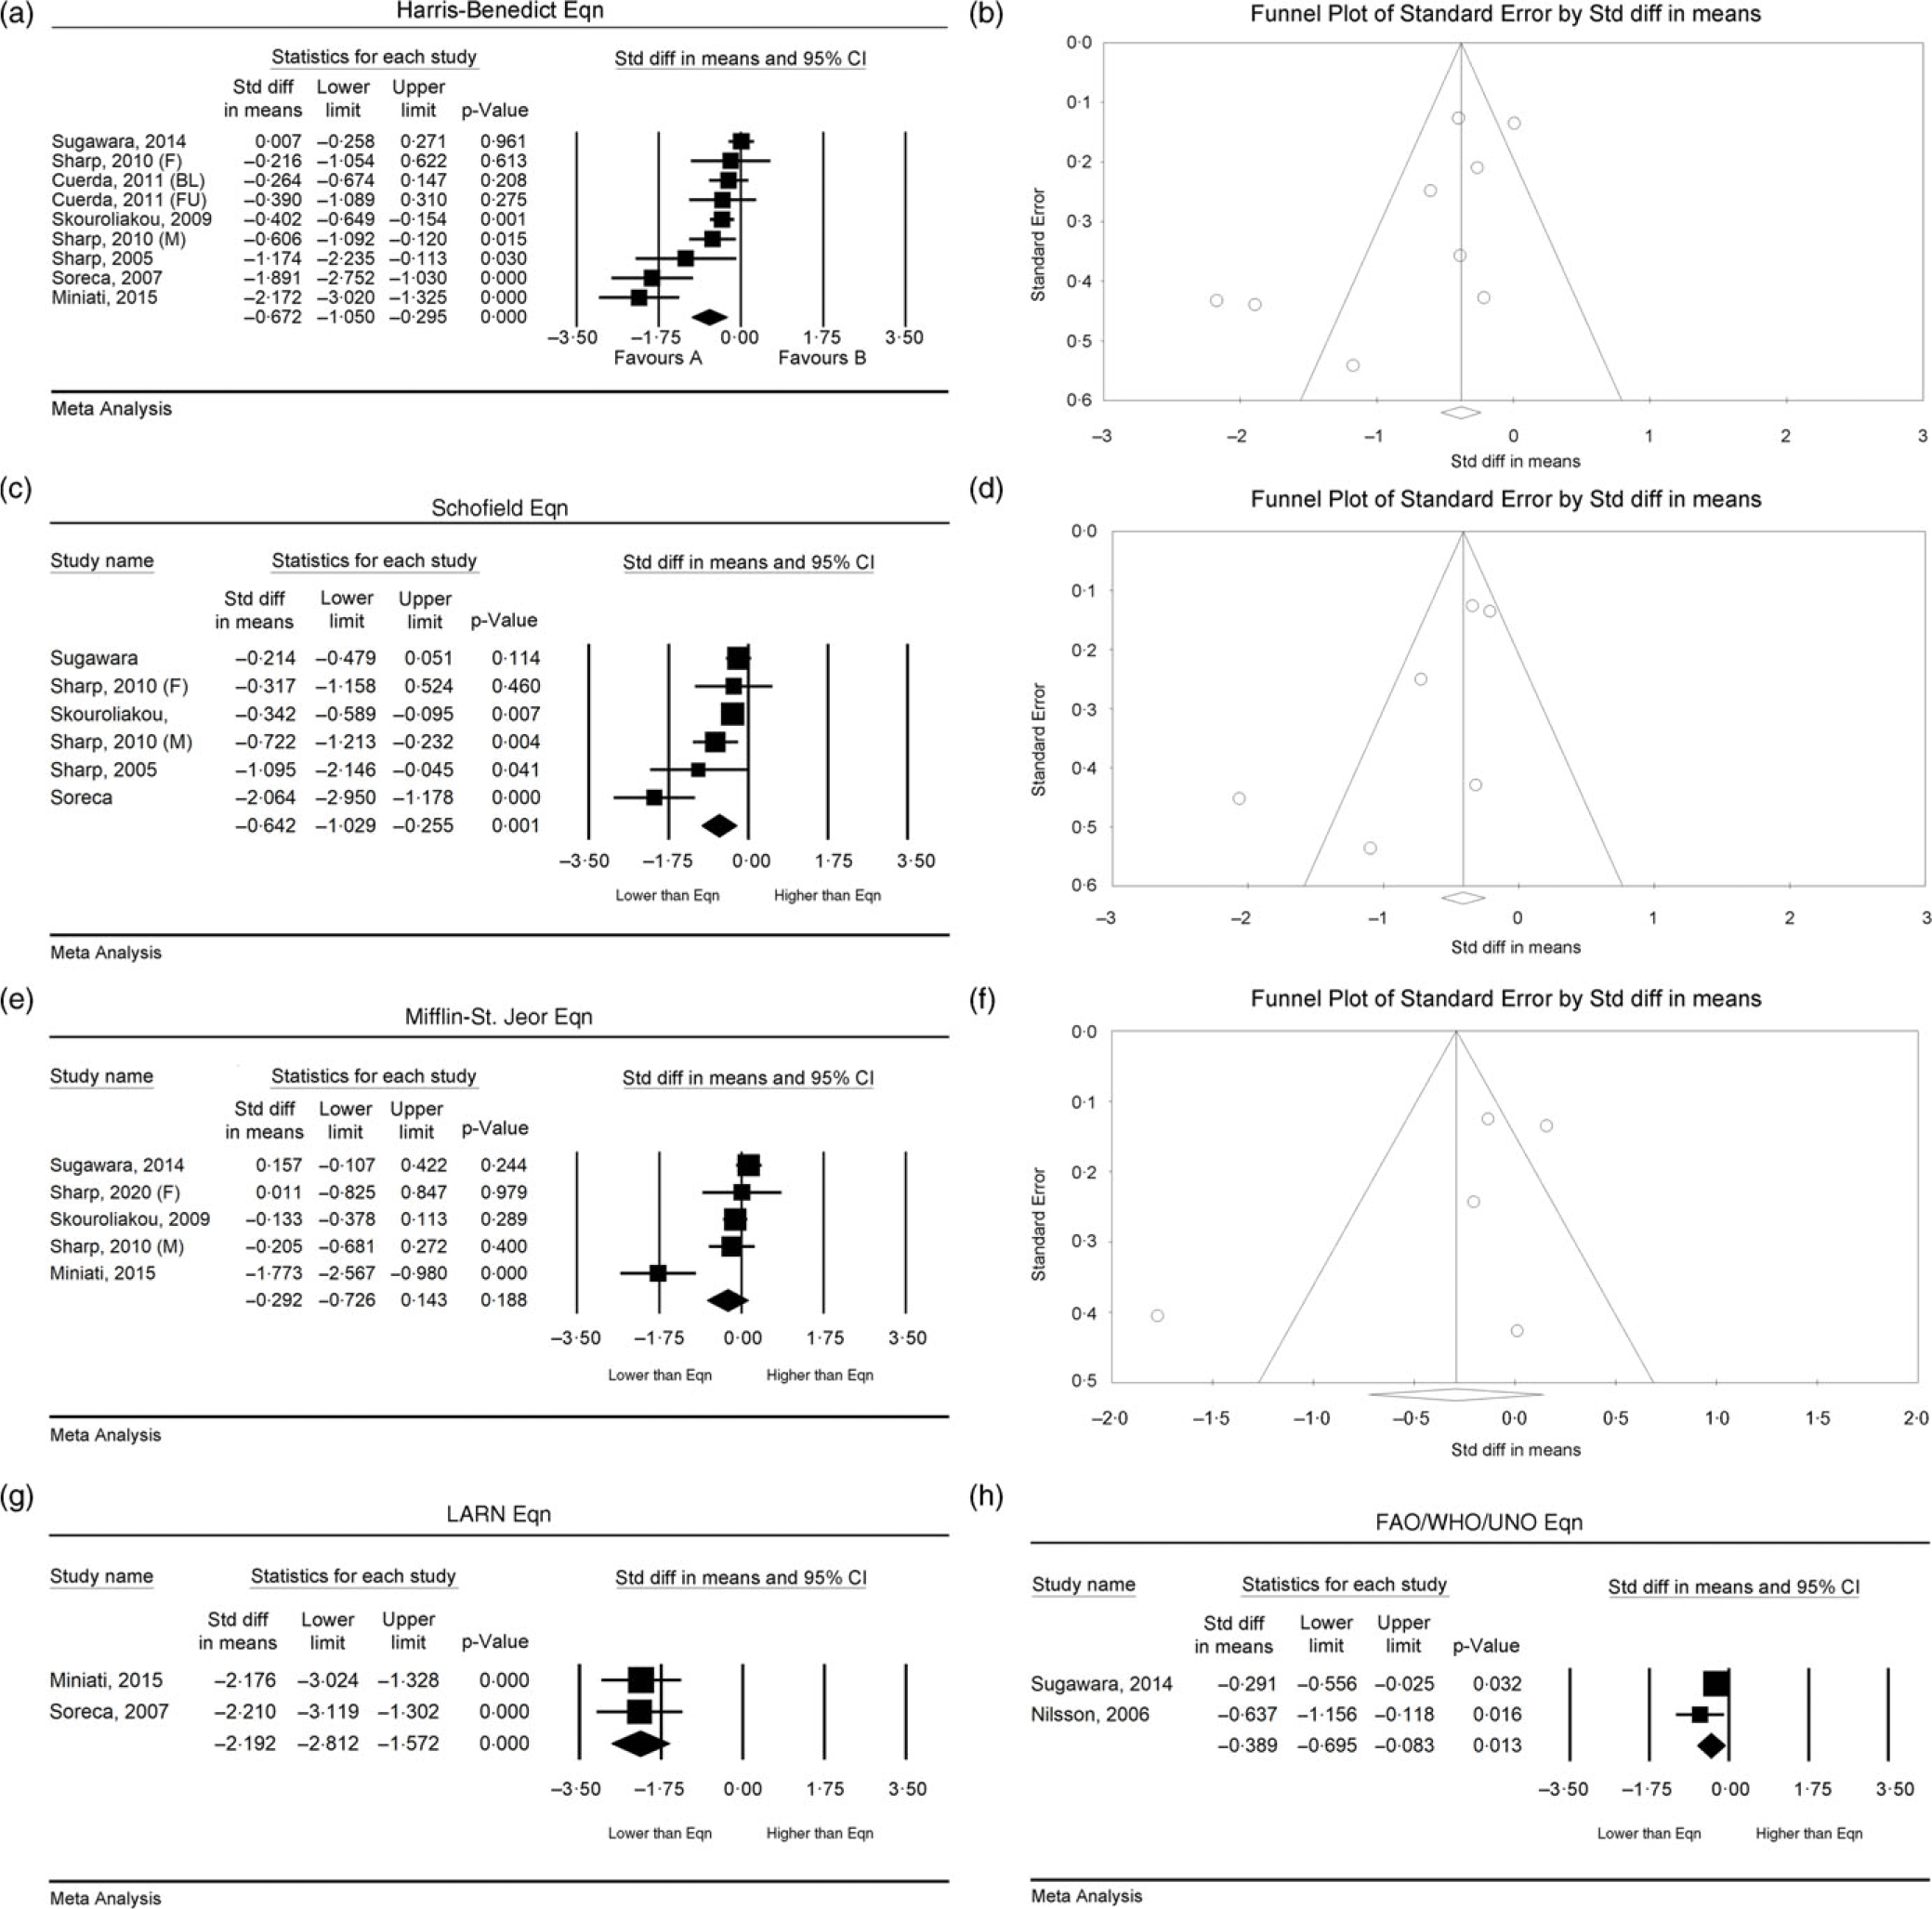
Fig. 3. RMR of people with severe mental illness measured by indirect calorimetry compared with predictive equations. Harris–Benedict equation: (a) forest plot of standardised mean difference, (b) funnel plot assessing publication bias; Schofield equation: (c) forest plot of standardised mean difference, (d) funnel plot assessing publication bias; Mifflin–St. Jeor equation: (e) forest plot of standardised mean difference, (f) funnel plot assessing publication bias; LARN equation: (g) forest plot of standardised mean difference; FAO/WHO/UNU equation: (h) forest plot of standardised mean difference. FAO, Food and Agriculture Organisation; LARN: SMD, standardised mean difference; UNU, United Nations University.
Five out of six datasets (83 %) that compared RMR in SMI to the Schofield equation found that there was a significant overestimation of RMR, with a bias ranging from 272 to 3,761 kJ/d(Reference Sharpe, Byrne and Stedman25,Reference Soreca, Mauri and Castrogiovanni30,Reference Sharpe, Stedman and Byrne32–Reference Sugawara, Yasui-Furukori and Tomita34) . In the dataset that did not find a between-group difference, Sharpe et al. (Reference Sharpe, Stedman and Byrne32) found that the Schofield equation did not show any significant mean biases in females with schizophrenia or schizoaffective disorder. Pooled effects found significant overestimation when using the Schofield equation (n 6, SMD = –0·64, 95 % CI –1·03, –0·26, P = 0·001, I 2 = 74 %) (Table 3, Fig. 3(c)), with no indication of publication bias (Fig. 3(d); Egger’s regression: P = 0·09).
One out of five datasets (20 %) found the Mifflin–St-Jeor equation to significantly differ from the RMR of people with SMI. In the one dataset that found a statistical difference, Sharpe et al. (Reference Sharpe, Stedman and Byrne32) found significant mean bias in males by 979 kJ/d (P < 0·001). In a subgroup analysis, Miniati et al. (Reference Miniati, Calugi and Simoncini31) reported that the Mifflin–St. Jeor equation significantly overestimated RMR in females with BD-I by 1,519 kJ/d (t = 6·29, P < 0·001). Skouroliakou et al. (Reference Skouroliakou, Giannopoulou and Kostara33), Sugawara et al. (Reference Sugawara, Yasui-Furukori and Tomita34) and the female analysis dataset within Sharpe et al. (Reference Sharpe, Stedman and Byrne32) revealed no significant mean bias. Pooled effects found no significant bias when using the Mifflin–St-Jeor equation (n 5, SMD = −0·29, 95 % CI −0·73, 0·14, P = 0·19, I 2 = 85 %) (Table 3; Fig. 3(e)); however, heterogeneity was significant. There was no indication of publication bias (Fig. 3(f); Egger’s regression: P = 0·28).
Two datasets out of two found that the LARN equation significantly overestimates RMR in people with BD-I by 1,770 to 1,828 kJ/d (P ≤ 0·001) (Reference Soreca, Mauri and Castrogiovanni30,Reference Miniati, Calugi and Simoncini31) . Pooled effects found significant overestimation when using the LARN equation (n 2, SMD = −0·39, 95 % CI −0·70, −0·08, P = 0·01, I 2 = 0 %) (Table 3; Fig. 3(g)).
Two of two datasets (100 %) found that the FAO/WHO/UNU equation showed significant mean biases and overestimation of RMR(Reference Nilsson, Forslund and Olsson26,Reference Sugawara, Yasui-Furukori and Tomita34) . Sugawara et al. (Reference Sugawara, Yasui-Furukori and Tomita34) found a significant overestimation by 372 kJ/d (P < 0·02) in people with schizophrenia or schizoaffective disorder. However, when adjusting for gender, there was no significant difference in RMR for females with schizophrenia or schizoaffective disorder.(Reference Sugawara, Yasui-Furukori and Tomita34) Pooled effects found significant overestimation when using the FAO/WHO/UNU equation (n 2, SMD = –0·39, 95 % CI –0·70, –0·08, P = 0·01, I 2 = 0 %) (Table 3; Fig. 3(h)).
The OUR(Reference Soreca, Mauri and Castrogiovanni30), Movahedi(Reference Sharpe, Byrne and Stedman25) and Jensen and colleagues(Reference Sharpe, Byrne and Stedman25) equations were found to overestimate RMR in people with SMI by 1,222 kJ/d, 1,054 kJ/d and 498 kJ/d, respectively, while the Owen and colleagues equation underestimated RMR by 251 kJ/d(Reference Sharpe, Byrne and Stedman25).
RMR of people with SMI pre- and post-antipsychotic medication exposure
All datasets (n 4) assessing RMR difference pre- and post-administration of antipsychotic medications revealed no significant changes22,31,32. Changes in RMR ranged from −5·27 % to 4 %30,31. When pooled for meta-analysis, there was no difference between pre- and post-data (n 4, SMD = 0·17, 95 % CI −0·21, 0·55, P = 0·38, I 2 = 0 %) (Table 3, Fig. 4(a)) with no indication of publication bias (Fig. 4(b); Egger’s regression: P = 0·64). When adjusted to lean body mass, Park et al. (Reference Borenstein, Hedges and Higgins22) found a significant increase in RMR at follow-up in the ziprasidone group (P = 0·011) but not in the olanzapine group (P = 0·445). Cuerda et al. (Reference Miniati, Calugi and Simoncini31) provided a subgroup investigation on three antipsychotic medications (olanzapine, risperidone and quetiapine) and revealed no differences in RMR between the antipsychotic groups (F = 0·84, df = 6, P = 0·55).
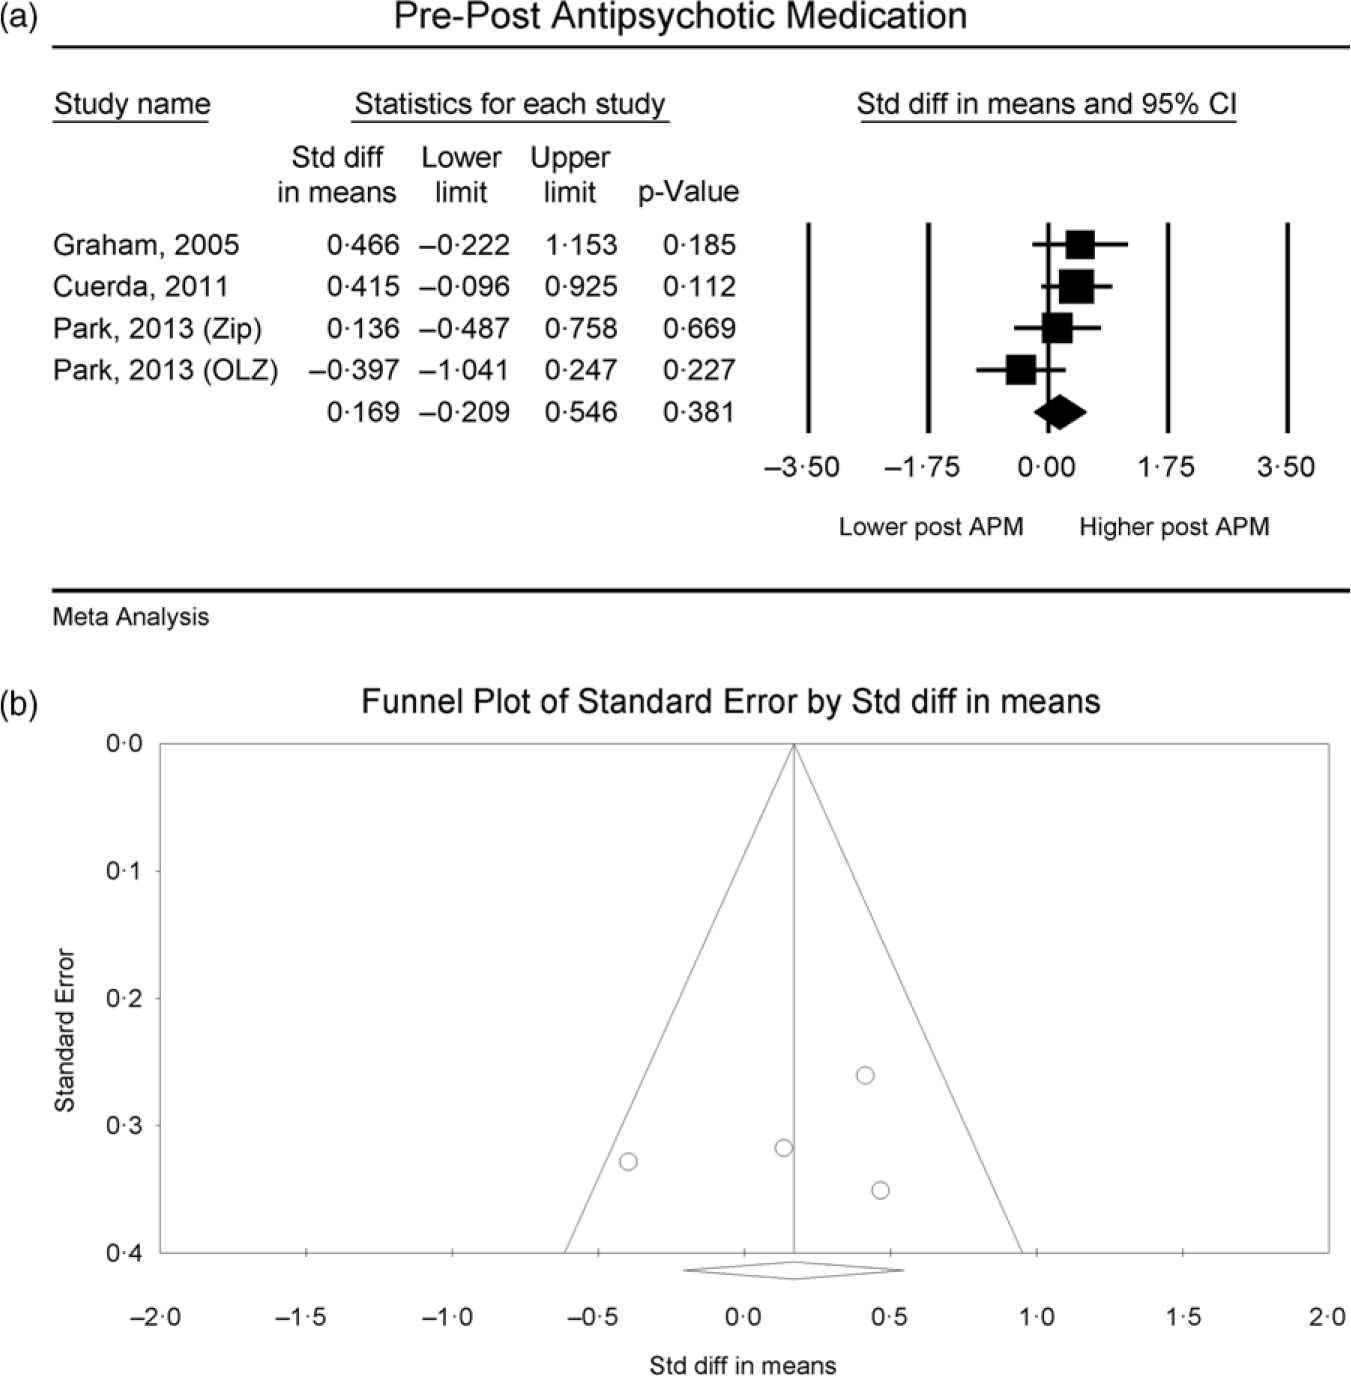
Fig. 4. RMR of people with severe mental illness measured by indirect calorimetry pre- and post-commencement of antipsychotic medication, (a) forest plot of standardised mean difference, (b) funnel plot assessing publication bias.
Certainty of evidence
Certainty of the evidence is summarised in Table 4. The certainty of evidence for comparing RMR between SMI and controls was very low predominantly due to indirectness, imprecision and publication bias. The certainty of evidence in relation to predictive equations ranged from low (LARN and FAO/WHO/UNU) to moderate (Harris–Benedict, Schofield and Mifflin–St-Jeor). The certainty of evidence for pre–post administration of APM was low due to risk of bias, indirectness, imprecision and publication bias.
Table 4. Assessment of quality and certainty using GRADE
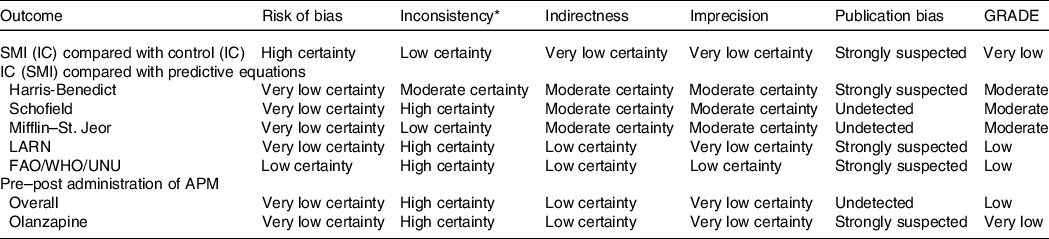
APM, antipsychotic medication; IC, indirect calorimetry; SMI, severe mental illness.
* n/a: Inconsistency could not be assessed for those with single datasets.
Discussion
This review found that (i) there is limited evidence for a difference in RMR between people with SMI and people without an SMI when matched for covariates, (ii) most predictive equations significantly overestimate RMR in people with SMI and (iii) antipsychotic medications do not appear to significantly affect RMR.
It has been proposed that an increased RMR in people with bipolar disorder may be driven by a state of mania(Reference Caliyurt and Altiay27), characterised by a state of intense activity and energy. Conversely, in people with schizophrenia spectrum disorders, it has been hypothesised that RMR is lower than people without a mental illness due to a decrease in oxidative processes, independent of medication status(Reference Nilsson, Forslund and Olsson26). Our review found that inconsistent results between studies are likely due to covariates that have not been accounted for, for example, a lacking of matching for BMI and body composition(Reference Nilsson, Forslund and Olsson26,Reference Soreca, Mauri and Castrogiovanni30) . Both studies that were adequately matched/adjusted for age, sex, BMI body composition (e.g., body fat mass) found no significant difference between people with and without SMI. Future studies exploring RMR in people with SMI compared with other population groups should ensure that covariates are adequately matched/adjusted for.
Despite low to very low certainty in evidence for comparing RMR in SMI to people without mental illness and pre- and post-antipsychotic medication administration, there is little to suggest that an altered RMR is significantly contributing to the high rates of obesity in people with SMI(Reference Afzal, Siddiqi and Ahmad37). There is a greater evidence base for excessive and unhealthy dietary intake(Reference Teasdale, Ward and Samaras6), driven by factors including antipsychotic medications, which can increase appetite and reduce satiety(Reference Fountaine, Taylor and Mancuso38), and a blunted reward system(Reference Elman, Borsook and Lukas39), combined with high levels of sedentary behaviour(Reference Stubbs, Williams and Gaughran40), driven by factors such as fatigue and low energy which can be a result of negative symptoms of the illness and sedative effects of medications(Reference Firth, Rosenbaum and Stubbs41).
Most predictive equations significantly overestimated RMR in people with SMI, including those commonly used in clinical practice (e.g., Harris–Benedict and. Schofield equation). An avenue requiring further exploration is the use of adjusted body weight measurement when a person is overweight/obese compared with using actual body weight in the equation. The use of actual body weight for the Harris–Benedict equation may make it a viable option, though at present, the Mifflin–St. Jeor equation appears to be the most accurate for people with SMI. However, caution is required given the observed heterogeneity and moderate certainty of evidence. Interestingly Sugawara et al. (2014) concluded that the Harris–Benedict equation was the most predictive equation in a sample of people with schizophrenia spectrum disorders in Japan(Reference Sugawara, Yasui-Furukori and Tomita34). The lower mean body weight in this sample compared with many other studies conducted in Western countries (and with the use of actual body weight rather than ideal body weight) may explain this. However, ethnicity may be contributing factor, given the development of equations tended to be based on measurements from Caucasian populations.
Authors acknowledge the following limitations. First, the IC machines used differed across studies, increasing the potential for imprecision. Second, despite high consistency in direction of effect (i.e., SMI by subgroup compared with control and IC compared with predictive equations), there was significant heterogeneity. This may be explained, at least in part, by the difference in machines used to assess RMR by IC across studies. Third, many studies included a mix of different diagnoses under the SMI umbrella term, limiting the ability to explore diagnosis effects.
There is little evidence to suggest that the RMR is different between people with SMI and people without, when accounting for covariates such body mass and body composition. Additional studies accounting for covariates are required. Future studies should also test for differences in rates of fat oxidation. Further, the administration of antipsychotic medication does not appear to significantly impact RMR. Overall, there is limited evidence to support a disruption to RMR as a driving factor for weight gain in people with SMI. More established contributing factors are excess caloric intake and high levels of sedentary behaviour.
Supplementary material
For supplementary material/s referred to in this article, please visit https://doi.org/10.1017/S0007114523001162
Acknowledgements
This research received no specific grant from any funding agency, commercial or not-for-profit sectors. The authors declare no conflicts of interest.
Study conception:
S. T.; study design: all authors; search and screening: S. Y. N. and S. T.; data extraction: S. Y. N. and S. T.; quality assessment: S. Y. N. and O. A. Y., meta-analysis: S. T., GRADE: S. Y. N. and O. A. Y. Manuscript development: S. Y. N. and S. T., manuscript review: all coauthors


