


Introduction
Conservation interventions such as the sowing of wild-flower strips in agri-environmental schemes (AES) typically target one or a small number of priority species (Haaland et al., Reference Haaland, Naisbit and Bersier2011). However, the impacts of these interventions on non-target communities are often unknown and difficult to quantify and may influence species composition and the provision of different ecosystem services across the landscape (Haaland et al., Reference Haaland, Naisbit and Bersier2011; Warzecha et al., Reference Warzecha, Diekötter, Wolters and Jauker2018).
Pollination is a vital ecosystem service (Jordan et al., Reference Jordan, Patch, Grozinger and Khanna2021; Khalifa et al., Reference Khalifa, Elshafiey, Shetaia, Abd El-Wahed, Algethami, Musharraf, AlAjmi, Zhao, Masry, Abdel-Daim, Halabi, Kai, Naggar, Bishr, Diab and El-Seedi2021; Silva et al., Reference Silva, Carvalheiro, Aguirre-Gutiérrez, Lucotte, Guidoni-Martins and Mertens2021), with global crop pollination estimated as worth $195 to ~$387 ($267–657) billion annually in 2020 (Porto et al., Reference Porto, de Almeida, Cruz-Neto, Tabarelli, Viana, Peres and Lopes2020). However, many pollinators are threatened, with major declines in insect-pollinator populations (Baldock et al., Reference Baldock, Goddard, Hicks, Kunin, Mitschunas, Osgathorpe, Potts, Robertson, Scott, Stone, Vaughan and Memmott2015) linked to climate change (Hegland et al., Reference Hegland, Nielsen, Lázaro, Bjerknes and Totland2009), habitat loss and urbanization (Garibaldi et al., Reference Garibaldi, Steffan-Dewenter, Kremen, Morales, Bommarco, Cunningham, Carvalheiro, Chacoff, Dudenhöffer, Greenleaf, Holzschuh, Isaacs, Krewenka, Mandelik, Mayfield, Morandin, Potts, Ricketts, Szentgyörgyi, Viana, Westphal, Winfree and Klein2011), agricultural intensification (Kovács-Hostyánszki et al., Reference Kovács-Hostyánszki, Espíndola, Vanbergen, Settele, Kremen and Dicks2017), increased pesticide use (Whitehorn et al., Reference Whitehorn, O'Connor, Wackers and Goulson2012), greater exposure to pathogens and parasites (Cameron et al., Reference Cameron, Lozier, Strange, Koch, Cordes, Solter and Griswold2011) and interactions between these factors (González-Varo et al., Reference González-Varo, Biesmeijer, Bommarco, Potts, Schweiger, Smith, Steffan-Dewenter, Szentgyörgyi, Woyciechowski and Vilà2013; Vanbergen and the Insect Pollinators Initiative, Reference Vanbergen2013; Goulson et al., Reference Goulson, Nicholls, Botías and Rotheray2015). To mitigate pollinator decline, there has been massive investment in agricultural ecosystem improvement (Batáry et al., Reference Batáry, Dicks, Kleijn and Sutherland2015). In the European Union governments subsidize agricultural industries which implement AES (Science for Environment Policy, 2017) and these, in turn, include agri-environmental measures (AEMs). Each measure within a scheme has a specific objective, for example, boosting biodiversity (Ouvrard et al., Reference Ouvrard, Transon and Jacquemart2018), increasing quality of abiotic factors or mitigating against damage to the environment (Science for Environment Policy, 2017).
Within the UK a 10-year plan was implemented in 2014 to support pollinating insects called the National Pollinator Strategy. This AES focuses on increasing floral foraging resource diversity and richness on agricultural farms (DEFRA, 2014). The measures implemented involve sowing wild-flower seeds and the conservation of flower-rich habitats including grasslands and the hedgerows around agricultural fields (Rural Payments Agency, 2019). Although the flower species sown within the National Pollinator Strategy are known to be utilized by the colonial honeybees and bumblebees (Bombus) (Haaland et al., Reference Haaland, Naisbit and Bersier2011; Holland et al., Reference Holland, Smith, Storkey, Lutman and Aebischer2015), 225 of the 250 UK bee species are solitary (Dicks et al., Reference Dicks, Baude, Roberts, Phillips, Green and Carvell2015; Wood et al., Reference Wood, Holland and Goulson2015).
Gresty et al. (Reference Gresty, Clare, Devey, Cowan, Csiba, Malakasi, Lewis and Willis2018) examined the impact of this AES on solitary bee floral use and found no impact of floral provision schemes, suggesting a minimal effect of these interventions even within the same functional group. There is increasing evidence to suggest that these resources may not be utilized by other vital insect pollinators (Wood et al., Reference Wood, Holland and Goulson2017). What has not been investigated is whether these management strategies can impact the wider ecosystem. In particular, non-target taxa like fungi which interact with both the managed floral resources and visiting bee species in multiple ways.
Fungi are a highly diverse taxonomic group, fundamentally important in aquatic (Grossart et al., Reference Grossart, Van den Wyngaert, Kagami, Wurzbacher, Cunliffe and Rojas-Jimenez2019) and terrestrial ecosystems (Stajich et al., Reference Stajich, Berbee, Blackwell, Hibbett, James, Spatafora and Taylor2009; Stephenson, Reference Stephenson2010) carrying out many essential roles and forming numerous mutualistic (Deveau et al., Reference Deveau, Bonito, Uehling, Paoletti, Becker, Bindschedler, Hacquard, Hervé, Labbé, Lastovetsky, Mieszkin, Millet, Vajna, Junier, Bonfante, Krom, Olsson, Dirk van Elsas and Wick2018; Biedermann and Vega, Reference Biedermann and Vega2020; Vincent et al., Reference Vincent, Rafiqi and Job2020) pathogenic (Doehlemann et al., Reference Doehlemann, Ökmen, Zhu, Sharon, Heitman, Howlett, Crous, Stukenbrock, James and Gow2017) or commensal (Wynns et al., Reference Wynns, Jensen and Eilenberg2013) relationships with non-fungal organisms. Factors which enrich or alter the plant community may thus impact fungal biodiversity and the subsequent interactions with the wider biological community.
Many fungi form significant interactions with pollinators (Roy, Reference Roy1994). For example, species within the fungal genera Eremascus, Bettsia and Ascosphaera are documented as bee specialists (Wynns, Reference Wynns2015) with Ascosphaera particularly well-studied and found exclusively in bee nests (Vojvodic et al., Reference Vojvodic, Boomsma, Eilenberg and Jensen2012). Plant richness and diversity have a positive relationship with fungal richness (LeBlanc et al., Reference LeBlanc, Kinkel and Kistler2015) and this can influence pollinator foraging. For example, the composition of pollen provisions of the carpenter bee Ceratina australensis is highly correlated with fungal community composition (McFrederick and Rehan, Reference McFrederick and Rehan2019). This suggests that manipulations of floral provisions, e.g., within AES, may have non-target effects on the fungal community and their interactions with pollinators.
Fungi are extremely diverse (Raja et al., Reference Raja, Miller, Pearce and Oberlies2017), with an estimated 1.5–5.1 million species (Hawksworth, Reference Hawksworth1991; O'Brien et al., Reference O'Brien, Parrent, Jackson, Moncalvo and Vilgalys2005), many of which are unidentified and hard to culture, and morphological species identification is difficult (Lutzoni et al., Reference Lutzoni, Kauff, Cox, McLaughlin, Celio, Dentinger, Padamsee, Hibbett, James, Baloch, Grube, Reeb, Hofstetter, Schoch, Arnold, Miadlikowska, Spatafora, Johnson, Hambleton, Crockett, Shoemaker, Sung, Lücking, Lumbsch, O'Donnell, Binder, Diederich, Ertz, Gueidan, Hansen, Harris, Hosaka, Lim, Matheny, Nishida, Pfister, Rogers, Rossman, Schmitt, Sipman, Stone, Sugiyama, Yahr and Vilgalys2004). Molecular methods of classification are well established in fungal diversity analysis (White et al., Reference White1990) and rely primarily on the internal transcribed spacer (ITS) region of rDNA (Schoch et al., Reference Schoch, Seifert, Huhndorf, Robert, Spouge, Levesque, Chen, Bolchakova, Voigt, Crous, MIller, Wingfield, Aime, An, Bai, Barreto, Begerow, Begeron, Blackwell, Boekhout, Bogale, Boonyuen, Burgaz, Buyck, Cai, Cai, Cardinali, Chaverri, Coppins, Crespo, Cubas, Cummings, Damm, de Beer, de Hoog, Del-Prado, Dentinger, Diéguez-Uribeondo, Divakar, Douglas, Dueñas, Duong, Eberhardt, Edwards, Elshahed, Fliegerova, Furtado, García, Ge, Griffith, Griffiths, Groenewald, Grube, Gryzenhout, Guo, Hagen, Hambleton, Hamelin, Hansen, Harrold, Heller, Herrera, Hirayama, Hirooka, Ho, Hoffmann, Hofstetter, Högnabba, Hollingsworth, Hong, Hosaka, Houbraken, Houbraken, Huhtinen, Hyde, James, Johnson, Johnson, Johnston, Jones, Kelly, Kirk, Knapp, Kõljalg, Kovács, Kurtzman, Landvik, Leavitt, Liggenstoffer, Liimatainen, Lombard, Luangsaard, Lumbsch, Maganti, Maharachchikumbura, Martin, May, McTaggart, Methven, Meyer, Moncalvo, Mongkolsamrit, Nagy, Nilsson, Niskanen, Nyilasi, Okada, Okane, Olariaga, Otte, Papp, Park, Petkovits, Pino Bodas, Quaedvlieg, Raja, Redecker, Rintoul, Ruibal, Sarmiento-Ramírez, Schmitt, Schüßler, Shearer, Sotome, Stefani, Stenroos, Stielow, Stockinger, Suetrong, Suh, Sung, Suzuki, Tanaka, Tedersoo, Telleria, Tretter, Untereiner, Urbina, Vágvölgyi, Vialle, Vu, Walther, Wang, Wang, Weir, Weiß, White, Xu, Yahr, Yang, Yurkov, Zamora, Zhang, Zhuang and Schindel2012; Raja et al., Reference Raja, Miller, Pearce and Oberlies2017). To assign taxonomic affiliation to fungal ITS sequences, the curated UNITE reference database (User-friendly Nordic ITS Ectomycorrhiza database) is frequently used to provide identification hypotheses based on the similarity of an ITS sequences to a known reference (Kõljalg et al., Reference Kõljalg, Nilsson, Abarenkov, Tedersoo, Taylor, Bahram, Bates, Bruns, Bengtsson-Palme, Callaghan, Douglas, Drenkhan, Eberhardt, Dueñas, Grebenc, Griffith, Hartmann, Kirk, Kohout, Larsson, Lindahl, Lücking, Martín, Matheny, Nguyen, Niskanen, Oja, Peay, Peintner, Peterson, Põldmaa, Saag, Saar, Schüßler, Scott, Senés, Smith, Suija, Taylor, Telleria, Weiss and Larsson2013).
Here we use DNA metabarcoding to characterize fungal diversity associated with solitary bees and assess indirect impacts of AES in the UK on the interactions between fungi and solitary bees. To evaluate the relative impact of low and high management farm schemes, we constructed ecological networks of fungi and bees. Ecological networks depict species interactions and permit the quantification of various structural and dynamic properties of these interactions. We compared fungal diversity and bee–fungi interactions on agricultural farms which implement low and high agri-environmental management. We used these data to (1) characterize the fungal community associated with solitary bees, (2) assess any effect of AES floral provisioning (targeted at Apis and Bombus species) on the non-target fungal community associated with solitary bees and (3) assess the impact of these schemes on fungal–bee associations using ecological networks. We tested the hypothesis that increased floral provisions on farms under high management will result in non-target increases in fungal diversity.
Methods
Sample collection and DNA identification
Data for this study were acquired from Gresty et al. (Reference Gresty, Clare, Devey, Cowan, Csiba, Malakasi, Lewis and Willis2018) where full collection details are provided. In brief, solitary bee nests were established in fields in March 2014 and collected in November from 19 farms within a 60-mile radius of Oxford (UK). The farms ranged in the AEMs which were implemented, from no interventions and few interventions (low management) to strictly managed according to AES (high management). Interventions included sowing of flower seed mixes, planting of flower-rich margins and plots and management of hedgerows (Gresty et al., Reference Gresty, Clare, Devey, Cowan, Csiba, Malakasi, Lewis and Willis2018). In total, there were six low management and nine high management farms. Pollen samples were collected from brood cells in bamboo tubes in nest boxes and then resealed and over wintered in a climatically controlled room at 5°C to allow for adult bee emergence. Bees were identified and pollen samples were sequenced using the ITS region which can amplify plant (analysed by Gresty et al., Reference Gresty, Clare, Devey, Cowan, Csiba, Malakasi, Lewis and Willis2018) and fungal materials.
DNA analysis and classification
To remove the primers and adapter remnants from the read files, a custom script based on the command-line tool Cutadapt, was used (Martin, Reference Martin2011). From this, operational taxonomic unit (OTU) tables were constructed (Frøslev et al., Reference Frøslev, Kjøller, Bruun, Ejrnæs, Brunbjerg, Pietroni and Hansen2017). To identify amplicon sequence variants, initial processing used the DADA2 pipeline (Callahan et al., Reference Callahan, McMurdie, Rosen, Han, Johnson and Holmes2016), and subsequently ITSx was used for ITS extraction (Bengtsson-Palme et al., Reference Bengtsson-Palme, Ryberg, Hartmann, Branco, Wang, Godhe, De Wit, Sánchez-García, Ebersberger, de Sousa, Amend, Jumpponen, Unterseher, Kristiansson, Abarenkov, Bertrand, Sanli, Eriksson, Vik, Veldre and Nilsson2013). This was followed by clustering with VSEARCH (Rognes et al., Reference Rognes, Flouri, Nichols, Quince and Mahé2016) at 98.5% to match the consensus clustering level used to delimit species in the UNITE database (Kõljalg et al., Reference Kõljalg, Nilsson, Abarenkov, Tedersoo, Taylor, Bahram, Bates, Bruns, Bengtsson-Palme, Callaghan, Douglas, Drenkhan, Eberhardt, Dueñas, Grebenc, Griffith, Hartmann, Kirk, Kohout, Larsson, Lindahl, Lücking, Martín, Matheny, Nguyen, Niskanen, Oja, Peay, Peintner, Peterson, Põldmaa, Saag, Saar, Schüßler, Scott, Senés, Smith, Suija, Taylor, Telleria, Weiss and Larsson2013). LULU was used for post-clustering curation (Frøslev et al., Reference Frøslev, Kjøller, Bruun, Ejrnæs, Brunbjerg, Pietroni and Hansen2017) to remove any redundant sequences remaining. Classification of OTUs was done using the 2017 UNITE general FASTA release (Frøslev and Ejrnæs, Reference Frøslev and Ejrnæs2018). Sequences with 70% identities or higher were used for classification of OTUs.
Fungal diversity
OTUs were organized into an array of presence/absence matrices considering fungal species vs. bee species by farm. A summary table was generated compiling species into low and high management categories. From this, fungal diversity was calculated with Hill numbers using iNEXT software (Hsieh et al., Reference Hsieh, Ma and Chao2016) in R version 3.6.1 (The R Core Team, 2019). Sample completeness rather than sample size is used for analysis as it more accurately measures the differences in richness between communities and ranks them more efficiently (Chao and Jost, Reference Chao and Jost2012). This is measured by sample coverage obtained with double the sample size (Hsieh et al., Reference Hsieh, Ma and Chao2016). OTU rarefaction curves were compared to analyse fungal richness on low and high management farms.
The OTU sequences were classified into ecological guilds by running them through the FUNGuild database (Nguyen et al., Reference Nguyen, Song, Bates, Branco, Tedersoo, Menke, Schilling and Kennedy2016). This procedure provides a confidence ranking for each OTU classification, referring to the likelihood that an OTU belongs to a specific guild. The rankings are predominantly based on assessments in research literature (Nguyen et al., Reference Nguyen, Song, Bates, Branco, Tedersoo, Menke, Schilling and Kennedy2016). We took a conservative approach and any classification with a confidence ranking of ‘possible’ was reclassified as unknown. Those with confidence ranking of ‘highly probable’ or ‘probable’ (i.e., where there is literature support for a fungi to belong to a specific guild) were retained and allocated to an ecological guild. The ecological or functional guild which a species was allocated to, refers to the way in which a fungi gains nutrients: pathotroph, saprotroph or symbiotroph by harming host, breaking down dead host cells or exchanging resources with host respectively (Nguyen et al., Reference Nguyen, Song, Bates, Branco, Tedersoo, Menke, Schilling and Kennedy2016).
We counted the frequency of detection for each fungal taxon on each farm (e.g., if fungi X was detected in six samples it was assigned the value of 6), which we used to create interaction matrices for each of the farms with different management practices (High = 9 and Low = 7). We calculated the Bray–Curtis dissimilarity with the R package vegan (Oksanen et al., Reference Oksanen, Blanchet, Friendly, Kindt, Legendre, McGlinn, Minchin, O'Hara, Simpson, Solymos, Stevens, Szoecs and Wagner2016) and visually analysed the fungal community composition with non-metric multidimensional scaling (NMDS), using three dimensions. NMDS is a way to represent the position of the different communities in a multidimensional space using a reduced number of dimensions, which represent the variation in the biological community structure. We coloured points in vegan, based on management practice and drew polygons using the ordihull option, which draws convex hulls for the communities of the same category. We used the adonis function in vegan, which runs a permutational multivariate analysis of variance (PERMANOVA) test, to assess the amount of variation explained by farm management practice.
Network visualization and management impact analysis
Binary bee–fungi interaction networks were created using the bipartite package (Dormann et al., Reference Dormann, Fründ, Blüthgen and Gruber2009) in R (The R Core Team, 2019), including the fungal species present within each bee species' brood cells on 15 farms which had sufficient data for analysis. Four farms were removed from analysis due to only one or no bees emerging. Interaction networks were also created for each farm and each farm stewardship level.
We calculated six non-weighted network metrics to assess network structure for each farm: connectance, modularity, nestedness, fungal generality, linkage density and nestedness overlap and decreasing fill (NODF) in bipartite (Dormann et al., Reference Dormann, Fründ, Blüthgen and Gruber2009):
(1) Connectance measures the fraction of realized links within the network of all possible links. To calculate connectance, the sum of realized links was divided by the number of cells in the matrix (Dunne et al., Reference Dunne, Williams and Martinez2002). More connected networks are formed by a higher number of generalist species.
(2) Nestedness is used in this study to measure the extent to which more specialist fungi species within the network interact with pollinator species which also interact with more generalist fungi species. Nestedness was calculated using the BINMATNEST nestedness-calculator (Rodríguez-Gironés and Santamaría, Reference Rodríguez-Gironés and Santamaría2006).
(3) NODF is an alternative metric for calculating nestedness; it is used here to support the initial nestedness calculation metric focusing on different properties of the data set to calculate a measure of nestedness (Almeida-Neto et al., Reference Almeida-Neto, Guimarães, Guimarães, Loyola and Ulrich2008).
(4) Modularity within a network indicates the extent to which interactions form subset modules of species which have higher intragroup interactions than intergroup interactions. Highly modular networks are thought to increase stability by helping to slow the rate of biodiversity loss in networks if the network is destabilized (Wilmers, Reference Wilmers2007; Dupont and Olesen, Reference Dupont and Olesen2009), though the parameters within which modularity promotes stability rather than instability are unclear (Grilli et al., Reference Grilli, Rogers and Allesina2016).
(5) Linkage density is the average number of links per species and indicates the average level of specialization within the network (Landi et al., Reference Landi, Minoarivelo, Brännström, Hui and Dieckmann2018). It is thought that greater linkage density promotes resilience to species loss within the network (Thébault and Fontaine, Reference Thébault and Fontaine2010).
(6) Fungal generality refers to the mean number of bee species utilized by fungal species within the network. We consider generality of the fungi based on the assumption that fungi are likely utilizing the bees as hosts/vectors. Relatively high generality is thought to increase community stability in mutualistic networks, as the fungi are more robust to losses in bee species as they have interactions with more than one species (Bascompte and Jordano, Reference Bascompte and Jordano2007).
Since many network metrics are highly correlated across networks, correlograms were created using the corrplot package in R (Wei and Simko, Reference Wei and Simko2017) to remove redundant metrics used in our analysis. After consideration of groups of variables that were highly correlated (P < 0.05), NODF and modularity network metrics were removed from the analysis. We used a multivariate model to compare the effect of each stewardship level on the remaining network metrics – Hotelling's t-squared test with 10,000 permutations.
Generalized linear models (GLMs) were constructed using R to test for the impact of floral species richness and floral unit abundance. The number of pollen and fungal samples were included to assess the impact of sample size. The models included all four explanatory variables and were simplified following the method in Crawley (Reference Crawley2013) using the Akaike information criterion (AIC) to generate minimum adequate GLMs. To ascertain that the minimum adequate models were the better-fit, the ΔAIC was checked for each model to make sure it was greater than 2.
Results
Bee emergence and fungal diversity
At least one bee emerged from 164 of the bamboo tubes within the collected nest boxes. In total, we identified six different bee species, namely Hylaeus confuses, Megachile ligniseca, Megachile rotundata, Megachile versicolor, Osmia bicornis and Osmia caerulescens (Gresty et al., Reference Gresty, Clare, Devey, Cowan, Csiba, Malakasi, Lewis and Willis2018, Supplementary Information, Table 6). There was a large discrepancy in data recovery between the two farm types, despite equal initial sampling. A total of 33 and 106 samples for low management and high management farms, respectively, were viable for the analysis (both emergence and fungal DNA present).
A total of 462 fungal OTUs were identified, of which 260 were allocated to the ‘Unknown’ ecological guild. Excluding unknowns, there were three main ecological fungal guilds retained (table 1). The most diverse guild found on the farms was saprotrophic fungi, containing 102 different OTUs with a total of 278 recorded interactions. A further 50 OTUs were classified as pathotrophic fungi with 283 interactions, the largest number of interactions with bees despite the smaller overall diversity. The symbiotroph guild was the least well represented and included only 14 OTUs and 36 recorded interactions (fig. 1; table 1). A few OTUs were associated with guilds with multiple ways of gaining nutrients, e.g., pathotroph/saprotroph wherein the taxa can gain nutrients by both mechanisms (table 1).
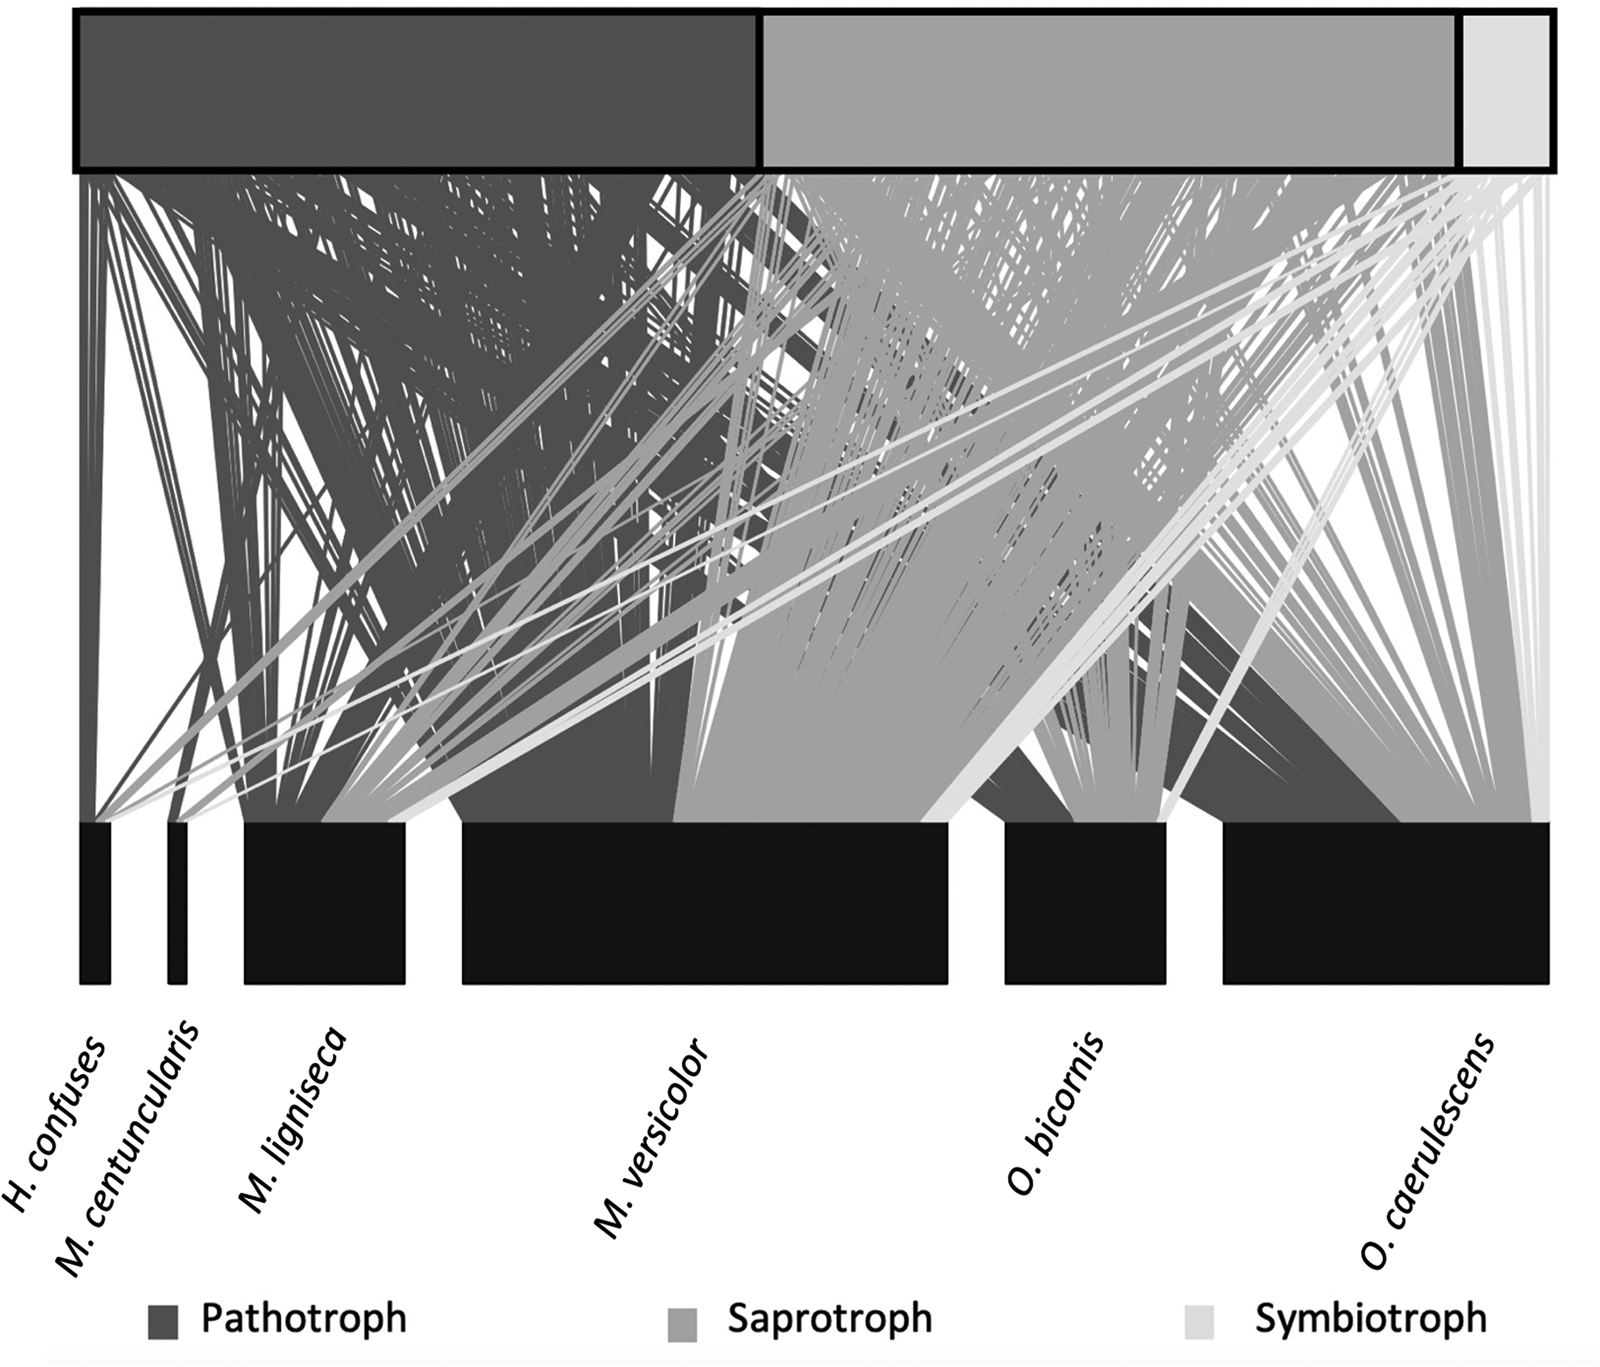
Figure 1. Bee–fungi interaction networks for all 15 farms. The top boxes show proportion of fungi OTUs within each of the main three ecological guilds: pathotrophs, saprotrophs and symbiotrophs. The bottom boxes represent the abundance of each of the six bee species identified. The lines indicate each interaction occurring between a fungi and a bee.
Table 1. Fungal OTU classification and their interactions within bees. Species allocated to the guilds with multiple ways of obtaining nutrients are known to obtain nutrients in multiple ways

We detected a significant difference in fungal community composition between high and low management farms (fig. 2) (PERMANOVA, R 2 = 0.146, P = 0.008). On farms of high management, 388 OTUs were identified, with which 47 were classified as pathotrophic, 85 saprotrophic and 11 symbiotrophic. Comparatively, on low management farms 198 OTUs were identified as 22, 42 and 6 for pathotrophic, saprotrophic and symbiotrophic, respectively. Rarefaction curves show no significant changes in fungal richness on farms with high management compared to low management (fig. 3).
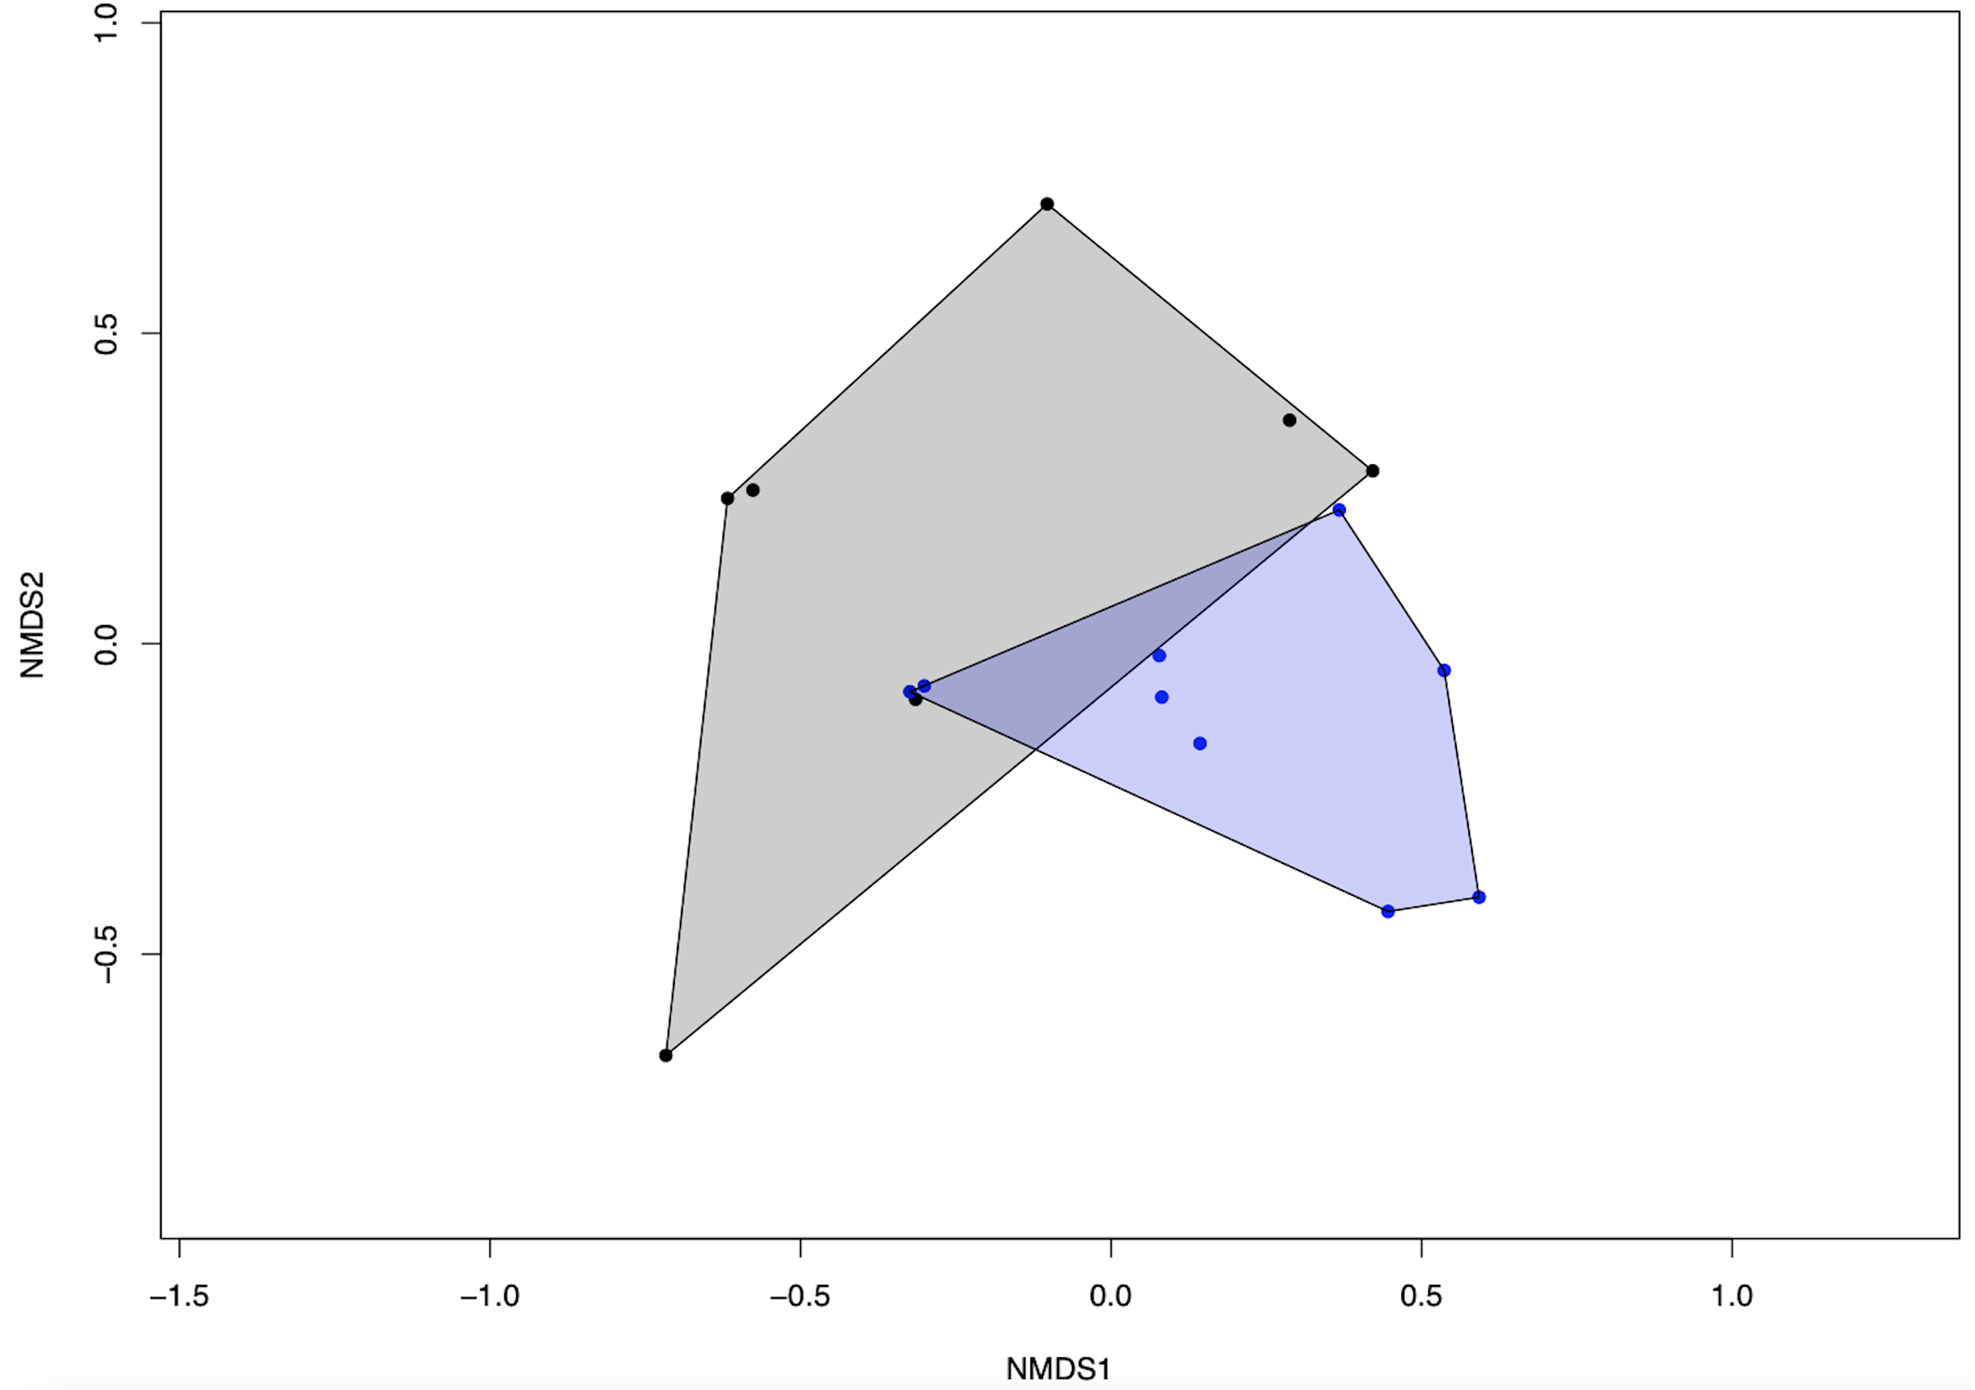
Figure 2. NMDS ordination plot showing the difference in fungal community composition between high and low farm management practices. Blue dots and polygons indicate high management while black dots and polygons indicate low management.
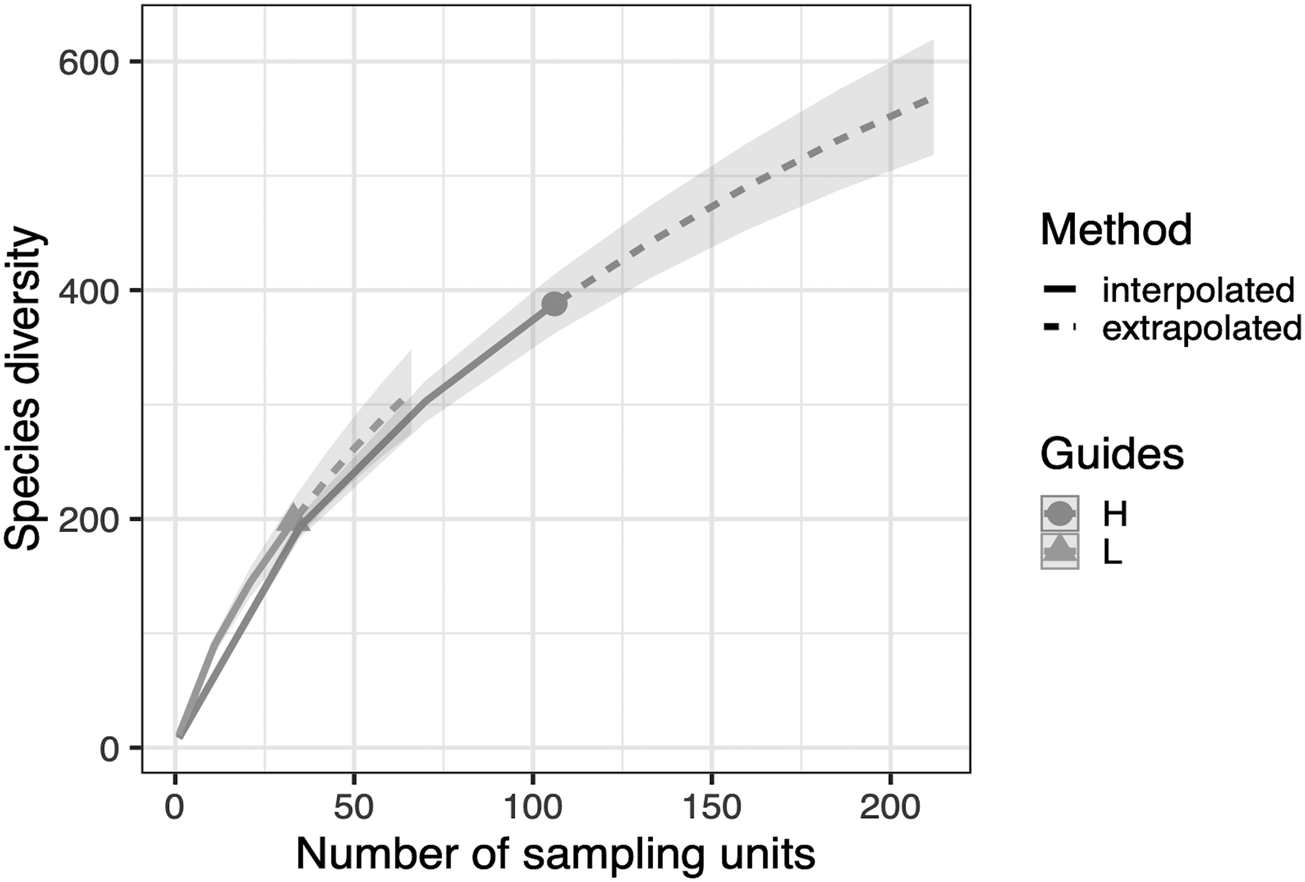
Figure 3. OTU richness rarefaction curve comparing fungal diversity of high agri-environmental management to low management. Curves have been extrapolated to double the sample sizes of each management type; 212 for high management and 66 for low management with 500 bootstrap replications. Fungal richness for both low management and high management follow the same trajectory and neither seem to be plateauing within the extrapolation.
Impact of floral provision on network metrics
Network metrics were analysed to identify correlations between them, as well as explanatory variables. Pollen and fungal samples showed significant correlation as well as floral richness and floral unit abundance (fig. 4a). Significant negative correlation was found between connectance and fungal generality, and between connectance and modularity network metrics. There was also significant positive correlation between fungal generality and NODF, and fungal generality and modularity (fig. 4b).

Figure 4. (a) Correlogram showing correlations between the explanatory variables across farms. (b) Correlogram showing correlations between network metrics across farms. The circles shown are significantly correlated (P < 0.05). The colour describes the degree of negative (red) or positive correlation (blue) between the metrics. Each variable and metric is indicated at the top with corresponding initials down the side.
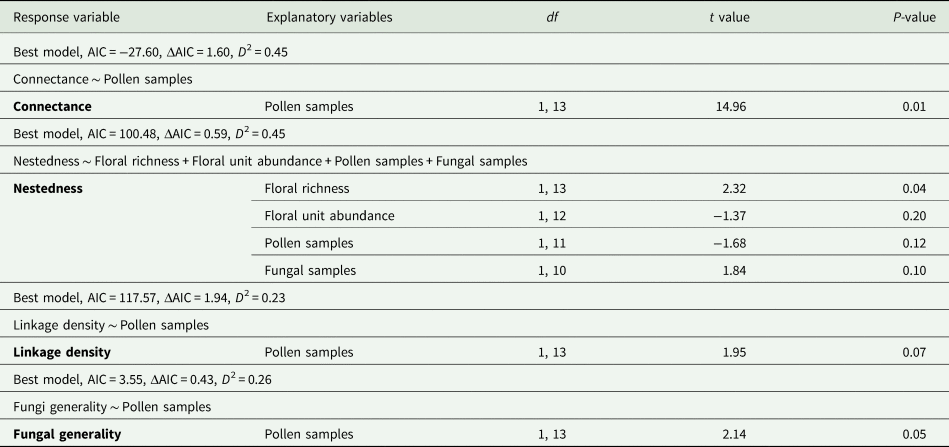
NODF and modularity were removed due to correlation with fungal generality (P < 0.05, fig. 4). Comparison of the effect of high and low management on the four remaining measurements of network structure, connectance, nestedness, linkage density and fungi generality showed no significant difference between management levels (T 6,8 = 1.804, P = 0.21). The number of pollen samples in the analysis had significant and positive effects on the estimates of network connectance (T 1,13 = 14.96, P = 0.01) of bee–fungal interactions. Only the variable, number of pollen samples, was retained in the best minimum adequate GLM for this metric (table 2). The minimum adequate GLM for nestedness was the initial saturated model. Only floral richness showed significant positive impact on nestedness in bee–fungal interactions (T 1,13 = 2.32, P = 0.04) (table 2).
Table 2. Model outcomes for the minimal adequate general linear models of floral provision on network metrics for bee–fungi networks on agricultural farms. The initial models used floral richness, floral unit abundance, pollen samples and fungal samples as explanatory variables. The lowest AIC score was used to indicate the best minimal adequate model for each metric. The ΔAIC is the difference between the best model and the second-best model. The modEVA package in R was used to calculate the D 2 or coefficients of determination (Barbosa et al., Reference Barbosa, Brown, Jimenez-Valverde and Real2020).
Discussion
We used a network approach to characterize the fungal community associated with solitary bee nests and investigated the non-target effect of land management for pollinators on fungal diversity and interactions with solitary bee communities. We observed some difference in fungal community composition between farms of low and high management. We observed a differential emergence of bees under different management schemes.
Fungi diversity associated with solitary bee nest
We observed no significant difference in the fungal diversity associated with solitary bee nests on farms of low management compared to high agri-management. However, there was large disparity in the number of samples retained for analysis for each of the farm types. Brood cell samples collected on farms with high management had more than 3× higher emergence and contained more fungal DNA compared to low management farms. The initial study design included equal sampling effort, which makes this discrepancy interesting. Of the original 19 farms, two low and two high level management farms were excluded because no bee emerged (Gresty et al., Reference Gresty, Clare, Devey, Cowan, Csiba, Malakasi, Lewis and Willis2018). Of the farms retained in the study, six were low and nine were high level management farms with samples excluded if they contained no fungal DNA. Even accounting for more highly managed farms being retained in the analysis and exclusion of samples due to the absence of fungal DNA, bee emergence was less successful in the lower management farms. There was no significant difference in the numbers of pathotrophic or saprotrophic fungal species present in farms of low management compared to high management relative to sample size suggesting that fungal community is not contributing to lower bee emergence. Larval mortality is likely contributing to this lack of bee emergence which has multiple potential causes, notably microbial pathogens including bacteria (Danforth et al., Reference Danforth, Minckley, Neff and Fawcett2019). However, the discrepancy in successful emergence on farms with low management suggests at least some non-target effects on solitary bee communities.
Fungi classification
We identified 456 different OTUs as fungi. Fungi are commonly found in floral nectar (Golonka and Vilgalys, Reference Golonka and Vilgalys2013), and this is likely to be a point of fungal transmission for solitary bees, however, the extent to which flowers serve as entry points for pathogen acquisition is not known (Graystock et al., Reference Graystock, Blane, McFrederick, Goulson and Hughes2016).
Two of the most abundant species were part of the genus Aspergillus and identified as A. appendiculatus and A. penicillioides. Aspergillus species are found on a large range of different substrates. However, the majority is saprophytic and found on dead organic matter (Visagie and Houbraken, Reference Visagie and Houbraken2020). In ground-nesting bees, Aspergillus species are known to be a common cause of larval mortality (Danforth et al., Reference Danforth, Minckley, Neff and Fawcett2019). Little is known about A. appendiculatus. However, A. penicillioides is known to be highly xerophilic and is typically found on substrates like pollen provisions (Krijgsheld et al., Reference Krijgsheld, Bleichrodt, van Veluw, Wang, Müller, Dijksterhuis and Wösten2013). Another extreme xerophile, Bettsia alvei was also one of the most abundant species found (Pettersson and Leong, Reference Pettersson and Leong2011; Pitt et al., Reference Pitt, Lantz, Pettersson and Leong2013).
Ascosphaera variegata was also very frequently identified in the study. There is little information about this particular species; however, the Ascosphaeraceae family is known to contain not only pathotrophic but also saprotrophic fungi that are specific to bees (Wynns et al., Reference Wynns, Jensen and Eilenberg2013). The pathogenic fungi in the Ascosphaera are known to affect the larval stage of bees and many fungi identified as members of this genus were found in the brood cells (Wynns et al., Reference Wynns, Jensen and Eilenberg2013).
Penicillium bialowiezense is a mould commonly found on low water activity substrates including mushrooms, soil and processed food (Frisvad and Samson, Reference Frisvad and Samson2004). Another mould which was plentiful within the samples was Cladosporium exasperatum. Cladosporium contains plant pathotrophic and saprotrophic species. They are commonly found on many types of plants and other fungal species (Bensch et al., Reference Bensch, Braun, Groenewald and Crous2012). It is likely that the fungi present in the brood cells use plant cells as hosts, P. bialowiezense (Frisvad and Samson, Reference Frisvad and Samson2004) and Cladosporium (Bensch et al., Reference Bensch, Braun, Groenewald and Crous2012), are likley either utilizing the bee habitat and pollen provisions as sustenance or using the bees as transport to new hosts. In a study of the mycoflora of domesticated and wild bees, Batra et al. (Reference Batra, Batra and Bohart1973) found that larval mortality is regularly caused by a progression of soil microbes and that fungi tend to be secondary invaders which overtake the cell once the larva is already dead.
Ecological guilds
Out of 456 identified OTUs, 50 were identified as pathotrophs. The largest proportion of these species belongs to Ascosphaeraceae family that are considered bee-specialist fungi (Wynns et al., Reference Wynns, Jensen and Eilenberg2013). All 29 species within the Ascosphaera genus have an obligate interaction with solitary and social bees (Wynns et al., Reference Wynns, Jensen and Eilenberg2013). Of note, approximately half of the species within Ascosphaera are saprotrophic rather than pathotrophic (Nguyen et al., Reference Nguyen, Song, Bates, Branco, Tedersoo, Menke, Schilling and Kennedy2016). All samples were identified to the genus level in Ascosphaera, and classified into the pathotrophic guild, which we consider a questionable functional classification because of known heterogeneity of the ecology of the genus. The saprotrophs within this genus live within the bee chambers and feed on the faeces of the larvae, nesting materials and pollen provisions rather than harming the larva (Danforth et al., Reference Danforth, Minckley, Neff and Fawcett2019). However, there are members of this genus that are pathogens of the bees, and we cannot discount their presence and the harm they cause.
There were 283 interactions with solitary bees recorded for fungal species within the pathotrophic guild. This is the largest number of interactions within the bee–fungi network across the farms despite the larger number of saprotrophic species. This suggests that the recorded pathotrophic fungi are potentially more generalist than the saprotrophs. Further investigations are required to determine whether fungal generality is to the detriment of bee species.
The largest groups of OTUs on the farms were associated with saprotrophic fungi, containing 102 different probable identifications. The main genera identified within this guild all use plant cells as hosts. Saprotrophic species are likely using the bees to spread their spores or feed on the pollen provisions within the bee nest. The Monascus genus was the most abundant within this guild, and are mould species which use plants as hosts (Chen et al., Reference Chen, He, Zhou, Shao, Feng, Li and Chen2015). Some fungi identified, such as those within the Eremascus and Bettsia genera, are extreme xerophiles that thrive in low water activity environments (Pettersson and Leong, Reference Pettersson and Leong2011; Pitt et al., Reference Pitt, Lantz, Pettersson and Leong2013).
A total of 14 fungal species were allocated into the symbiotrophs. The most abundant species found within this guild was Metschnikowia pulcherrima. This fungi is commonly found on fruit that stops other fungi from causing fruit rot (Saravanakumar et al., Reference Saravanakumar, Ciavorella, Spadaro, Garibaldi and Gullino2008). It is most likely that this fungus is using the bees as transport to other hosts. Potentially, some of the symbiotrophs within the brood cell provisions could be performing other roles, such as beneficial yeasts which potentially help to disinfect the nest (Kaltenpoth, Reference Kaltenpoth2009), or are a source of food for the larvae (Danforth et al., Reference Danforth, Minckley, Neff and Fawcett2019; Steffan et al., Reference Steffan, Dharampal, Danforth, Gaines-Day, Takizawa and Chikaraishi2019).
Limitations of fungi analysis
We used ITS sequencing to identify fungi but this is not universally successful and in some studies, secondary loci have been used for fungal identification of taxa that could not be identified using the ITS region (Raja et al., Reference Raja, Miller, Pearce and Oberlies2017). In such studies, secondary markers are often protein-coding genes with greater resolution at higher taxonomic levels thus giving a more accurate phylogenetic analysis (Schoch et al., Reference Schoch, Sung, López-Giráldez, Townsend, Miadlikowska, Hofstetter, Robbertse, Matheny, Kauff, Wang, Gueidan, Andrie, Trippe, Ciufetti, Wynns, Fraker, Hodkinson, Bonito, Groenewald, Arzanlou, Sybren de Hoog, Crous, Hewitt, Pfister, Peterson, Gryzenhout, Wingfield, Aptroot, Suh, Blackwell, Hillis, Griffith, Castlebury, Rossman, Thorsten Lumbsch, Lücking, Büdel, Rauhut, Diederich, Ertz, Geiser, Hosaka, Inderbitzin, Kohlmeyer, Volkmann-Kohlmeyer, Mostert, O'Donnell, Sipman, Rogers, Shoemaker, Sugiyama, Summerbell, Untereiner, Johnston, Stenroos, Zuccaro, Dyer, Crittenden, Cole, Hansen, Trappe, Yahr, Lutzoni and Spatafora2009). Employing secondary markers could be helpful in gaining more insight into the fungi present in the samples and might be a reasonable approach to the ‘unclassified’ taxa we have identified in our analysis. Because of uncertainty in ITS-based classifications, we have endeavoured to refer to OTUs ‘associated’ with a known species rather than simply reporting species identifications, thus retaining the subtlety that this is a hypothesis of identity.
We used FUNGuild to sort OTUs into ecological guilds, but just over half were grouped into the unknown category (Nguyen et al., Reference Nguyen, Song, Bates, Branco, Tedersoo, Menke, Schilling and Kennedy2016). In most cases, this reflects the fact that the fungi could not be identified to species level and retains only broader taxonomic classification by this method. There is variability within higher classifications in the way in which fungi obtain nutrients, and some genera use alternative nutrient acquisition methods (Nguyen et al., Reference Nguyen, Song, Bates, Branco, Tedersoo, Menke, Schilling and Kennedy2016). FUNGuild had 9476 entries in 2016 (Nguyen et al., Reference Nguyen, Song, Bates, Branco, Tedersoo, Menke, Schilling and Kennedy2016). Considering the estimated minimum fungal species richness is 1.5 million (Hawksworth, Reference Hawksworth1991), it is not surprising that a number of OTUs could not be classified.
Impact of management
Management of agricultural farms affects biodiversity and communities. Changing to extensive agriculture, i.e., fertilizers are of organic origin, and limitations on chemicals such as pesticides and herbicides, can significantly increase plant diversity (Ekroos et al., Reference Ekroos, Heliölä and Kuussaari2010; Batáry et al., Reference Batáry, Sutcliffe, Dormann and Tscharntke2013) and plant richness (Batáry et al., Reference Batáry, Dicks, Kleijn and Sutherland2015). Since floral diversity effects fungal diversity (Maltz et al., Reference Maltz, Treseder and McGuire2017), we predicted that an increase in floral diversity in the high management farms might cause a rise in non-targeted fungal diversity. We found that increased management appears to effect fungal community composition with a variation of roughly 15% explained by management type (fig. 2). However, we found that management level had no significant impact on the fungi–solitary bee network structure of the farms. Similarly, Gresty et al. (Reference Gresty, Clare, Devey, Cowan, Csiba, Malakasi, Lewis and Willis2018) found no significant impact on bee–flower networks. The increased floral provisions in the higher management farms may not impact solitary bee–fungal networks. The rise in bee emergence in high management farms suggests there could be some limited non-target effects in the habitat.
Summary
The data gave a good characterization of fungi interacting with solitary bees. The majority of fungal interacting with the bees were pathotrophic and saprotrophic in the farms. While this may indicate interactions that negatively affected the bees, it is not clear if the larvae host the fungi or they obtain nutrients from elsewhere. Of note, a large proportion of fungal species were part of Ascosphaeraceae, a bee-specialist fungal family. There appears to be no difference in fungal diversity across farms of low and high management, although the considerable difference in the number of bee emergence and thus viable fungal samples is notable. There was no significant difference in the numbers of pathotrophic or saprotrophic fungal species present in the farms of low management compared to high management in relation to sample size, suggesting that fungal community is not contributing to lower bee emergence. We observed no significant difference in the network metrics across low and high management farms, suggesting that the floral provision provided by agri-environmental management has minimal non-target effect on solitary bees, fungi or bee–fungi networks. This provides further evidence that the floral provision on agricultural farms within the UK is not directly targeting solitary bees.
Acknowledgements
We thank the farmers and land managers for granting permission for the original collection of material. The assistance of many colleagues involved in the original analysis of bees and plant use which led directly to this analysis of associated fungal diversity was invaluable. This manuscript was greatly improved by considerable feedback from the editor and anonymous reviewers. The research was enabled by funding from the Natural Sciences and Engineering Research Council of Canada through the Discovery Grants Program, support from the Government of Canada's New Frontiers in Research Fund (NFRFT-2020-0073) and by support from Genome Canada and Ontario Genomics to BIOSCAN-Canada through the Large Scale Applied Research Program.


 Open access