1. INTRODUCTION
Brazilian history in the 20th century is marked by the «Northeast-Southern syndrome», which is the persistent difference in living standards between these regions of the country (Baer Reference Baer1964; Merrick and Graham Reference Merrick and Graham1979, p. 133; Barros Reference Barros2012). More than five decades ago, Jeffrey Williamson argued that Brazil had the highest degree of regional inequality in the 1950s among a sample of twenty-four countries (Williamson Reference Williamson1965, p. 14). Regional disparity increased during the early 20th century with industrialisation and the coffee economy in southern states, while those in the Northeast stagnated due to crises in the cotton and sugar economies (Leff Reference Leff1972; Merrick and Graham Reference Merrick and Graham1979, p. 133; Furtado Reference Furtado2006). Evidence suggests that a slight convergence in income per capita began in the 1950s—mainly due to migration from the Northeast to the Southeast—but substantial economic and social inequalities persisted during the following decades (Graham Reference Graham1970, p. 367; Barros et al., Reference Barros, Mendonça and Shope1993; Monasterio Reference Monasterio2010).
Even with the general notion that the southern part of the country had higher incomes during the early 20th century, there is still limited quantitative information about regional differences in living standards in Brazil before 1940. Studies of wages and working conditions for the period mostly use the information for industrial workers in Rio de Janeiro and São Paulo, who were not representative of the labour market at the time (Wells Reference Wells1983b, p. 316). Industrial workers represented only 3.9 per cent of the total workforce and less than 1 per cent of the total population (Fishlow Reference Fishlow, Versiani and Mendonça de Barros1978, p. 23). To contribute to this debate, I use municipal and state information for nominal wages and prices to build a series of real wage indices for skilled and unskilled workers between 1912 and 1940. Real wages are a more appropriate indicator for living standards due to limitations of GDP per capita as a measure of wellbeing in countries with substantial economic inequality (Deaton Reference Deaton2013; Allen Reference Allen2017).
To calculate real wages for different regions, I use Robert Allen's welfare ratio methodology with some modifications (Allen Reference Allen2001). Allen's welfare ratios are the annual budget of a four-person family, which comes from comparing nominal wages with a representative consumption basket. However, due to limited data, studies that use the methodology usually make important assumptions about the average number of working days in a year and how much people spent on housingFootnote 1. For Brazil, there is also no reliable information about how many days people worked in different parts of the country during the early 20th century. I use, therefore, the welfare ratio methodology without making assumptions about family size and the number of working days. The measure for real wages is how many consumption baskets a labourer could afford with a daily wage, which can also suggest how many family members that person could support.
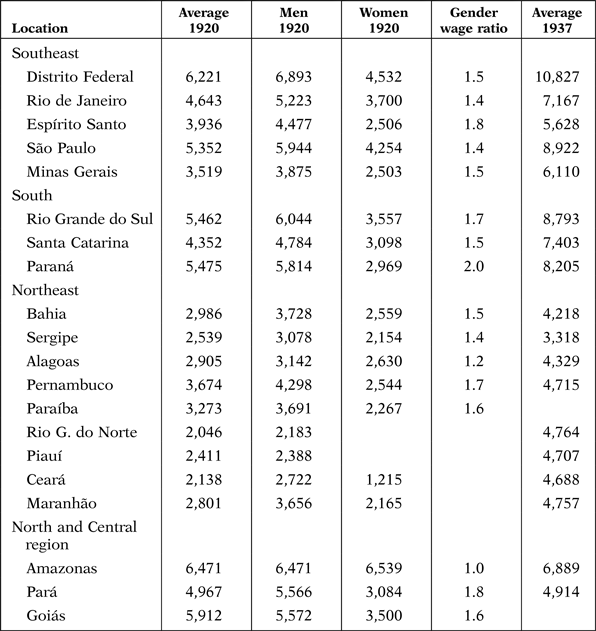
Using data from multiple surveys present different results from those of previous studies on regional income inequality in Brazil. Among them, a study by Jeffrey Williamson argues that real wages in Brazil were approximately three times higher in the Southeast than the Northeast in 1920 and six times higher during the 1930s (Williamson Reference Williamson1999, p. 119). However, new evidence suggests that Williamson overestimated regional disparity. I find wages in the Southeast were on average 1.5 times higher than in the Northeast, which is still a substantial gap but was not as large as the regional differences of other large countries, such as the United States, during this period (Chen Reference Chen1941, p. 544; Margo Reference Margo2002; Boustan Reference Boustan2017, p. 2). The large wage gap Williamson finds is the result of comparing different worker categories—skilled workers (carpenters, bricklayers and porters) in Rio de Janeiro and agricultural workers in Pernambuco—and an improper adjustment of the cost of living between regions (Lobo Reference Lobo1978a; Williamson Reference Williamson1995).
Regarding the costs of living, food prices are crucial for understanding regional differences in Brazil because the average worker spent most of his/her income on food. Moreover, concern over price dispersion in large countries is important when differences in prices are responsible for significant variations in nominal income (Breinlich et al., Reference Breinlich, Ottaviano, Temple, Aghion and Durlauf2014, p. 689). The persistence of significant differences in prices of consumption goods and wages in Brazil before the 1950s can be explained in large part by high transport costs, which prevented the migration of the poorest workers to regions with more opportunities (Redwood Reference Redwood1977, p. 532; Deaton and Dupriez Reference Deaton and Dupriez2011).
Higher food prices and lower nominal wages were not just signs of regional inequality and these factors also had a long-lasting influence on living standards through the effects of insufficient nutrition. In some regions of the Northeast, workers were only able to buy food that represented 40 per cent of the recommended diet. These results are in line with the fact that undernutrition in Brazil, especially in the Northeast, persisted throughout the 20th century, despite projects from international agencies to subsidise basic foodstuffs in poor regions still being prominent during the 1970s and 1980s (Moura Reference Moura1986; Musgrove Reference Musgrove1989). Poorer diets in the Northeast were also an effect of differences in geographic conditions, such as prolonged droughts, which made life much more unstable than in the Southeast (Guerra Reference Guerra1981, p. 26).
The next section discusses the main primary sources and explains the construction of different food baskets to compare real wages in Brazil. To estimate the price of the food baskets I use data for 753 municipalities in twelve different states. The last section presents estimates of welfare ratios for rural, skilled and industrial workers between 1912 and 1940. It also discusses rent prices and how taking these costs into account changes the gap in real wages between states. Moreover, all nine categories of workers analysed demonstrate that the South, not the Southeast, had the highest wages in Brazil at the time.
2. SOURCES
A key limiting factor when using wage data to compare regional living standards is that official statistics on the labour market only began to be systematically collected in Brazil during the 1960s (IBGE 2006, p. 250). Therefore, in order to estimate wages in Brazil for the early 20th century, the present study employs data from questionnaires on agricultural conditions in Brazil between 1910 and 1913, the census from 1920, and two other sources, a government study for the implementation of the new minimum wage law and an industrial census, from the 1930s. These are complementary sources because they have common worker categories that enable comparisons across different periods of time. Moreover, all the information is for daily wages, since, even during the 1930s, a large share of the population did not receive their income in monthly payments. Monthly payments represented a small share of the total payments even in manufacturing jobs (Conjuntura Econômica 1949).
The first source, the questionnaires on agricultural conditions, consists of municipal surveys carried out by the Ministry of Agriculture between 1910 and 1913. To better understand economic and social conditions in Brazil, the agricultural inspectors collected information on the health conditions, wages, food prices, transportation and local interest rates, among other subjects. The government supposedly carried out these surveys in all Brazilian states, although digital sources are only available for twelve states, totalling 753 municipalitiesFootnote 2. Regarding the quality of the data collected, the limitations that the inspectors faced were publicly recognised. Hence, the service director stated that the information presented in the questionnaires had the «imperfection» of all new projects, but he asserted that it was the best evidence that could be gathered (Brasil 1913, VI). The aggregation of the data from the questionnaires, along with the comparison with other sources, shows that there is no clear bias in the information between the different regions of Brazil.
The second source is the wage census of 1920. It was conducted within the general population census and has information on industrial and «rural» (non-industrial) daily wages. Industrial wages are divided between thirteen sectors that comprise 341 categoriesFootnote 3. Since states had different distributions of industrial sectors, the averages presented in the following tables are weighted according to the number of workers in each category. As distinct from rural wages, industrial wages are not recorded for different municipalities and the census only presents data at the state level. This does not present a significant problem because industries in 1920 were concentrated around a few urban areasFootnote 4. For non-industrial wages, the information is recorded for 748 municipalities in twenty different states and divided into ten categories, including unskilled and skilled labour. There seems to be some arbitrariness in this classification of occupation between unskilled or skilled labour, but British reports about working conditions in Brazil during the early 20th century had similar classifications of occupations, such as masons, carpenters and blacksmiths considered skilled labour (BNA FO 368/69 1906, p. 81). Moreover, studies like Williamson's (Reference Williamson1999) use the same classification. Regarding unskilled labour, the census has information on plowmen, cane cutters, ox cart drivers, woodcutters and «workers who used the hoe». The Brazilian states of Ceará, Maranhão, Mato Grosso and Pará were not included in the analysis because the census only includes information for a small number of municipalities (Table A3 in the appendix).
For wages in 1937, the main source is a census conducted by the «Institute of Retirement and Pensions of Industrialists» using practically the same industrial sector divisions as the 1920 census (IBGE 1938, p. 341). A second important source from the 1930s is a study carried out by the federal government to implement the minimum wage in Brazil, which contains information on expenditure patterns for different states and estimates for caloric consumption. The minimum wage report presented estimates for food consumption based on an «average normal ration for the working mass in different activities of the whole territory» (Salário Mínimo 1940, p. 80)Footnote 5. The average food basket presented by the government offered 3,500 kilocalories (kcal), which was high even for developed countries at the time—the average food supply for Britain and France was around 3,000 kcal per capita (Fogel Reference Fogel2004, p. 9; Meredith and Oxley Reference Meredith and Oxley2014, p. 193). For Brazil, surveys for São Paulo by Horace Davis and Samuel Lowrie show that workers had a daily intake of 2,500 kcal (Wells Reference Wells1983b, p. 315). For the rest of the country, however, food consumption was much lower. For the city of Recife, surveys show that the average caloric intake in households was only 1,645 kcal in 1932 (Castro Reference Castro1935). The «recommended» food basket presented in Table 1, therefore, reflected ideal living conditions for workers, which was not the reality they faced. The higher caloric intake from the minimum wage report, nevertheless, is still the recommended amount today for people involved in strenuous activities, which was the case of most industrial and rural jobs in the 1930s (Smith and Subandoro Reference Smith and Subandoro2007, p. 65).
TABLE 1 FOOD BASKETS IN BRAZIL
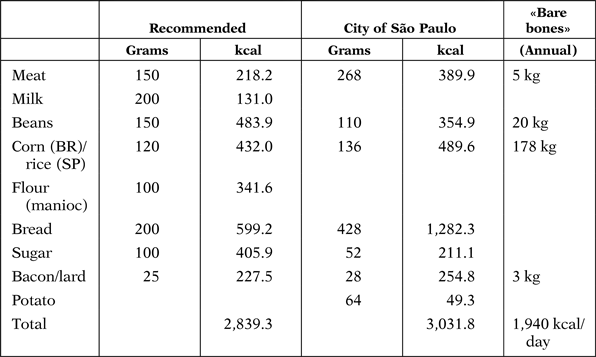
Sources: Salário Mínimo (1940), Cardim (1936, p. 22), Ball (Reference Ball2018).
The differences between the recommended basket presented in Table 1 and the minimum wage report estimates are the absence of bread, butter and vegetables, which is because their prices were not available in many municipalities (especially in the Northeast) in the agricultural surveys of 1912. To substitute the lack of bread prices, which was an important part of the average diet, the price of manioc flour was multiplied by three as a proxy (this price ratio is based on price information from the 1930s). Without butter and vegetables, the food basket supplied 2,839 kcal per capita, almost the same amount as the average food consumption in Britain and France at the time. Moreover, an alternative food basket for the city of São Paulo (Table 1)—which offers a higher quality diet—is used to compare changes in food prices for the city of São Paulo and Recife in Figure 1.
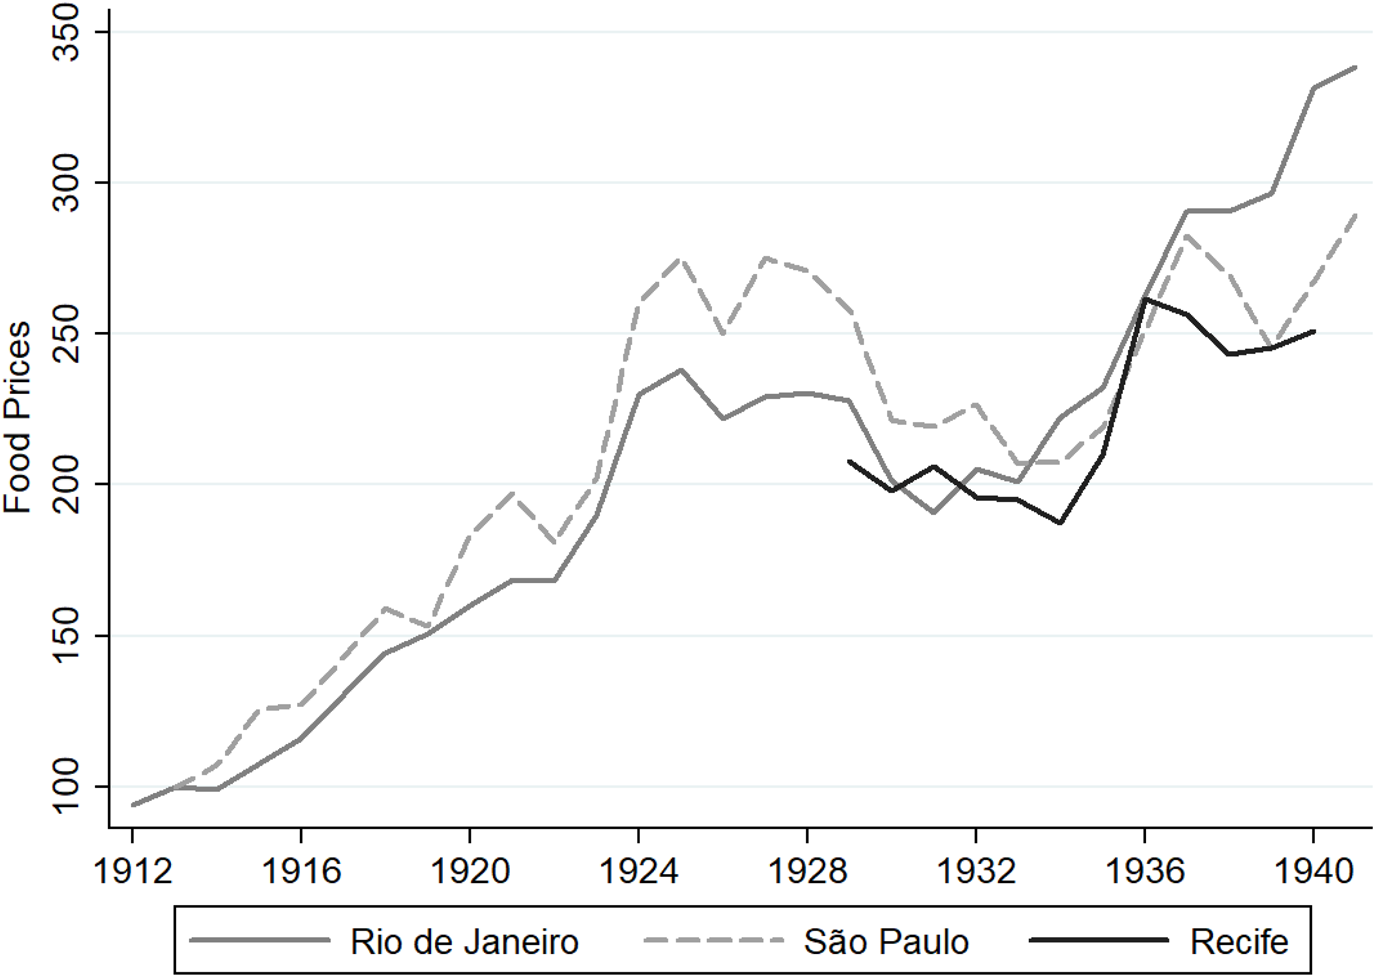
FIGURE 1 FOOD PRICES IN RIO DE JANEIRO, SÃO PAULO AND RECIFE (1912–1941) 1912 = 100.
The third basket in Table 1 is a subsistence basket, a measure used by many comparative studies to estimate relative wages for periods before the 20th century (Allen et al. Reference Allen, Bassino, Ma, Moll-Murata and Van Zanden2011, p. 25). The «bare bones» basket provides 1,940 kcal per day based on the cheapest available carbohydrate, which for Brazil was manioc flour. One of the limitations of this basket, therefore, is that it is highly sensitive to variations in the price of manioc flour. Moreover, Molly Ball uses the «bare bones» basket for São Paulo to estimate real wages, but argues that during the early 20th century, under 10 per cent of households in the city had such low levels of consumption (Ball Reference Ball2018, p. 10). This basket, however, provides an amount of kilocalories similar to Castro's (Reference Castro1935) findings in poor households in Recife. Although not representative of the whole country, the «bare bones» basket will serve as an indicator for benchmarking the welfare ratios presented in the next section.
It is important to account for changes in food prices over time, otherwise estimating regional real wages may be biased. Using the basket of São Paulo presented above, the official food price index for the city of Rio de Janeiro is compared with food prices of São Paulo and Recife in Figure 1. Price trends are similar despite some differences in the mid-1920sFootnote 6. The abrupt halt in price increases after 1924 was a result of changes in monetary policy, which sharply reduced the money supply (Peláez and Suzigan Reference Peláez and Suzigan1981, p. 185). The sudden decrease in prices after 1929 was a direct result of Brazil's banking crisis, which caused rural workers, especially in coffee plantation areas, to accept wage reductions of up to 40 per cent (Delfim Netto Reference Delfim Netto2009, p. 119). Despite similar trends across states, prices in the city of Rio de Janeiro presented a different trend from the rest of the country during the late 1930s. This can create bias in estimating regional real wages with the same price index. Between 1935 and 1938, food prices in the city of Rio de Janeiro increased by 22 per cent but food prices decreased by 5.9 per cent in the Northeast and by 8.2 per cent in the South (Brasil 1946, 1937–1945: pp. 31–51). Therefore, wages from 1937 use prices from state capitals and cannot be directly compared with the regional distribution in prices from 1912 and 1920.
The information on food prices presented above only covers three urban regions. It thus misses information from rural areas and is not enough to account for all the potential variation in prices across the country (Deaton and Dupriez Reference Deaton and Dupriez2011). Therefore, data for the food items in Table 2 use the «recommended» basket to build price indices for several states. All price and wage indices for states are weighted by municipal population, which better reflects the conditions of a random individual within a given region (Williamson Reference Williamson1965; Milanovic Reference Milanovic2005). Since there is no price information for municipalities in the 1920 census, the food basket for that year uses prices from 1912 adjusted for inflation using the Rio de Janeiro price index. Bahia, Pernambuco and Rio Grande do Sul have no available agricultural questionnaires, so I use average prices from nearby states. For 1937, food prices are from state capitals. A basket for 1937 using prices from 1912 adjusted for inflation for comparison is also presented in Table 2. Food costs are therefore not directly comparable between 1920 and 1937 because food prices in the capitals were, on average, higher than in rural areas.
TABLE 2 DAILY COST OF FOOD BASKETS WITH 2,839 KCAL (IN RÉIS)

Sources: see text. Data for 1938–1939 are from the Annuário Estatístico do Brasil (1940).
Notes: Pará (PA), Sergipe (SE), Ceará (CE), Paraíba (PB), Rio Grande do Norte (RN), Pernambuco (PE), Alagoas (AL), Bahia (BA), Rio de Janeiro (RJ), Espírito Santo (ES), São Paulo (SP), Minas Gerais (MG), Paraná (PR), Santa Catarina (SC), Rio Grande do Sul (RS).
As shown in Table 2, it is important to account for price ranges across regions so that regional wage comparisons are not distorted. A previous study by Douglas Graham incorrectly estimated that Minas Gerais had lower average incomes than Pernambuco in 1940 by not taking price ranges into account (Graham Reference Graham1970, p. 372). As Minas Gerais had on average lower food prices than in Pernambuco, real wages were in fact higher in the former. On the other hand, states like Paraná, São Paulo and Rio Grande do Norte had food prices that were 13–19 per cent higher than the national average. These differences decreased during the late 1930s, but it should be noted that significant differences in food prices persist in Brazil to this day (Almeida and Azzoni Reference Almeida and Azzoni2016). Moreover, the evidence suggests that higher wages in the state of Pará during the early 20th century rubber boom were mostly offset by prices that were twice as high as the rest of Brazil (see Figure A1 in the appendix). Records show that rubber tappers working in the Amazon forest were in an even worse situation, as they experienced food costs six times higher than Rio de Janeiro (BRASIL 1915, p. 425; Dean Reference Dean2002, p. 39).
In addition to regional price differentials, regional differences in the share of expenditure on food relative to other essential goods could help explain regional differences in real incomes. Table 3 takes this into consideration using the information on relative shares of household spending for the different states. From the documents used in this paper, the earliest source with this information is the 1930s survey by the Statistical Service of Social Security and Labor, which is presented in the minimum wage report (Salário Mínimo 1940, p. 253). It shows that average spending on food for households in Brazil was 66.5 per cent of total income in the 1930s. Table 3 presents averages for different states, but food spending in large cities was usually relatively lower while spending on housing was higher. In the city of São Paulo, additional household surveys report that food expenditures were approximately 50 per cent of total income during the 1930s (Wells Reference Wells1983b, p. 306). The information in Table 3 is also consistent with other sources. For example, a report by the British consul general on the living conditions in Rio de Janeiro (probably the most expensive city at the time) in 1906 stated that rent ranged between 17 and 20 per cent of skilled labour wages (BNA FO 368/69 1906).
TABLE 3 HOUSEHOLD EXPENDITURE FOR LOW-SKILLED LABOR IN 1937

Source: Salário Mínimo (1940) pp. 125–248.
Notes: Values are the weighted population averages between the capital and other municipalities.
Taking relative spending on food is important because this information can be used as an indicator of economic vulnerability and help inform our understating of regional differences in living standards. By modern standards, households that spend more than 75 per cent of their income on food are considered very vulnerable. In the early 2000s, only some countries in sub-Saharan Africa, such as Rwanda and Burundi, had such a high percentage of their household expenditure with such food insecurity (Smith and Subandoro Reference Smith and Subandoro2007, p. 76). However, many households in Africa in the early 2000s spent between 60 and 75 per cent of their income on food, which is also considered a medium form of food insecurity. Evidence for European countries in the 19th century also suggests that food accounted for between 50 and 75 per cent of household expenditure in labouring families (Fogel Reference Fogel2004, p. 8). Therefore, the high share of food expenditure shown in the present study is to be expected since Brazil had lower income per capita during the 1930s than most African countries today (Bolt et al. Reference Bolt, Inklaar, De Jong and Van Zanden2018). Brazil also had lower agricultural productivity than most countries today, which resulted in higher food prices.
Table 3 also presents the cost of the «recommended» food basket in 1937 using food prices for state capitals. The difference between the actual food expenditure and the cost of the representative basket suggests that there were significant differences in levels of undernutrition across Brazil. What is most notable is that households in the Northeast could afford only 56 per cent of the food basket with 2,839 kcal. This result, however, does not mean that workers had such low levels of food consumption. The recommended basket contains products, such as meat and milk, that extremely poor families would have to substitute with cheaper options. Even with these possibilities, dietary studies for the Northeast present evidence that undernutrition was common among working classes at the time (Vasconcelos Reference Vasconcelos2007, p. 205). In fact, the cost of the «bare bones» basket for the Northeast was 32 per cent of the «recommended» basket (Table A1 in the appendix), suggesting that such low levels of consumption were possible.
Other sources confirm the relation between severe undernutrition and low wages in the Northeast. Information on sugar cane plantations in Pernambuco during the late 1930s shows that rural workers had to work a minimum of 6 days a week to buy the following goods: black beans, flour, beef jerky, sugar, coffee, tobacco, brandy (aguardente) and soap (Carli Reference Carli1940, p. 20). Workers spent 75 per cent of their wages to buy beans, flour, beef jerky and sugar for two adults and four children. The available daily caloric supply from this basket (5,354 kcal) was clearly insufficient to sustain a family of six, and poor workers required other sources of calories, such as crops from family-owned farms. Low income also obliged as many family members as possible to be in the workforce, including children. During the late 1930s, surveys for the city of São Paulo showed that, on average, 42 per cent of family members were in the workforce—which leads us to believe that these numbers were probably even higher in the Northeast (Wells Reference Wells1983a, p. 162).
In Pernambuco, even supervisors, who were the highest paid workers at the sugar cane mills (Usina), did not have a high amount of energy available from their diet. The supervisors received a wage 4.8 times higher than the field workers and spent around 55 per cent of their wage on food. Despite consuming a more complex diet (with fresh meat, cod fish and bread), which supplied 11,036 kcal to two adults and six children, food expenditure was equivalent to less than 1,400 kcal per capita. These results, unfortunately, are expected, since infant mortality in the Northeast during the 1940s was 45 per cent higher than the Brazilian average, with stunting affecting one-fifth of children in the region during the 1990s (Merrick Reference Merrick1974, p. 425; Monteiro Reference Monteiro2009).
Net nutrition, which is the amount of nutrition available after nutrition lost to disease, is another important source of regional inequality in living standards (Deaton Reference Deaton2013, p. 94). During the early 20th century, parts of the Northeast had much higher incidences of diseases and mortality than the Brazilian average (Neiva and Penna Reference Neiva and Penna1916). Additionally, the focus of government investments to improve sanitation in cities of the Southeast increased the differences in living standards between regions by improving the disease environment. Therefore, diseases and a poorer diet resulted in a lower amount of energy available, which affected worker productivity and the possibility of receiving better wages. Censors from the federal government were also dumbfounded by the condition of field workers while collecting information about sugar cane production in Pernambuco during the late 1930s. They questioned how it was possible for them to «work so much and eat so little» (Carli Reference Carli1940, p. 20).
3. REGIONAL WAGES IN BRAZIL
Living conditions for non-industrial workers are essential to understand the regional wage gap in Brazil. In Pernambuco, 21.4 per cent of the total population worked in agriculture and only 3 per cent worked in the industrial sector in 1920 (Pernambuco 1930, p. 131). In other Northeast states, the share of the industrial sector was even lower. Rural wages, however, were not necessarily equivalent to worker income during the early 20th century since there were a number of employment contracts that included non-monetary provisions, such as colonato, meação and parceria (Holloway Reference Holloway1980, p. 87). Even in states in the Southeast, such as Minas Gerais, salaried labour in agricultural and pastoral production increased only during the 1930s (Wirth Reference Wirth1977, p. 37). Employment contracts that aimed at a specific task (empreitada) were also common and created potential instabilities in worker income. For example, wages of rural workers in some municipalities of Rio Grande do Norte increased five times during harvest periods (BRASIL 1913, p. 3).
The issue of non-monetary income is a problem because it is often an unobserved variable. The exclusion of daily wage rates where the earnings include food or other forms of non-monetary payments is a common practice in historical studies of real wages (Allen et al. Reference Allen, Bassino, Ma, Moll-Murata and Van Zanden2011, p. 18; Challú and Gómez-Galvarriato Reference Challú and Gómez-Galvarriato2015). For this study, however, potential biases are less of a concern because both questionnaires from 1912 and the 1920 census have data on the wages with and without food provisions (a seco). Wage data for more than 700 municipalities in 1912 and 1920 also increase confidence in regional comparisons, that is, non-monetary provisions are probably not systematically higher in regions with lower nominal wages and thus will not introduce significant bias to estimates of regional wage gaps across states. To test this hypothesis, I compare wages with and without support (sustento) using 459 municipalities that have both categories in the 1920 censusFootnote 7. All regions (Northeast, Southeast and South) have an average difference of 36 per cent between wages with and without the non-monetary support. This suggests that using nominal wages «a seco» will not compromise the results.
Figure 2 reports the welfare ratios, the number of food baskets a worker could afford with their daily wages, for unskilled rural workers (workers using the hoe) around 1912Footnote 8. It is important to remember that these measures are not directly comparable to the studies that present welfare ratios as the annual consumption of a household (Allen et al. Reference Allen, Bassino, Ma, Moll-Murata and Van Zanden2011). Daily estimates overstate real income because there are no assumptions about the number of days an individual worked during a year and about dependency ratios. When municipalities did not have price information for all foodstuffs (see Table A2 and the online appendix), I used the information on prices from nearby regions. If there were multiple border areas, I used information from regions with the closest distance between municipal headquarters. Since the questionnaires were carried out over a period of almost 3 years, border areas that had their surveys taken on dates close to each other were also selected in order not to create price distortions. Figure 2 shows the north–south divide in Brazil. The northern region of Minas Gerais, which is part of the Brazilian semiarid, has wages similar to the Northeast. Indeed, instability was a feature that marked the geographical division in economic opportunities in Brazil. The effects of climate, especially droughts in the semi-arid regions of the country, had a clear impact in an economy with little to no technology to counteract these conditions. During periods of droughts, food prices in the Northeast increased several times, which decreased real wages by a significant amount. Therefore, the greater dependence of the Northeast on agricultural activities exacerbated regional inequalities. Figure 2 also shows that, as previously argued, wages in the north were not particularly high during the rubber boom; the average wages in Pará were 45 per cent higher than in the Northeast, although they were still below the country averageFootnote 9.
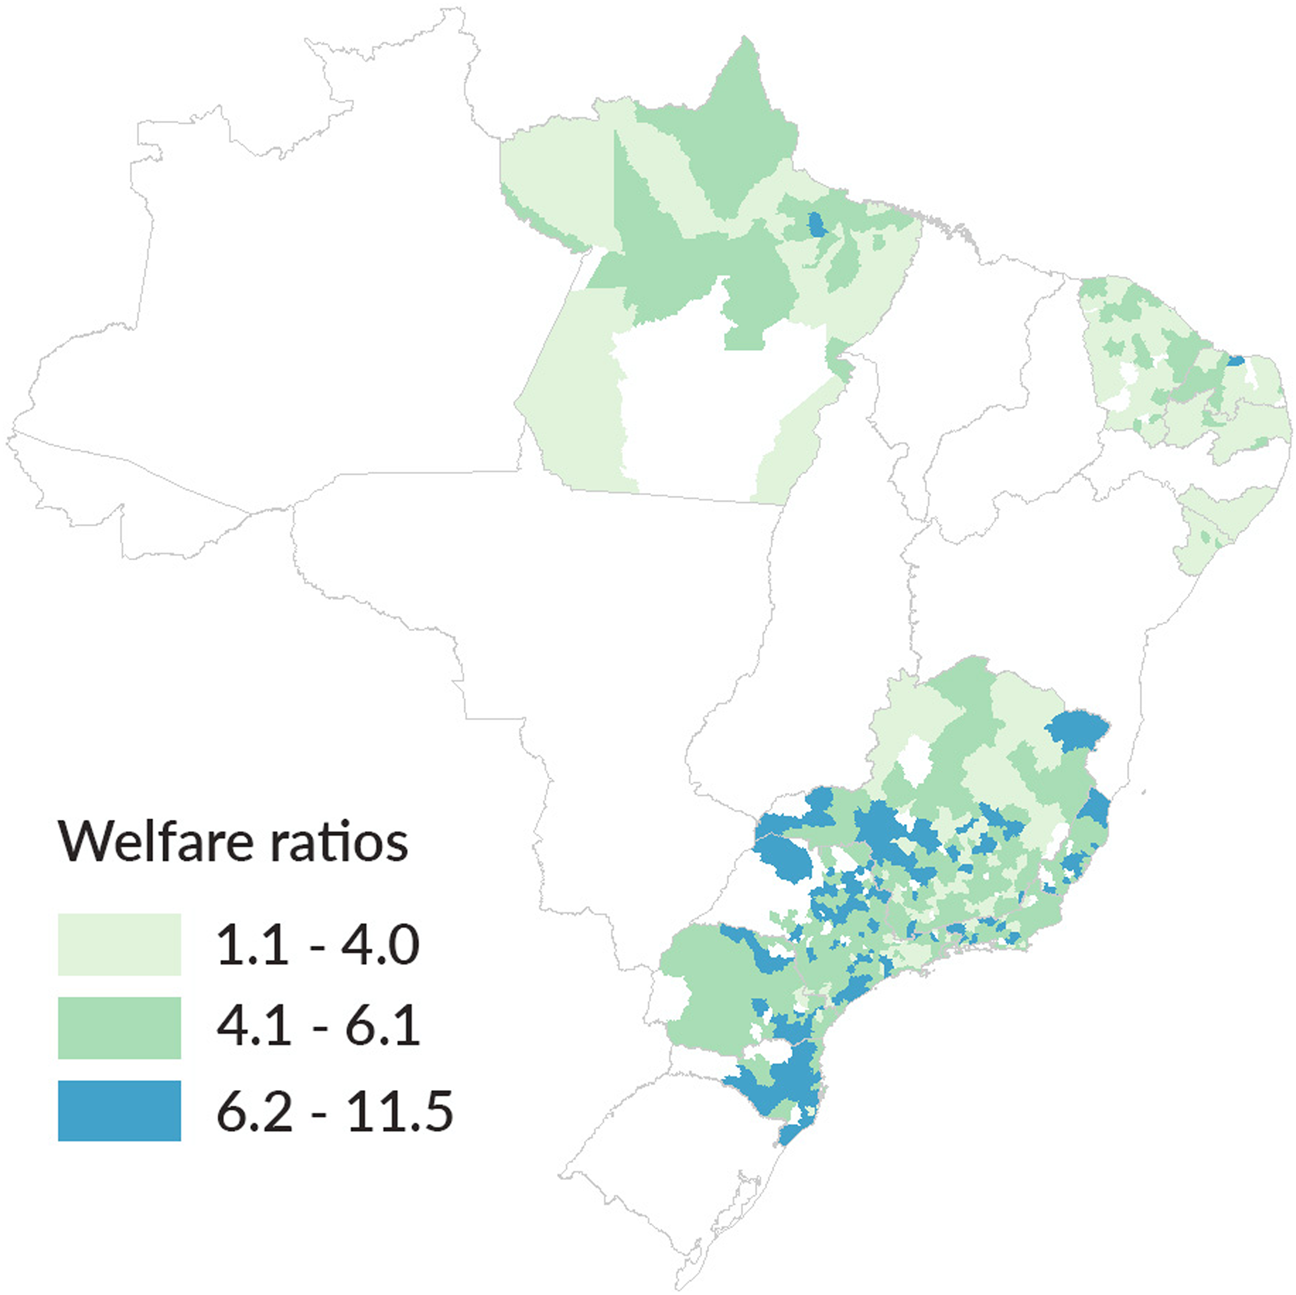
FIGURE 2 NOMINAL WAGES FOR RURAL WORKERS DIVIDED BY FOOD COSTS OF THE «RECOMMENDED» BASKET, C.1912.
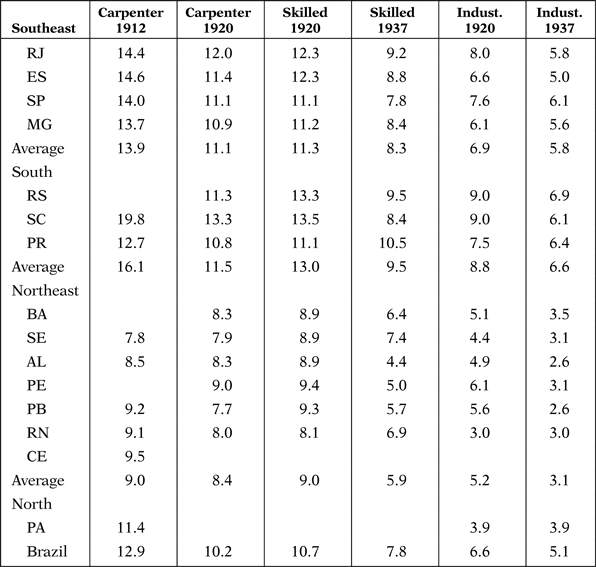
Table 4 presents the state averages of welfare ratios for skilled workers weighted by population. As previously reported, wages from 1937 are adjusted by retail prices from capitals and are not directly comparable with data from 1920 (IBGE 1938, p. 331). Nonetheless, the labour categories are the same; skilled labour is the average wage for carpenters, blacksmiths and masonsFootnote 10. It is also important to note that industrial wages were not necessarily lower than skilled labour because carpenters and blacksmiths did not have a steady source of income and may have had fewer working days during the year. The results show that, for skilled labour, wages were on average 45 per cent higher in the Southeast and 67 per cent higher in the South when compared with the Northeast.
TABLE 4 WELFARE RATIOS USING THE «RECOMMENDED» FOOD BASKET
Sources: see text.
Notes: Skilled = blacksmiths, carpenters and masons.
The evidence presented in Table 4 suggests that there was a decline in real wages between 1920 and the late 1930s. Even if food prices between 1920 and 1937 are not directly comparable, it is safe to assume that inflation during this period had a larger negative impact on less skilled workers. Since this article is not intended to discuss the causes of stagnation in real wages, other sources are necessary to fully examine what happened to the income of workers during the 1920s and 1930s. Indeed, research on labour conditions during this period finds evidence that wages were not growing. Robert Levine (Reference Levine1978, p. 25) reports that real wages declined in Pernambuco during the late 1920s and 1930s and Molly Ball (Reference Ball2013, p. 83) shows that industrial wages in São Paulo were stagnant during the 1920s (Lobo Reference Lobo1978b, p. 2:866)Footnote 11. Moreover, according to government reports, real wages in Pernambuco sugar plantations were also in decline during the 1930s. The reason given was that the government fixed prices in sugar cane plantations in 1933 and did not adjust them for several years (Carli Reference Carli1940, p. 21). Meanwhile, sugar prices (tipo usina) in Recife increased by 19 per cent between 1933 and 1938 (Pernambuco 1940, p. 217). Wage stagnation after the 1920s is also consistent with the findings that income per capita and income inequality were increasing during the period (Contador and Haddad Reference Contador and Haddad1975, p. 412; Souza Reference Souza2016, p. 216). Furthermore, the instability of purchasing power persisted even for industrial wages during the 1940s and 1950s (Wells Reference Wells1983b, p. 298; Colistete Reference Colistete2009, p. 389).
In order to understand the trend in wages before 1940, time series of welfare ratios in São Paulo and Recife are shown in Figure 3. Real wages are adjusted by the São Paulo food basket (Table 1) and by including rents (discussed in Table 6), except for unskilled labour in Pernambuco, which does not have rent information. Like previous studies, the wages in São Paulo were stagnant after the mid-1920s and they did not grow during the 1930s in Pernambuco. By using a similar source for the state of Bahia, real wages for skilled workers fell by 24 per cent and real wages for unskilled workers fell by 16 per cent between 1934 and 1938 (Baía 1936, p. 68, 1942, p. 99).
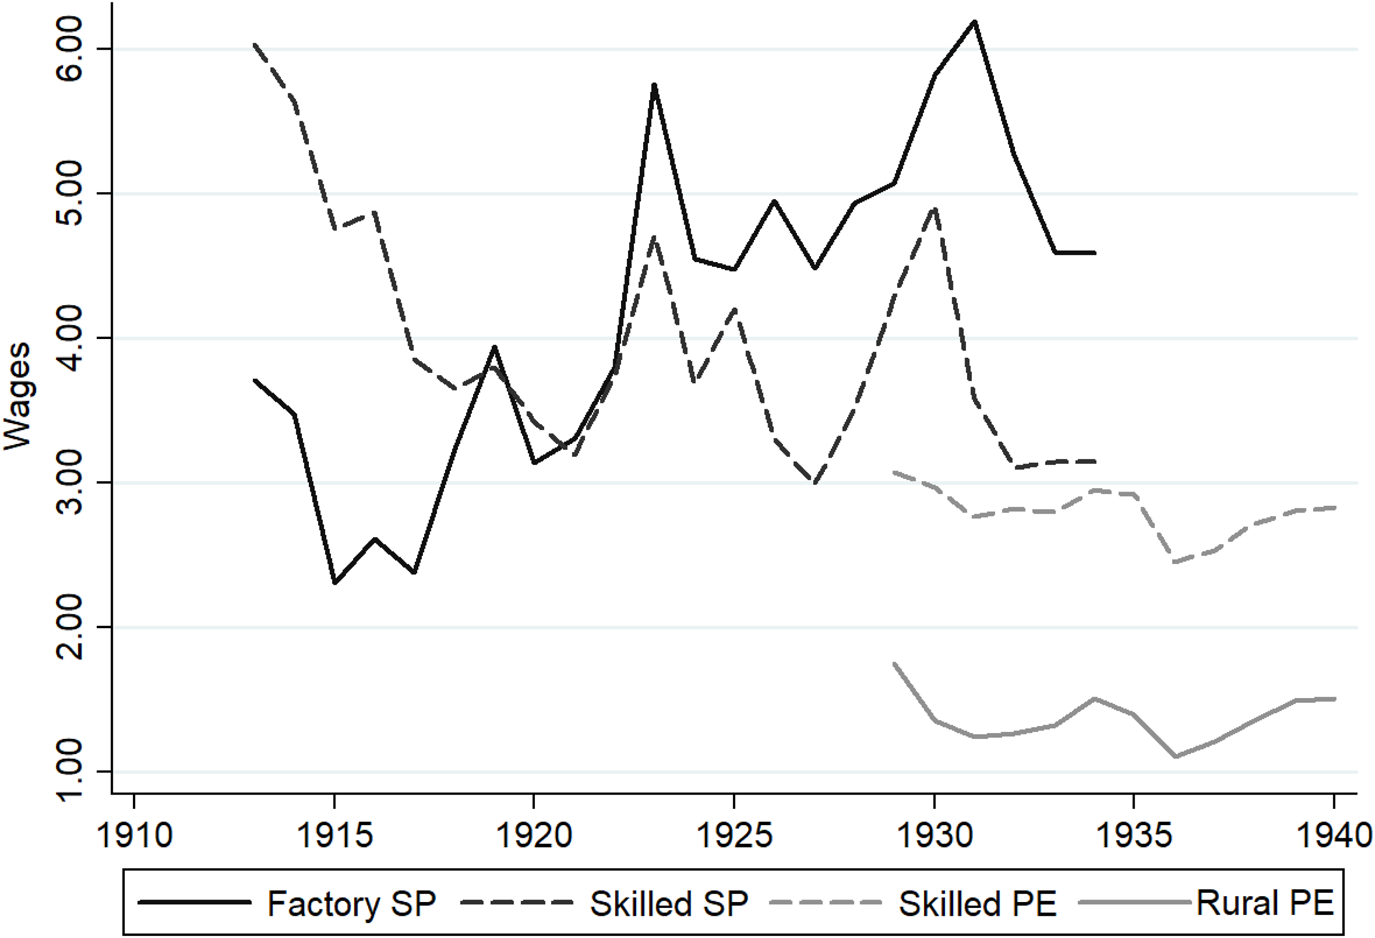
FIGURE 3 WELFARE RATIOS (WAGES) FOR SÃO PAULO AND PERNAMBUCO, 1912–1940.
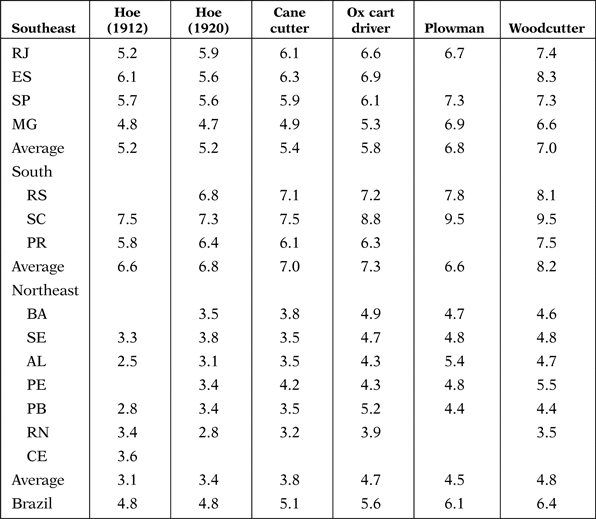
Table 5 presents welfare ratios for rural labour, such as plowmen, cane cutters, ox cart drivers and woodcutters. Workers using the hoe is the only category that appears both in the 1920 census and the agricultural questionnaires of 1912. As this is the category with the lowest recorded wages, Table A1 in the appendix presents welfare ratios using the «bare bones» basket to verify whether the wage level of these workers is plausible. Using the annual «bare bones» basket, the Northeast had an average welfare ratio of 2.2, which suggests that workers still had available income for housing and clothing in 1912. Tables 4 and 5, therefore, reveal that the wage gap between the Northeast and the Southeast is much lower than what was suggested by Williamson. These gaps are also consistent with estimates showing that GDP per capita in the Northeast was half of Brazil's average during the 1920s and 1930s (Barros Reference Barros2011, p. 49).
TABLE 5 WELFARE RATIOS FOR RURAL LABOR IN 1920, USING THE «RECOMMENDED» FOOD BASKET
Source: 1920 Census.
Notes: The welfare ratio for «hoe» (1912) in Pará is 4.5. The census presents workers' classification in Portuguese and French. In the same order as in the table: trabalhador de enxada (bêcheur), cortador de cannas (coupeur de canne à sucre), carreiro (charretes à boeufs), arador (laboureur), derribador de madeira (arrateur de bois).
The welfare estimations, however, still overstate the actual purchasing power of workers and the regional wage disparity because it only considers food expenditure and ignores other expenses, such as housing and clothing. The minimum wage report (Salário Mínimo 1940, pp. 252–253) has information for rent prices in capitals and an average for other cities (interior). It shows that the rent in the Southeast was on average 2.9 times higher than in the Northeast and 1.2 times higher than in the South. I calculate state averages weighting differences in the population using this information.
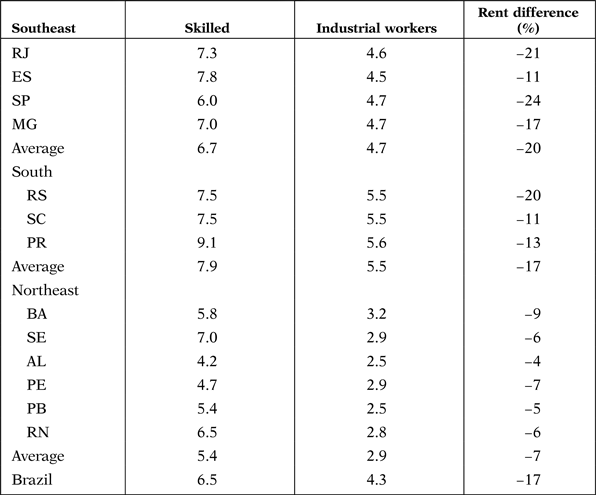
Table 6 presents welfare ratios for skilled and industrial workers in 1937 adjusting for variation in food costs and rent. Accounting for these differences, wages, especially for industrial workers, are much more homogenous for states within the same region. Yet the low relative expenditure on rent, when compared to food expenses, does not significantly change the ranking of states in terms of income. The most notable change is that, while adjusting costs of living, wages for skilled workers in the state of Santa Catarina were higher than in Rio de Janeiro. Information about rents also shows that the assumption, which is used in other studies for earlier periods, that the rent value represented 5 per cent of a worker's income does not apply to Brazil. In the 20th century, only the poorest states in the Northeast had this composition of expenses.
TABLE 6 WELFARE RATIOS FOR SKILLED AND INDUSTRIAL WORKERS IN 1937
Sources: see text.
4. CONCLUSIONS
New evidence suggests that real wages in the Southeast were approximately 50 per cent higher than in the Northeast between 1912 and 1940. This is a much lower regional disparity than that presented by Jeffrey Williamson, and the result holds for multiple categories of workers. The north–south divide in Brazil, however, was still substantial. This is especially evident if one accounts for the higher wages in the states of Rio Grande do Sul, Santa Catarina and Paraná. Moreover, while this article does not discuss the causes of wage stagnation between 1920 and 1940, the evidence suggests that the rapid growth in prices during the period negatively affected the workers' income, especially those with low-skilled jobs.
Despite higher wages in the southern regions, Brazil was still a poor country during the early 20th century. This article finds evidence that only a limited number of workers could afford a proper diet. Wages of unskilled labour, especially those of rural workers, were not enough to support a household, which may have created incentives for other family members, such as children, to enter the labour market.
An issue not addressed in the paper, but which is important for understanding the regional differences in Brazilian living standards, is the availability of work in different states. The fact that many rural workers, especially in poorer regions, lacked a steady income due to irregular work opportunities may have potentially increased disparity across regions due to differences in available working days. Moreover, since work was not a steady activity for the poorest population, other sources of income to complement wages were necessary.
Insecurity in the demand for work in rural areas also raises hypotheses about the effects of industrialisation on the income stability of workers. The impact of industrialisation on regional wage differences is important because seeing the industrial sector as a modern sector in the early 20th century makes more sense than at the present time because productivity in the agriculture and service sector was very low. Industrial workers were the first to receive labour rights and were able to increase their income after World War I more than other labour categories.
Supplementary material
The supplementary material for this article can be found at https://doi.org/10.1017/S0212610919000132
ACKNOWLEDGEMENTS
I am grateful for the comments and suggestions from Svante Prado, Jakob Molinder, Renato Colistete, Leonardo Monasterio, Marcelo Medeiros, Luis Bértola, Kara Dimitruk, participants in the 5th Brazilian Economic History Workshop at INSPER, and participants in the «Contrasting Development Paths in Latin America and Scandinavia: What Can We Learn?» session at the World Economic History Congress in Boston.
APPENDIX
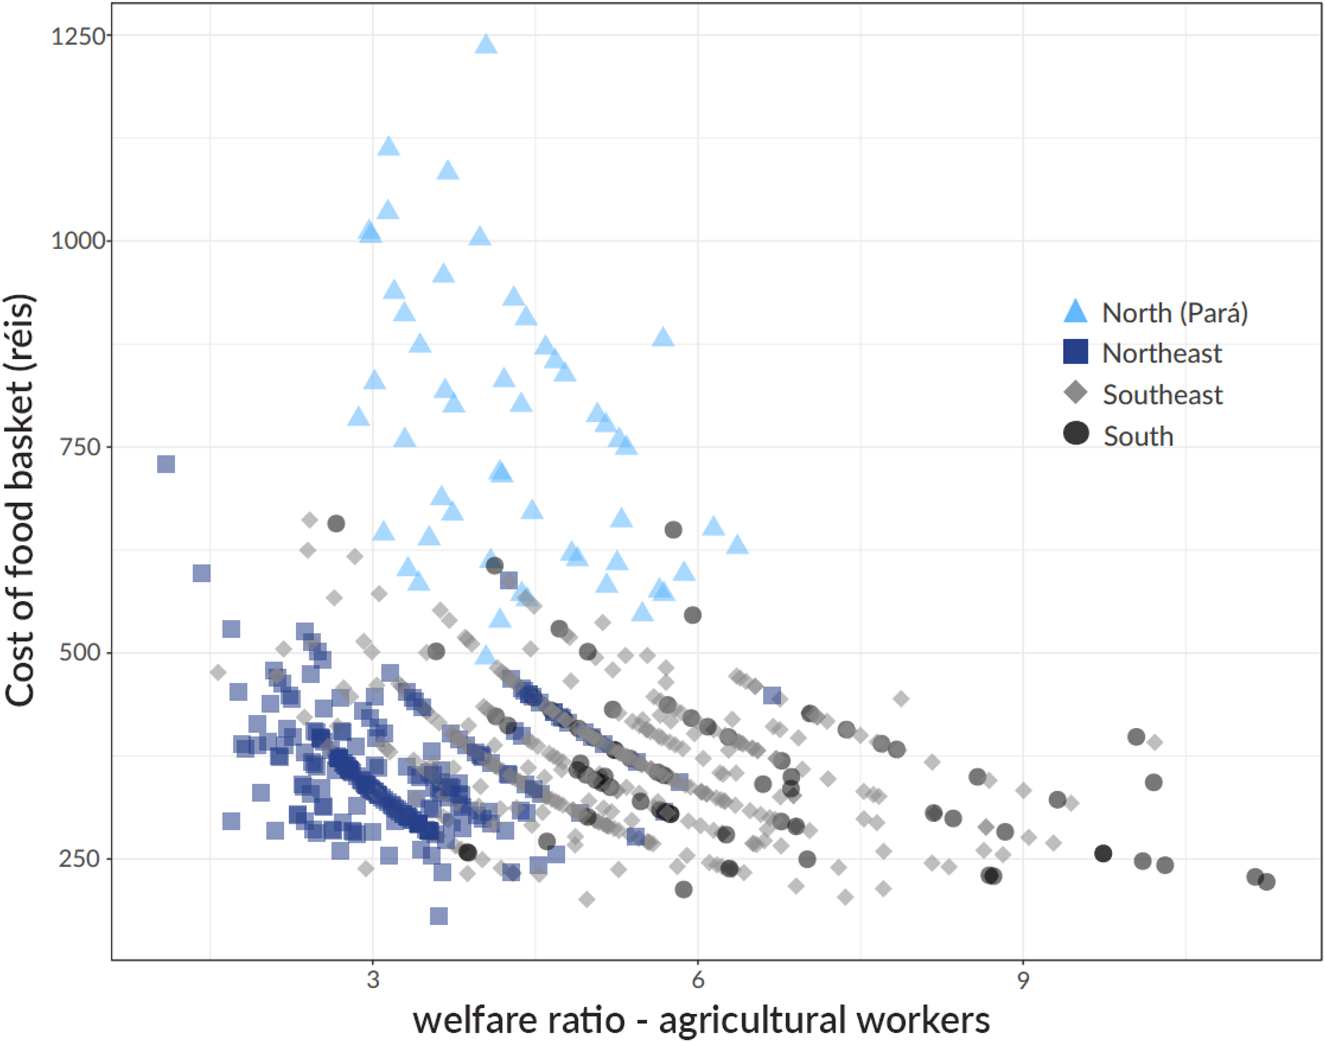
FIGURE A1 Welfare ratios (recommended basket) and cost of food basket (c.1912).
TABLE A1 COMPARISON BETWEEN THE RECOMMENDED AND BAREBONES BASKETS
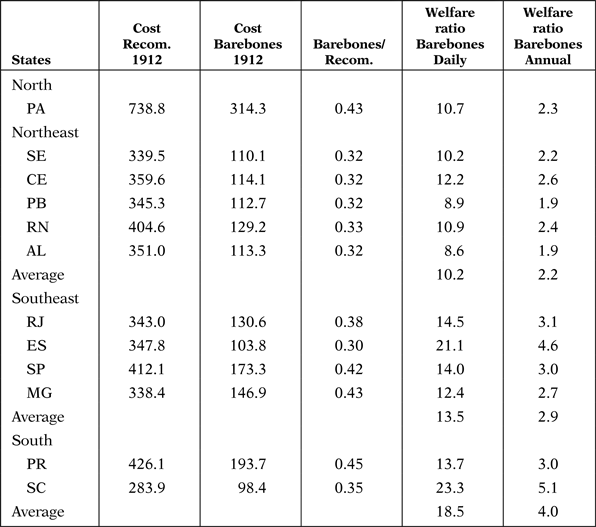
TABLE A2 INFORMATION FROM THE QUESTIONNAIRES ON AGRICULTURAL CONDITIONS (1910–1913)
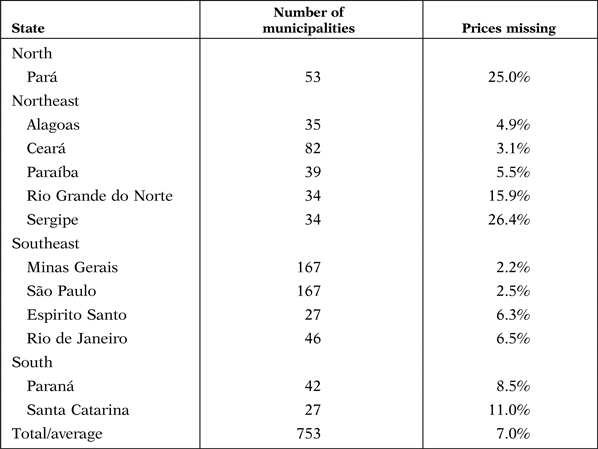
TABLE A3 SAMPLE FOR RURAL (WORKERS USING THE HOE) WAGES IN 1920

TABLE A4 NON-INDUSTRIAL DAILY WAGES IN 1920 AND 1937 (RÉIS)

TABLE A5 INDUSTRIAL DAILY WAGES IN 1920 AND 1937 (RÉIS)