


Introduction
Nutrient enrichment is recognized worldwide as one of the most important causes of change in aquatic ecosystems and one of the leading sources of nutrients comes from sewage discharge, with other significant inputs coming from diffuse, agriculturally derived run-off (Diaz & Rosenberg, Reference Diaz and Rosenberg2008; Smith & Schindler, Reference Smith and Schindler2009; WWAP, 2017). With sewage discharge can come not only nutrients, but a suite of other contaminants, such as heavy metals, changes to salinity and temperature and emerging pollutants such as microplastics (Smith-Evans & Dawes, Reference Smith-Evans and Dawes1996; Foteinis et al., Reference Foteinis, Kallithrakas-Kontos and Synolakis2013; Li et al., Reference Li, Chen, Mei, Dong, Dai, Ding and Zeng2018). Around the world, sewage that is untreated or subject to minimal treatment continues to be released into coastal areas (Baum et al., Reference Baum, Luh and Bartram2013; WWAP, 2017). In Europe, even where there are strict regulations on the discharge of sewage, it is still an issue in many areas due to outdated sewage systems or a lag in infrastructure developments achieving the required capacity to match increasing urban populations (Kiedrzyńska et al., Reference Kiedrzyńska, Kiedrzyński, Urbaniak, Magnuszewski, Skłodowski, Wyrwicka and Zalewski2014). In this sense, coastal habitats are intentionally or unintentionally used to treat waste (Watson et al., Reference Watson, Paterson, Queirós, Rees, Stephens, Widdicombe and Beaumont2016). The biota occupying benthic habitats, including the benthic macroinvertebrates, are known to be able to process waste, providing this waste treatment ecosystem service (Watson et al., Reference Watson, Paterson, Queirós, Rees, Stephens, Widdicombe and Beaumont2016). However, input of waste into coastal areas can cause changes to benthic communities (e.g. Stull et al., Reference Stull, Haydock, Smith and Montagne1986; Bowen & Valiela, Reference Bowen and Valiela2001; Diaz & Rosenberg, Reference Diaz and Rosenberg2008; Abdelrhman & Cicchetti, Reference Abdelrhman and Cicchetti2012; Caswell et al., Reference Caswell, Paine and Frid2018). Eutrophication with deoxygenation due to organic enrichment, can lead to lower benthic species richness; degraded ecosystem functioning, such as bioturbation and nutrient cycling; and decreased capacity to provide ecosystem services, including waste treatment, and climate regulation through reduced carbon sequestration (Worm et al., Reference Worm, Barbier, Beaumont, Duffy, Folke, Halpern, Jackson, Lotze, Micheli, Palumbi, Sala, Selkoe, Stachowicz and Watson2006; Smith & Schindler, Reference Smith and Schindler2009; Caswell et al., Reference Caswell, Paine and Frid2018). Changes to benthic invertebrate communities, such as loss of larger species, can have impacts on the wider ecosystem, since they are a key part of the food chain, in particular on predators with specialized feeding strategies, such as some wading birds (Bowgen et al., Reference Bowgen, Stillman and Herbert2015).
Benthic macroinvertebrates are relatively sessile and long lived; they cannot avoid unfavourable conditions, and thus integrate changes of conditions over time thereby reflecting environmental conditions (Reiss & Kröncke, Reference Reiss and Kröncke2005). Where organic enrichment is most severe, anoxia (no oxygen), hypoxia (low oxygen) and hydrogen sulphite toxicity can lead to severe impacts on benthic communities, from a complete loss of fauna, to changes in organism functioning, reduced biodiversity and altered biomass (see Diaz & Rosenberg, Reference Diaz and Rosenberg1995 for a review). Further away from the pollution source, a range of other impacts can occur. The current understanding of macrofaunal benthic community responses to organic enrichment stems from the Pearson & Rosenberg (Reference Pearson and Rosenberg1978) theory. This describes a succession of macrofauna from a total lack of species at the contamination source (where pollution is severe), moving to high abundances of a few opportunistic species with little or no sediment bioturbation, and succeeding gradually with time and/or distance from the pollution source to greater species richness, larger species, lower abundances and increasingly complex sediment burrowing structures. Thus, in impacted benthic communities we can expect to see structural changes, such as differences in species richness, abundance and biomass. In addition, we can expect to see functional changes, such as changes in bioturbation rates, feeding types (Word, Reference Word1979) and different proportions of species with pollution tolerant or sensitive traits (Borja et al., Reference Borja, Franco and Perez2000). This stereotyped response to organic enrichment (including from sewage, pulp and paper mill waste and organic dredged sediments, amongst others) allows detection of environmental impacts; this has been exploited in studies of human impacts on marine ecosystems and through the use of indices of benthic ecosystem health (e.g. Muxika et al., Reference Muxika, Borja and Bonne2005; Elliott & Quintino, Reference Elliott and Quintino2007; Borja et al., Reference Borja, Barbone, Basset, Borgersen, Brkljacic, Elliott, Garmendia, Marques, Mazik, Muxika, Neto, Norling, Rodríguez, Rosati, Rygg, Teixeira and Trayanova2011; Caswell et al., Reference Caswell, Paine and Frid2018).
However, other work has shown that responses can vary from this paradigm. Species richness may show a range of responses to stress or resource availability including the humpbacked curve described by the intermediate-disturbance hypothesis, which shows an increase in diversity with increasing stress or resource availability before decreasing again as stress continues to increase (Connell, Reference Connell1978; Odum, Reference Odum1985; Dodson et al., Reference Dodson, Arnott and Cottingham2000; Mittelbach et al., Reference Mittelbach, Steiner, Scheiner, Gross, Reynolds, Waide, Willig, Dodson and Gough2001; Hooper et al., Reference Hooper, Chapin, Ewel, Hector, Inchausti, Lavorel, Lawton, Lodge, Loreau, Naeem, Schmid, Setälä, Symstad, Vandermeer and Wardle2005; Huston, Reference Huston2014). This pattern has also been shown for the response to nitrogen loadings in functioning of benthic invertebrate communities, for example in bioturbation rates (Abdelrhman & Cicchetti, Reference Abdelrhman and Cicchetti2012). In some cases, nutrient enrichment can increase species richness and productivity through increased survival and recruitment, by making more resources available and mitigating the effects of other stressors such as heavy metal contaminants (Lawes et al., Reference Lawes, Clark and Johnston2016). Other work has shown other factors influence the response of benthic communities. For example, at sites with high current speeds, high diversity and abundance can be maintained in the presence of an organic pollution source, when conditions allow for both maintained aerobic sediment conditions with an increase in food supply (Keeley et al., Reference Keeley, Forrest and Macleod2013). Current speed can influence impacts on benthic environments, either through dispersing material so it cannot accumulate; through determining the coarseness of the seabed, affecting the accumulation of finer organic material; or through determining the original benthic community which can exist there, and how sensitive it is to organic enrichment (Snelgrove, Reference Snelgrove1999; Rees et al., Reference Rees, Pendle, Limpenny, Mason, Boyd, Birchenough and Vivian2006; Macleod et al., Reference Macleod, Moltschaniwskyj, Crawford and Forbes2007; Mayor & Solan, Reference Mayor and Solan2011).
In the assessment of the quality of marine benthic invertebrate communities, indices are widely used to summarize complex information into a form which is easy to interpret by a range of users. Marine benthic invertebrate community based indices include the Infaunal Trophic Index (ITI), which is based on feeding guilds (Word, Reference Word1979), and relates to evidence showing that nutrient-enriched communities will functionally change by favouring surface deposit feeding over suspension feeding (Aberson et al., Reference Aberson, Bolam and Hughes2016). Other indices commonly used, amongst others, are the Azti Marine Biotic Index (AMBI) (Borja et al., Reference Borja, Franco and Perez2000) and the Benthic Opportunistic Polychaete to Amphipod Ratio (BOPA) (Dauvin & Ruellet, Reference Dauvin and Ruellet2007), which are based on their sensitivity or tolerance to disturbance (see Table 1 for a selection of some of the indices used). These indices summarize multivariate data into an easily understood score of environmental quality (Diaz et al., Reference Diaz, Solan and Valente2004). In an environmental context, indices are integral to most approaches to quality assessment that aim to safeguard ecological integrity (Borja et al., Reference Borja, Bricker, Dauer, Demetriades, Ferreira, Forbes, Hutchings, Jia, Kenchington, Marques and Zhu2008; Borja et al., Reference Borja, Ranasinghe and Weisberg2009a). In Europe, the Water Framework Directive (WFD) requires the achievement of at least good ecological status (GES) in transitional and coastal waters (EC, 2000). Indices are routinely used to assess environmental quality within the framework of this Directive (van Loon et al., Reference van Loon, Boon, Gittenberger, Walvoort, Lavaleye, Duineveld and Verschoor2015), therefore it is essential that these indices are effective and sensitive. There are important environmental, legislative and financial implications for policy implementation when the indices used in routine monitoring over-estimate the quality of poor areas or under-estimate quality of good areas (Quintino et al., Reference Quintino, Elliott and Rodrigues2006). Discrepancies and inconsistencies between indices lead to a lack of confidence in quality assessments (Quintino et al., Reference Quintino, Elliott and Rodrigues2006). Thus, it is recommended to use more than one index, though this can then increase the complexity of routine monitoring (Kröncke & Reiss, Reference Kröncke and Reiss2010).
Table 1. A selection of indices used in the assessment of marine environmental health assessment and calculated in this study with their expected responses to organic enrichment

a For taxonomic distinctness, classification tree is constructed using phylogenetic distance.
b For IQI, 1-λ’ is the Simpson's Index of evenness. The max values are the expected maximum or reference values for a given habitat, in this study: fine sands or muds where 1-AMBI/7 max = 0.96; 1-λ’ max = 0.97; S max = 68.
A development in the use of these indices has been driven by the WFD where GES of benthic invertebrate communities is defined by the diversity, the abundance and the invertebrate taxa sensitive to disturbance (EC, 2000). This has led to the development and use of multi-metric indices, which can incorporate these different aspects of benthic ecological status explicitly. Multi-metric indices allow different aspects of biodiversity and community organization to be integrated into a single value and should magnify a common signal in the combined metrics (Schoolmaster et al., Reference Schoolmaster, Grace and Schweiger2012). This approach was adopted in different European countries to fulfil reporting for the WFD. For example, in the UK, routine monitoring makes use of the Infaunal Quality Index (IQI) (WFD-UKTAG, 2008; Phillips et al., Reference Phillips, Anwar, Brooks, Martina, Miles and Prior2014), which includes Simpsons Index of evenness, AMBI and species richness, while monitoring in the Netherlands uses the Benthic Ecosystem Quality Index 2 (van Loon et al., Reference van Loon, Boon, Gittenberger, Walvoort, Lavaleye, Duineveld and Verschoor2015). The underlying theory of different indices dictates a range of expected responses of indices to the effect of organic enrichment (see Table 1 for a description of these responses in a selection of indices). The aim of this study was to describe the response of a benthic community to known input of organic enrichment from a sewage outfall pipe over the course of several years, and to explore how a suite of indices measured this response. It was expected that, overall, species richness would decrease and that indices would detect a decrease in quality over time, as waste and contaminants accumulated, and that there would be spatial differences with distance from the source of organic enrichment.
Methods
Study site
Ironotter Point is located at Greenock in the west of Scotland (55°5833′N, 4°4840′W) (Figure 1A, B) (SEPA, 1996; O'Reilly et al., Reference O'Reilly, Boyle and Miller1997). Data used were collected by the Scottish Environment Protection Agency (SEPA), to assess the impact of a sewage outfall pipe. A 14 km sewer to be discharged through a sea outfall 1.2 km offshore at a depth of 25 m, was commissioned for the point in 1991. This discharged waste from a primary sewage treatment plant. A baseline subtidal benthic survey was carried out in 1989, one year after the pipe was laid, but before it became operational, and surveys after the pipe became operational were carried out in 1992, 1995 and 1998 (SEPA, 1996; O'Reilly et al., Reference O'Reilly, Boyle and Miller1997). Initially the pipe received waste from a population of around 20,000 people and this was phased up to around 88,000.
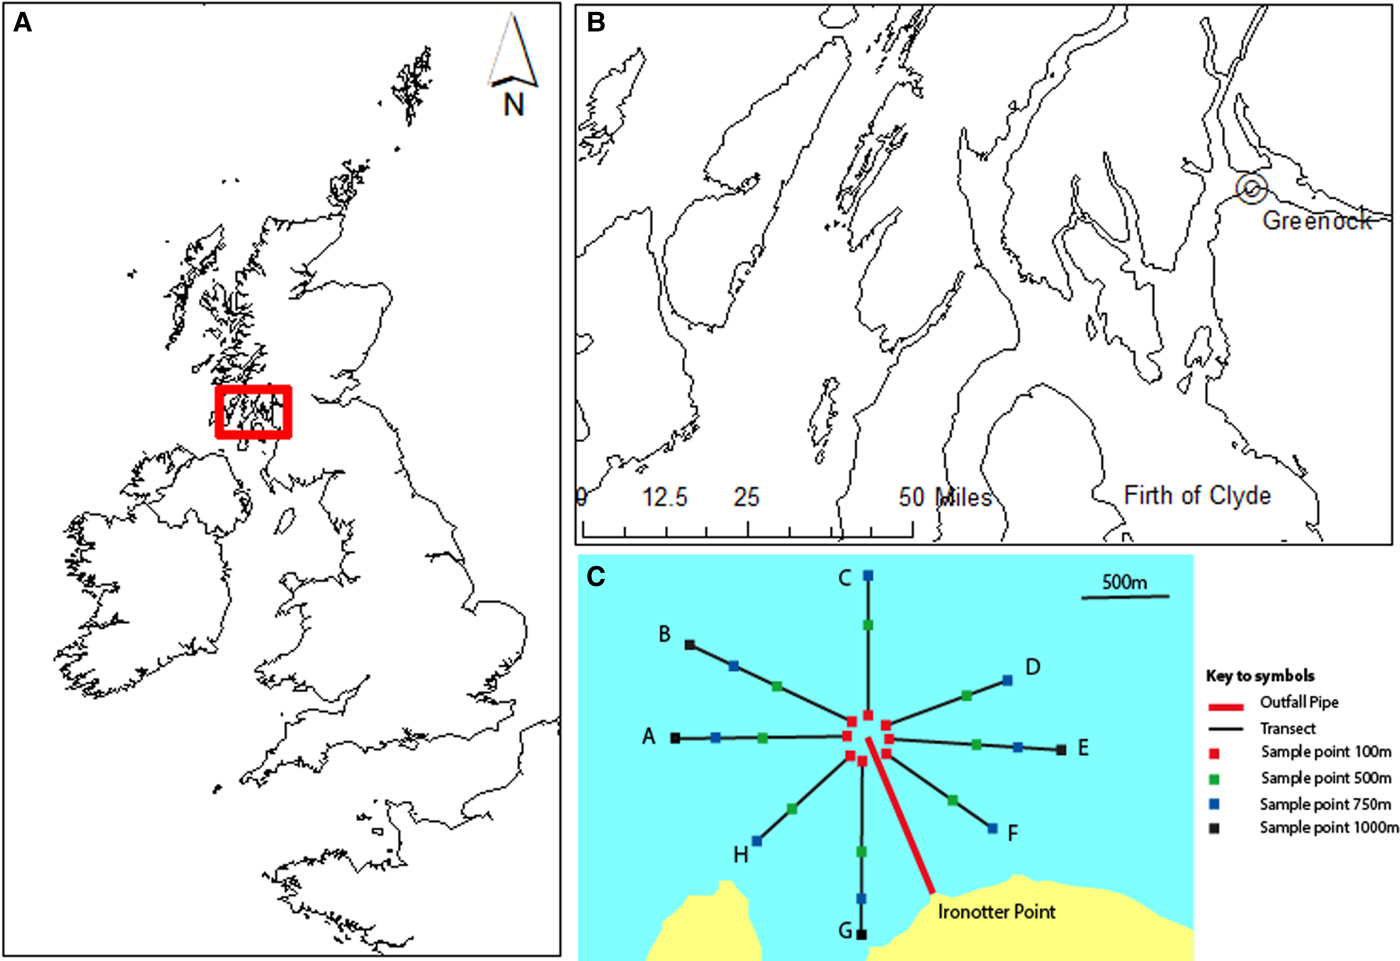
Fig. 1. Study area in Scotland, UK (A) and the location of the sea sewage outfall at Ironotter Point in the Firth of Clyde, off Greenock (B). Sampling stations were located along transects, radiating out from a distance of 100–1000 m from the outfall point (C). (A) and (B) were produced using ArcGIS version 10.6 (http://www.arcgis.com/features) and (C) was adapted from SEPA summary report (SEPA, 1996) and O'Reilly et al. (Reference O'Reilly, Boyle and Miller1997); see Table S1 for full details.
Samples (0.1 m2 Day Grab) of benthic macroinvertebrates were collected along a series of transects (Figure 1C). Eight transects, which radiated out from the discharge point were used to sample, with two or three replicate samples taken at each sampling station. Stations were located 100, 500, 750 and 1000 m from the discharge and were of similar depths (Figure 1C; Table S1, supporting information). Samples were sieved (500 µm) and identified to species level, where possible. The team of taxonomists did not change over the course of the surveys and had a common leader throughout, therefore bias in species identification by different taxonomists is not assumed to be a factor in this study. Due to the duration covered by the dataset, species names were checked and harmonized for synonyms. Organic carbon content (loss on ignition; Byers et al., Reference Byers, Mills and Stewart1978) was determined from one sample of the top 5 cm of sediment taken at each location. Data available were from 1989, 1992, 1995 and 1998 for macroinvertebrates and 1989, 1992 and 1995 for organic carbon. There was a change in sampling regime in 1998, due to a change in priorities and distribution of funding at this time, resulting in a minimal survey being carried out. For this year, only two transects were sampled, and organic carbon content was not measured (see Table S1).
Numerical analysis
Variation in organic carbon was analysed in relation to year, transect and distance to characterize patterns of variation before assessing the relationships between this and the values of the indices calculated. This was analysed with a factorial general linear model containing Transect, Distance from outfall and Year as fixed effects, carried out using R statistical software (R Development Core Team, 2016). An alternative model was also fitted with the inclusion of a spatial error term to account for potential spatial autocorrelation effects. There was no significant difference in the fit of the two models so the original model was kept (see Supplementary Material). Statistical significance was taken at P < 0.05 for this and all subsequent analyses.
In order to assess biological changes in the community related to the operation of the sewage outfall pipe, the benthic community was described in a number of ways. We first analysed untransformed data of species abundance composition using SIMPER (similarity percentages), multidimensional scaling (MDS) and ANOSIM (analysis of similarity), based on Bray–Curtis similarity, carried out using Primer 6. Community similarity was tested with respect to year of sampling and intensity of pollution, defined as discrete categories of percentage organic carbon content, increasing at regular intervals, across the range of values in the dataset. These categories were 0–2.5%, >2.5–5%, >5–7.5%, >7.5–10%, >10–12.5%, >12.5–15% organic carbon.
The total number of species found in each year and the proportion of species unique to each year are shown, though this is purely descriptive since there were differences in the number of samples and replicates taken in different years (see Table S1). The five species most responsible for generating observed patterns in each year were identified using SIMPER analysis (as above). Their ecological group (from AMBI Groups I–IV, Table 1); functional feeding group (from ITI feeding groups, Table 1); and their bioturbation mode (diffusive mixing, surface deposition, upward conveyer or downward conveyer) (classification and information from Bolam et al., Reference Bolam, Garcia, Eggleton, Kenny, Buhl-Mortensen, Gonzalez-Mirelis, Van Kooten, Dinesen, Hansen, Hiddink, Sciberras, Smith, Papadopoulou, Gumus, Van Hoey, Eigaard, Bastardie and Rijnsdorp2017; MarLIN, 2006; Solan et al., Reference Solan, Cardinale, Downing, Engelhardt, Ruesink and Srivastava2004), were identified.
A set of 10 indices was calculated for each individual sample (Table 1). Each replicate sample was treated separately in all subsequent analyses (i.e. not pooled), to account for differences in the number of replicates taken in some cases (if replicates were pooled before calculating indices, results could be influenced by species richness, which could differ according to differences in sampling effort; Magurran, Reference Magurran2004). In this way, each index was calculated on a comparable sample. Indices calculated were species richness (S), total abundance (N), measures of evenness (Pielou's evenness index and Abundance/Species richness) and taxonomic distinctness, all calculated using Primer 6 software. Five further indices calculated have associated, pre-defined quality classifications. These were AMBI, IQI, ITI, BOPA and BQI (index quality categories used are presented in Table S2, shown in supporting information). AMBI was calculated using AMBI software (http://ambi.azti.es/).
Spearman rank correlation was carried out in order to relate index results to the year of sampling, distance from the outfall and percentage organic carbon content, so as to explore any relationships between these and index values. In order to remove the effect of the confounding variable (year or organic carbon content), partial correlations were used. Only the magnitude of the Spearman rho coefficients is given and no associated P-values in order to avoid Type I errors due to multiple comparisons. The mean of each index for each year overall was also determined to explore changes in indices over time.
For the five indices (IQI, BQI, AMBI, BOPA and ITI) that have associated quality classifications, we investigated consistency between classifications to assess whether they performed differently in their ability to detect changes. Five quality categories derived from the WFD were used for IQI, BQI, AMBI and BOPA (see Table S2). In order of decreasing quality, these are ‘high’, ‘good’, ‘moderate’, ‘poor’ and ‘bad’. ITI has four quality categories, these are ‘reference’, ‘normal’, ‘changed’ and ‘degraded’. For this study, these were assumed to correspond to the five WFD categories as follows: ‘reference’ = ‘high’; ‘normal’ = ‘good’; ‘changed’ = ‘moderate’ and ‘poor’; and ‘degraded’ = ‘bad’. A quality classification was determined for each individual replicate and for the mean of each station in each year. The quality classifications of the individual replicates were determined to be (1) in agreement (where all indices agree e.g. all indices assign a ‘high’ or ‘reference’ classification to a sample), (2) be ‘similar’ (where two quality classifications are given but adjacent on the scale of quality e.g. where all indices assign either a ‘good’ or a ‘moderate’ classification), or (3) ‘disagree’ (where three or more quality classifications are given, or two classifications are two levels apart on the scale of quality e.g. where one index assigns a ‘poor’ classification and another assigns a ‘good’ classification). Multidimensional scaling (MDS) based on Bray–Curtis similarity was conducted on the samples in the same way as previously described. However, in this case, data were tested using ANOSIM in respect to these three levels of agreement, i.e. whether sample classifications across all years agreed, were similar or disagreed. This was related to the previous MDS plots to highlight whether the level of agreement corresponded to community compositions which were associated with a particular year or level of organic carbon content.
Results
Organic carbon increased over time from an overall average of 1.2% in 1989 and 1.8% in 1992 to 8% in 1995, where the minimum found at any point in 1995 (min 3.78% in 1995) was greater than the maximum found at any point in 1989 or 1992 (max 3.73% in 1992) (Figure 2). Enrichment increased significantly with distance over time (Table 2) and this was particularly evident in 1995, with the greatest levels of organic enrichment being furthest from the pollution source (Figure 3). This suggests the effluent was well dispersed over the study area. If data had been available for 1998, the effect of distance may have been even greater but this finding of increased organic content with distance from the outfall suggests that greatest enrichment may not be at the sites closest to the outfall, as would be expected. Subsequent analyses thus focused mainly on the effects of year of sampling and organic carbon content, and not on distance (see also supporting information, Figure S1). The silt/clay fraction at the sites increased from an average of 1.64% in 1989 (range 0.37–3.96), to 2.38% in 1992 (range 0.74–4.89). Sediment grain size properties were not available for subsequent years.
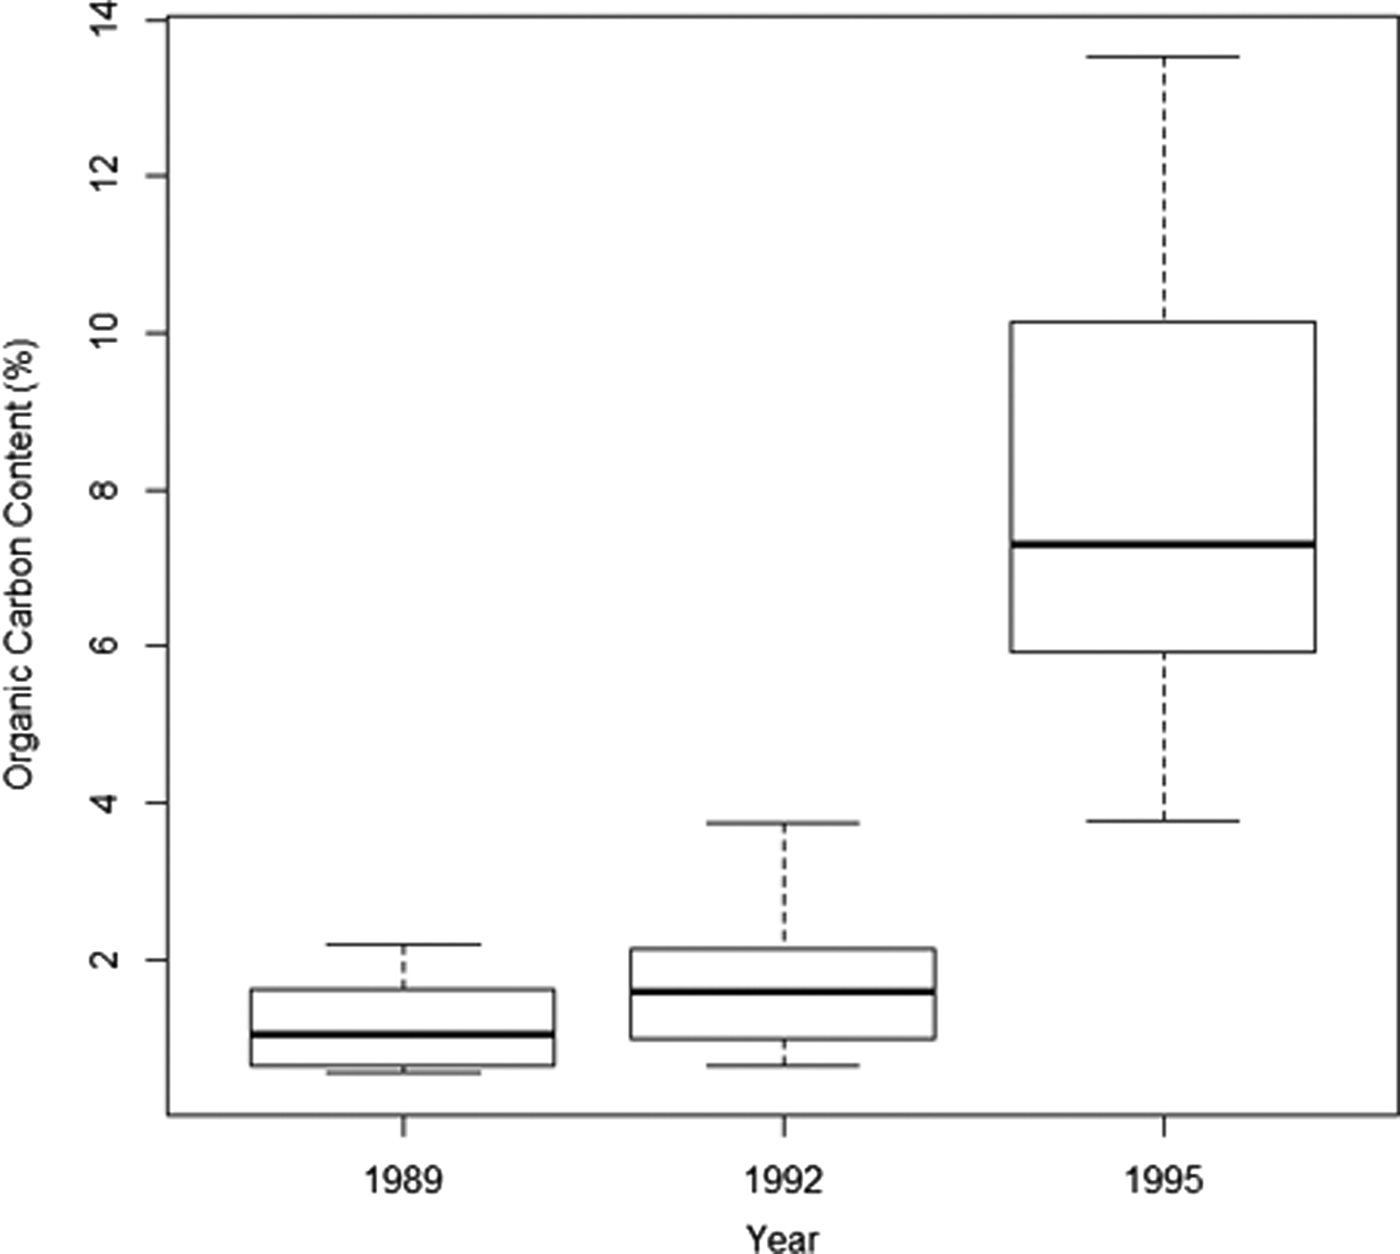
Fig. 2. Median, interquartile range and minimum and maximum values of percentage organic carbon content across all sediment samples taken at a sea sewage outfall at Ironotter Point (Firth of Clyde, UK) in each surveyed year (1989 (pre-disposal) N = 22, 1992 N = 22, 1995 N = 28).

Fig. 3. Organic carbon content at each sample point in each year taken along transects located 100 to 1000 m away from a sea sewage outfall at Ironotter Point (Firth of Clyde, UK) (1995 – blue square and solid line, 1992 – orange triangle and dotted line, 1989 (pre-disposal) – grey circle and dashed line).
Table 2. Linear model summary of the effects of distance from sewage outfall, year of survey and transect on organic carbon content at Ironotter Point
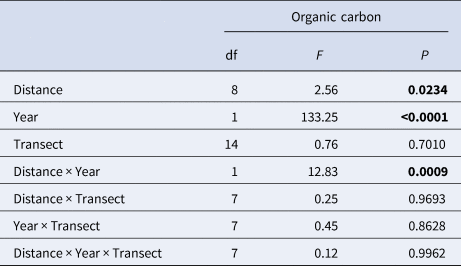
Significant values (P<0.05) are in bold.
The species assemblage in each year was distinct as revealed by MDS, which showed a temporal trend in composition, with communities shifting along the first dimension with a strong pattern related to the year of sampling (Figure 4A) (one-way ANOSIM, R = 0.657, P < 0.01). There were significant differences in composition between all years with the greatest differences found between 1989, before the sewage pipe was implemented, and the last survey in 1998 (ANOSIM pairwise comparison, R = 0.948). Differences in composition between the years increased with time also with 1989 and 1992 being the most similar (ANOSIM pairwise comparison, R = 0.551), 1992 and 1995 being more different (ANOSIM pairwise comparison, R = 0.577) and 1995 and 1998 being more different again (ANOSIM pairwise comparison, R = 0.718). The taxonomic composition within years varied across samples and became slightly more similar in later years (SIMPER average similarity 1989: 35%, 1992: 45%, 1995: 41%, 1998: 41%). A strong pattern related to organic matter content was also found (one-way ANOSIM, R = 0.273, P < 0.01) and this was related to the year of sampling (Figure 4B). The greatest differences were between the communities found in samples with ‘unknown’ organic carbon values (from 1998) and those with the lowest carbon content (one-way ANOSIM, R = 0.856 (0–1% carbon) and R = 0.874 (>1–2% carbon), P < 0.01). The strength of the relationship between benthic community similarity and organic carbon was weaker than found with year but organic carbon data were not available for 1998. The large change in organic matter content in 1995 (from an average of less than 2% previously to more than 8% on average), parallels the large changes in community composition found between 1992 and 1995. Although no data for 1998 were available, based on the fact that waste was being received and the capacity of the waste treatment plant was being phased up, it could be assumed that there was a corresponding further increase in organic matter and this was also paralleled by a further large change in community composition between 1995 and 1998.
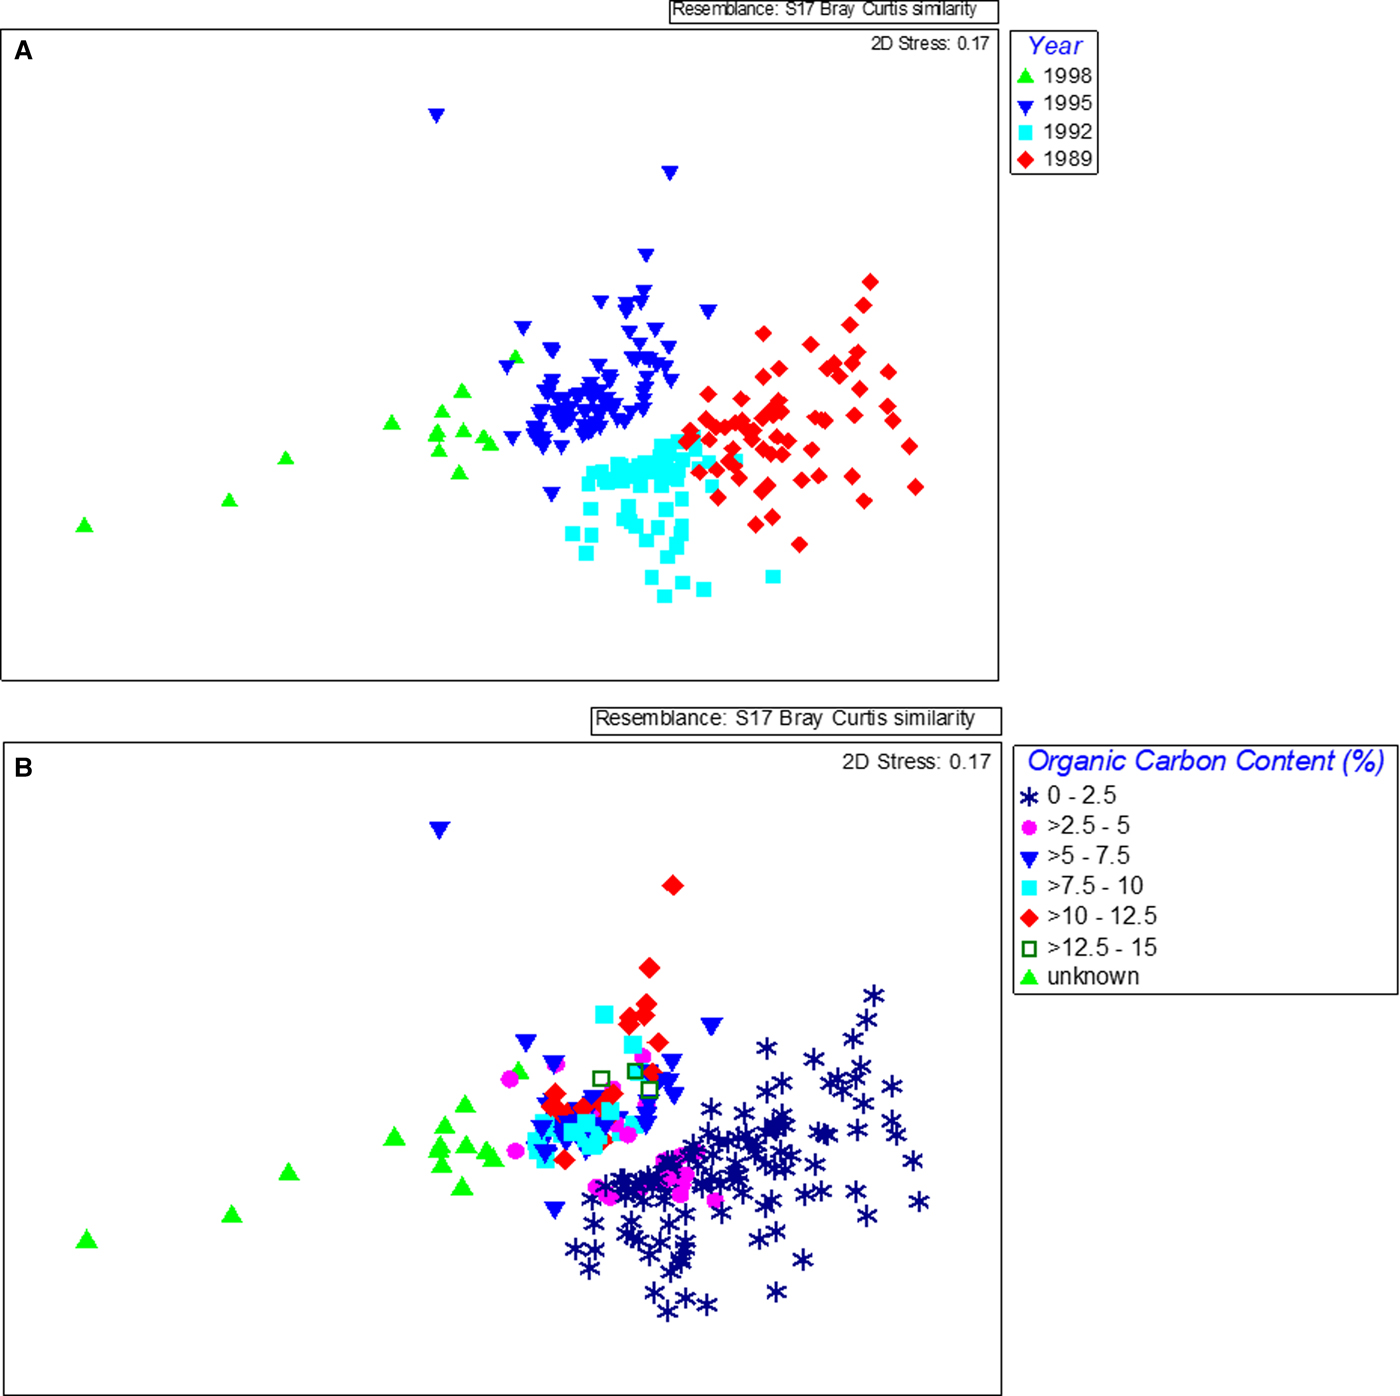
Fig. 4. MDS plots of benthic species data obtained from samples collected at Ironotter Point (Firth of Clyde, UK) according to (a) year and (b) organic carbon content in sediment. 1989 was the baseline year, before implementation of the sewage outfall pipe. Each point represents one sample with a total of 228 samples.
Across all years, 471 taxa were identified. Even when accounting for the difference in the numbers of samples taken, species richness increased over time and was greater in each year since sewage disposal began compared to before the sewage plant was operational (the least number of samples were taken in 1998 but there was still greater species richness than in either 1989 or 1992) (Table 3). 1989 had the greatest proportion of its species (19%) classified as being in AMBI Group I, i.e. the most sensitive species to organic enrichment. This compares to only 5% Group I species in 1998. The number of species that were only found in a given year also increased over time, particularly in 1995, when these made up 30% of all species (though this year also saw the most samples taken). Some of these species were in AMBI Group I and this proportion decreased over time.
Table 3. The total (pooled) number of species found across all samples taken in each year at Ironotter Point (1989 N = 64, 1992 N = 66, 1995 N = 84, 1998 N = 14). The number of species in each year that were found only in that year (‘unique’ species). The proportion of each of these that are species classified as Ecological Group I species (i.e. AMBI Group I, see Table 1)

In 1989, the community composition was distinct from other years in that the species found to be driving community patterns were the polychaetes Anobothrus gracilis, Spiophanes kroyeri and Mediomastus fragilis and the bivalves Nucula nitidosa and Thyasira flexuosa (Table 4). From 1992 onwards, some second-order opportunistic species featured amongst the most important species (from AMBI group IV). In this year, polychaetes Scalibregma inflatum, Chaetozone setosa, Chaetozone zetlandica and M. fragilis were found, in addition to T. flexuosa. In 1995, T. flexuosa, C. setosa and M. fragilis were also driving community patterns, along with the Nemertean, Tubulanus sp. and the polychaete Nephtys sp. The polychaete Ophryotrocha hartmanni, the most dominant species in 1998, was more than five times more abundant than the most dominant species in any other year. Other species that characterized the community in this year were the polychaetes M. fragilis, Prionospio fallax and Melinna palmata and the bivalve T. flexuosa. Across years, most of the important species were from AMBI group III, indicating they are tolerant. Amongst the most important species, the most common mode of bioturbation was found to be surface deposition, where fauna deposit materials at the sediment surface, while the most common feeding types were surface deposit and detritus feeders. Spiophanes kroyeri, a suspension feeder, was present in every year, but only important in driving community patterns in 1989, indicating a change in functioning after implementation of the pipe.
Table 4. The five species identified using SIMPER analysis as being primarily responsible for observed patterns across years at Ironotter Point with total abundance, average abundance, contribution (%), and cumulative total of contributions (%), ecological group (i.e. AMBI group, see Table 1), bioturbation mode (Reference Solan, Cardinale, Downing, Engelhardt, Ruesink and SrivastavaSolan et al., 2004; MarLIN, 2006), and functional feeding type (ITI group, see Table 1)

Spearman correlations of indices S, N, A/S, ITI, BOPA and BQI showed strong relationships with organic content and year (Table 5), reflecting the MDS which showed a strong effect of both organic content and year on the benthic community composition. However, not all indices reflected the expected decrease in environmental quality with time and with organic enrichment. Only J’, ITI, A/S, BOPA and AMBI indicated a decrease in quality with year and with organic enrichment. Only ITI showed decreasing quality when the effect of year was removed from the effect of organic matter (partial correlation analysis). Several indices showed a decrease in quality when the effect of organic matter was removed from the effect of year. This could indicate that some of the change over time was not due to the increase in organic matter, however no organic matter content data were available for the last survey which may have influenced these results by reducing the strength of the correlation between the indices and organic carbon. There may also not have been a linear relationship with organic carbon content. However, most indices found an improvement in quality with year and organic matter content. The strongest correlations found were between species richness and abundance with year and organic matter (Spearman rank correlation, r between 64–79%, Table 5). Weak correlations with distance (Spearman rank correlation, r between +/−20% for all indices, Table 5) could be due to the distance effect not being present, or being weak in the early years while becoming more pronounced later. Distance from the outfall did not appear to influence change in the community until the final year (for which no organic carbon data are available) and this was reflected by the quality classifications of indices (Figure S1). Thus, those samples closest to the outfall did not have worse quality than those further away but there were similar quality classifications over the whole area.
Table 5. Correlation between indices and environmental variables at Ironotter Point. Spearman rank correlations with percentage correlation, r. Partial correlation carried out to remove effect of confounding variable ‘year’ from effect of ‘organic carbon content and vice versa. Organic carbon content (%) data was not available for last year of sampling, 1998.

Note: A/S, BOPA and AMBI index values have inverse relationships with quality.
IQI, the multimetric Infaunal Quality Index used for WFD classification in the UK, showed a positive relationship with organic carbon content (Table 5). This outcome for IQI is influenced by the components of this index, which include species richness and AMBI (Table 1). Over time (Figure 5F), IQI slightly decreases in the first year after implementation of the sewage outfall, then increases from 1992 to 1995 and goes from good quality to high quality. Subsequently, a decrease in the average IQI index value is indicated from 1995 to 1998. This resulted in a weak overall correlation with year (Spearman rank correlation, r = 13%, Table 5), despite the change in community reflected by the ANOSIM (ANOSIM pairwise comparison between 1989 and 1998, R = 0.948). AMBI did not change much over time until the final year (Figure 5E), while species richness increased over time (Figure 5A). In the final year of sampling, AMBI and IQI indicated the change in the community as a negative one. However, while AMBI changed from an overall good classification in 1989–1995 to moderate in 1998, IQI remained at a good classification in the last year of sampling, disguising the relatively slight but unacceptable degradation in quality found by AMBI and other indices, including BOPA (Figure 5G) and ITI (Figure 5H), but reflecting the continued increase in species richness over time. ITI and the measures of evenness, A/S and J’ (Figure 5C, D), were the only indices to find a consistent deterioration in quality over time. These responses from the indices do not parallel the large change in community composition and the increase in organic carbon content found between 1992 and 1995, and the increasing importance of second-order opportunistic species in the communities from 1992 onwards, indicating organic enrichment.

Fig. 5. Change in macrobenthic community indices over time at Ironotter Point (Firth of Clyde, UK) (average across all sites with standard deviation, 1989 N = 64, 1992 N = 66, 1995 N = 84, 1998 N = 14). 1989 was the baseline year, before implementation of the sewage outfall pipe. Note that AMBI, A/S and BOPA have inverse relationships with quality. For details of indices, see Table 1. Quality classification threshold information can be found in Table S2.
Five indices, which have an associated quality classification (IQI, BQI, AMBI, BOPA and ITI) were used to assess the quality for each sample (e.g. ‘good’, ‘moderate’, ‘poor’) and the level of agreement between these indices was determined (see Table S3 in supporting information and Figure 6). At Ironotter, most index quality classifications indicated a decrease in quality in 1998 but no decrease in quality was evident before this, apart from ITI which showed a greater frequency of ‘changed’ classification from 1995 onwards when sediment organic matter substantially increased (Table S3). According to IQI and BQI, quality appeared to increase after the sea pipe was put in place and decrease again in 1998. This does not reflect the change in community composition and organic enrichment found over time, which indicated a decrease in quality, as described above. Looking at all samples, a total of 7% of index classifications ‘agreed’, 44% showed a ‘similar’ classification (no more than one quality classification higher or lower) and 48% ‘disagreed’ (three quality classifications given for the same sample point) and there were significant differences in average similarity of the communities at sites where indices ‘disagreed’ vs those where they were ‘similar’ (one-way ANOSIM pairwise comparison, R = 0.109, P < 0.01). All the samples where the indices agreed were found in 1989 and 1992 and most of the similar classifications were also found in these two years (Figure 4A). Most of the disagreement between indices occurred in the years 1995 and 1998, after organic matter content had increased considerably. The ITI finding largely ‘changed’ quality and the IQI finding largely ‘high’ quality were responsible for the majority of disagreement between indices (Table S3). Looking at distribution of quality assignment by indices overall showed IQI and BQI indicated better quality (80% of classifications were good or high) than BOPA and AMBI (around 40% good and no high classifications), while ITI assigned the lowest quality classifications (only changed or degraded classifications) (Figure 6).

Fig. 6. Differences in quality classifications in macrobenthic community indices found between five indices for the same array of samples taken over four years between 1989–1998 (N = 228) at Ironotter Point (Firth of Clyde, UK).
Discussion
The Pearson–Rosenberg paradigm (1978) predicts that when moving away from a source of organic pollution in space and/or time species richness will gradually increase until stable communities are reached, while abundance will increase quickly at first, before then decreasing. The current study of Ironotter Point included a baseline survey before implementation of a sewage sea outfall, followed by three surveys taken one, four and seven years after the pipe was in use. Due to the known input of organic matter and subsequent organic enrichment at this site, the expected response over time was a decrease in species richness and an increase in the abundance of opportunistic species at the pollution source, as waste output increased or accumulated over time at the site. While abundance of opportunistic species did increase, the species more sensitive to organic pollution were maintained, resulting in an overall increase in species richness over the course of the study. This response was in line with studies that have found nutrient enrichment can lead to increased species richness, greater availability of resources, greater productivity and rates of functioning and increased survival and recruitment in benthic communities (e.g. Borja et al., Reference Borja, Rodríguez, Black, Bodoy, Emblow, Fernandes, Forte, Karakassis, Muxika, Nickell, Papageorgiou, Pranovi, Sevastou, Tomassetti and Angel2009b; Abdelrhman & Cicchetti, Reference Abdelrhman and Cicchetti2012; Krumhansl et al., Reference Krumhansl, Krkosek, Greenwood, Ragush, Schmidt, Grant, Barrell, Lu, Lam, Gagnon and Jamieson2015; Lawes et al., Reference Lawes, Clark and Johnston2016). Species richness can respond to disturbance by initially increasing, corresponding to the intermediate disturbance hypothesis (Connell, Reference Connell1978; Odum, Reference Odum1985; Dodson et al., Reference Dodson, Arnott and Cottingham2000; Mittelbach et al., Reference Mittelbach, Steiner, Scheiner, Gross, Reynolds, Waide, Willig, Dodson and Gough2001; Hooper et al., Reference Hooper, Chapin, Ewel, Hector, Inchausti, Lavorel, Lawton, Lodge, Loreau, Naeem, Schmid, Setälä, Symstad, Vandermeer and Wardle2005; Huston, Reference Huston2014). Studying this site over a longer time period may have shown a subsequent decrease in species richness, as this is the expected response to organic enrichment (Pearson & Rosenberg, Reference Pearson and Rosenberg1978).
A previous study showed that sites with higher currents can support high diversity alongside high abundances of opportunistic species in the presence of disturbance (Keeley et al., Reference Keeley, Forrest and Macleod2013). In the first year after operation of the pipe at Ironotter, organic matter levels were only slightly elevated but had substantially increased in 1995. The carbon content found in 1995 (on average 8% and a range of 3.78–13.52%) is comparable to that found in impacted sewage disposal sites elsewhere (e.g. at the Garroch Head sludge disposal central point values ranged from 6–15% (Caswell et al., Reference Caswell, Paine and Frid2018) and at the Nervion estuary the means at the most impacted sites were around 10%, and at intermediate sites 6–7% (Borja et al., Reference Borja, Muxika and Franco2006)). Nevertheless, in 1995, most indices did not detect impacts on the community due to the enrichment. Given that increased organic carbon was observed over the entire area, even up to 1000 m from the outfall, this suggests the site was dispersive and may have a relatively high flow. However, at the same time, the build-up of organic matter found in 1995, was more comparable to low flow sites in Keeley et al. (Reference Keeley, Forrest and Macleod2013), where higher levels of biodiversity were not supported. The levels of species richness supported at this site (on average 61.9 in 1995 and 71.1 in 1998) are much greater than those reporting sewage impacts elsewhere with similar levels of organic enrichment (e.g. 6.6–24.7 species at the most impacted stations at Garroch Head; Caswell et al., Reference Caswell, Paine and Frid2018). The species richness here is similar to that found at disposal sites in Liverpool Bay, where the elevated species richness at disposal sites compared with reference sites was attributed to natural site differences (Whomersley et al., Reference Whomersley, Schratzberger, Huxham, Bates and Rees2007). However, that study had much lower levels of organic carbon than found in this study (ranging from 1.92–3.04%) and did not have pre-disposal data available to establish if sites were naturally different.
Even with an increase in species richness, other indices which take species identity and the proportion of opportunistic species into account, would still be expected to indicate a decrease in quality, as found in other studies (e.g. Borja et al., Reference Borja, Rodríguez, Black, Bodoy, Emblow, Fernandes, Forte, Karakassis, Muxika, Nickell, Papageorgiou, Pranovi, Sevastou, Tomassetti and Angel2009b). At Ironotter, ITI detected a slight decreasing trend with organic enrichment and showed a decreasing trend with year from 1992 onwards, reflecting a change in the functional feeding group composition and a relative decrease in suspension feeders, such as S. kroyeri. AMBI indicated a decrease in quality over time but, in contrast to what has been found elsewhere (Borja et al., Reference Borja, Muxika and Franco2006), showed no strong trend with increasing organic matter content. The decrease in quality detected did not manifest in a change in quality classification until the final year of sampling. From 1992 to 1995, AMBI showed no change because disturbance sensitive taxa were maintained in the community, even in the presence of organic enrichment. BOPA performed similarly to AMBI. However, during this time, the community was changing, and the differences were primarily driven by species that have been found to be indicative of enrichment elsewhere. For example, in 1989, important species in the community included S. kroyeri and Nucula nitidosa, species that are associated with undisturbed sites (e.g. Reiss & Kröncke, Reference Reiss and Kröncke2005; Caswell et al., Reference Caswell, Paine and Frid2018). Other species found in this year included Mediomastus fragilis and Thyasira flexuosa, both of which have been associated with intermediate levels of organic enrichment (Pearson & Rosenberg, Reference Pearson and Rosenberg1978; Rees et al., Reference Rees, Pendle, Limpenny, Mason, Boyd, Birchenough and Vivian2006; Caswell et al., Reference Caswell, Paine and Frid2018). These then increased in abundance in 1992, along with further organic enrichment indicator species Scalibregma inflatum, Chaetozone setosa and Chaetozone zetlandica (Pearson & Rosenberg, Reference Pearson and Rosenberg1978; Rees et al., Reference Rees, Pendle, Limpenny, Mason, Boyd, Birchenough and Vivian2006). A similar pattern of increasing abundance of these enrichment indicator species continued until, in 1998, the community was dominated by opportunistic species such as Ophryotrocha hartmanni (Cardell et al., Reference Cardell, Sardà and Romero1999), showing a clear indication of an enriched community.
The multimetric index, IQI, detected an increase with organic matter and a small decrease in quality with year when the effect of organic matter was removed. This linear trend hid what was initially a slight increase in quality with year before a slight decrease again. This was reflected in the quality classifications, which mostly changed from good to high, to good again in the final year. This also reflects the influence of species richness on this index. Species richness and AMBI overall demonstrated opposing trends at this site and this resulted in the outcome that the negative trend indicated by AMBI was dampened so that IQI showed little change in quality over time. Out of the five indices that have quality classifications, apart from ITI, negative impacts implying a degraded state were not detected by the indices until around seven years after the pipe was installed. This may be a suggestion of the resilience of the benthic community since higher diversity is often correlated to greater resilience or stability (e.g. Worm et al., Reference Worm, Barbier, Beaumont, Duffy, Folke, Halpern, Jackson, Lotze, Micheli, Palumbi, Sala, Selkoe, Stachowicz and Watson2006). Other studies have found a lag in response of benthic communities, where they remain relatively stable before a critical threshold of oxygen saturation is reached and the community collapses (Josefson & Widbom, Reference Josefson and Widbom1988; Diaz & Rosenberg, Reference Diaz and Rosenberg1995). In this study, the communities did not collapse, but species richness increased alongside clear indications of changes in the community, ultimately towards a degraded state. The ITI results showed that functional characteristics, in terms of the feeding modes present within the community, had changed by 1995. Thus, it would appear resilience and stability were decreasing over time and with increasing enrichment.
It is possible that the patterns observed were due to other external factors unrelated to the organic enrichment, or where there are other factors which maintain levels of species richness in the presence of organic enrichment, such as the presence of differing flow regimes (e.g. Keeley et al., Reference Keeley, Forrest and Macleod2013), or where responses are highly site specific (Villnäs et al., Reference Villnäs, Perus and Bonsdorff2011). However, we did not have an extended time series of data from before the baseline study or an undisturbed reference site against which to make a comparison. Partial correlations indicated the effect of year was stronger than the organic carbon effect, suggesting other factors could also be involved. These other factors may be related to the input of sewage into the system but not captured by measuring organic carbon content. For example, in the Nervion estuary, Borja et al. (Reference Borja, Muxika and Franco2006) found AMBI to be more highly correlated with oxygen saturation than with organic matter, although there were still much stronger correlations with organic matter than were found in this study. No organic carbon data were available for the last year which may also obscure these results. The waste discharged from the sewage treatment plant at this time was likely to have other contaminants in addition to organic matter and, although not consistently measured, measurements taken in 1995 showed elevated levels of heavy metals (Table S4). Other studies have shown that the presence of nutrients can mitigate the effects of heavy metals on some benthic invertebrates by increasing recruitment and decreasing mortality (Lawes et al., Reference Lawes, Clark and Johnston2016). However, it is likely that these highly persistent contaminants will build up in the system over the years, and not be removed in the same way that nutrients are, eventually leading to deteriorating conditions (Watson et al., Reference Watson, Paterson, Queirós, Rees, Stephens, Widdicombe and Beaumont2016).
Different types of linear and non-linear responses to environmental gradients were found at this site and responses could be confounded with several factors, measured and unmeasured, making interpretation of the index responses difficult. As well as a greater amount of information benefitting interpretation of index responses, other methods may be more suitable for measuring the response of indices to environmental and temporal gradients in order to detect non-linear trends and to account for confounding factors. Long-term studies also may be responding to natural succession events in the community (e.g. Stull et al., Reference Stull, Haydock, Smith and Montagne1986; Rees et al., Reference Rees, Pendle, Limpenny, Mason, Boyd, Birchenough and Vivian2006; Clare et al., Reference Clare, Spencer, Robinson and Frid2017). However, the clear shift in species composition according to ANOSIM suggested the community was showing a larger and more rapid response than would be expected under normal conditions (Clarke & Warwick, Reference Clarke and Warwick2001) and this was most likely to be due to the input of organic material. Species richness doubled from pre-disposal to the last year of sampling, but this study shows any change, up or down, in species richness should be used as an early indication of change in the system. Echoing the recommendations of others (e.g. Pinto et al., Reference Pinto, Patrício, Baeta, Fath, Neto and Marques2009; Kröncke & Reiss, Reference Kröncke and Reiss2010; Villnäs et al., Reference Villnäs, Norkko, Lukkari, Hewitt and Norkko2012), this should be considered alongside other methods such as multivariate analysis to look at species composition, measures of evenness, ITI, AMBI, environmental variables and other indices to interpret the change in the system. The complexity of potential responses (e.g. Borja et al., Reference Borja, Muxika and Franco2006; Rees et al., Reference Rees, Pendle, Limpenny, Mason, Boyd, Birchenough and Vivian2006; Whomersley et al., Reference Whomersley, Schratzberger, Huxham, Bates and Rees2007; Caswell et al., Reference Caswell, Paine and Frid2018) shows the importance of not relying on a single index for quality classification. Structural properties of ecosystems can respond in variable ways to disturbance while functional properties may indicate, more reliably, the direction of changes in quality (Paul, Reference Paul and Hatcher1997; Feld & Hering, Reference Feld and Hering2007; Villnäs et al., Reference Villnäs, Norkko, Lukkari, Hewitt and Norkko2012) or the cause of change (Culhane et al., Reference Culhane, Briers, Tett and Fernandes2014). We found those indices that take species richness into account (e.g. IQI, BQI) find a greater proportion of high/reference conditions, and those that are based only on species identity and include functional traits (e.g. BOPA, AMBI, ITI), find greater proportions of moderate, poor or bad ecosystem state.
Studies have found that, generally different benthic index results correlate positively with each other, but do not necessarily arrive at the same quality classification, suggesting a need for calibration (Labrune et al., Reference Labrune, Amouroux, Sarda, Dutrieux, Thorin, Rosenberg and Gremare2006; Quintino et al., Reference Quintino, Elliott and Rodrigues2006; Zettler et al., Reference Zettler, Schiedek and Bobertz2007; Blanchet et al., Reference Blanchet, Lavesque, Ruellet, Dauvin, Sauriau, Desroy, Desclaux, Leconte, Bachelet, Janson, Bessineton, Duhamel, Jourde, Mayot, Simon and De Montaudouin2008). In this study, the agreement between the five index classifications mainly showed agreement between indices, or similar trends in the baseline year and first year after installation. However, in 1995 most indices were found to disagree and in 1998 most indices again showed similar status. It may be that a moderate level of disturbance increases disagreement between indices and causes indices to act unpredictably. Caswell et al. (Reference Caswell, Paine and Frid2018) found greater coefficients of variation of species richness at intermediate sites than at reference sites, highlighting greater patchiness and variability at these sites. This patchiness could also influence index results at intermediate levels of disturbance. Since indices perform less well in distinguishing intermediate disturbance, this could also be important for the detection of small changes in quality and early warning signals. AMBI detected little change in quality (index value), and no change in quality classification until the last year. Other studies have found AMBI to be unsuitable for detecting small changes over time (Kröncke & Reiss, Reference Kröncke and Reiss2010) and differences between ‘good’ and ‘moderate’ qualities can go undetected (Puente & Diaz, Reference Puente and Diaz2008).
Results in this study showed that most indices did not respond in the expected way to the introduction of a disturbance. This was largely due to the increase in species richness across all stations over time that we observed. Indices should make the interpretation of complex environmental data simpler and ideally reflect anthropogenic disturbance in a reliable and consistent way (Karr, Reference Karr1999). During periods of moderate change, indices may be particularly unpredictable in how they classify quality. Species richness did not change in the expected direction but did change quickly and considerably in magnitude, and therefore could be considered an early warning indicator of disturbance, but further exploration and assessment would be required to interpret this change, including multivariate analysis and interpretation of environmental variables.
The use of multi-metric indices such as IQI is largely policy driven (Phillips et al., Reference Phillips, Anwar, Brooks, Martina, Miles and Prior2014; van Loon et al., Reference van Loon, Boon, Gittenberger, Walvoort, Lavaleye, Duineveld and Verschoor2015). Multi-metric indices should magnify a common signal in the combined metrics (Schoolmaster et al., Reference Schoolmaster, Grace and Schweiger2012). But if those signals are opposing due to the unpredictable response of communities to change, such as in this study, this signal can be dampened. IQI still indicated ‘good’ quality in the final year of sampling, whereas AMBI indicated a decrease in quality to ‘moderate’ status. Indices summarize a large amount of information into a single value, resulting in something which, in principle, is easier to understand but is also possibly prone to misinterpretation due to loss of information (Rees et al., Reference Rees, Pendle, Limpenny, Mason, Boyd, Birchenough and Vivian2006). It may be more beneficial to use the separate component parts of multi-metric indices rather than the combined form, thus taking a more cautious and informative approach to the assessment of benthic health.
As human populations increase, the problem of waste treatment and sewage discharge into coastal areas also increases. Benthic communities here exhibited a degree of resilience to degradation in response to the input of sewage, with high species diversity maintained alongside high abundance of opportunistic species. Yet, the communities showed compositional and functional changes indicative of organic enrichment before being classified as degraded in 1998. There was a shift between 1995 and 1998, where the community switched from initially coping with the level of waste to showing clear indications of unacceptable change. We found some of the indices used, such as IQI, were less sensitive to small shifts, while species richness changed quickly. At the global extent that sewage is discharged around the world, there are significant implications for the structure and functioning of coastal ecosystems and their capacity to continue to supply the waste treatment ecosystem service. There is a need to establish the relative utility of different assessment approaches for ‘early warning’ signals. In particular, we need to establish when is the best time to intervene, rather than wait until major changes have occurred, and hence potential impacts are greater and more difficult to rectify.
Supplementary material
The supplementary material for this article can be found at https://doi.org/10.1017/S0025315419000857
Acknowledgements
We thank Myles O'Reilly and the Scottish Environment Protection Agency (SEPA) for providing data and background information about the study site and sampling protocol. We thank colleagues from the University of Liverpool's Ecology and Marine Biology Department and anonymous reviewers for comments on a previous version of this manuscript.
Financial support
This work was supported by funding from the EU FP6 project SPICOSA, although the work reported here was not part of the requirements or deliverables of SPICOSA.


 Open access