


In women, breast cancer (BC) is the most common type of diagnosed cancer and the leading cause of cancer death in both developed and developing countries(Reference Bray, Ferlay and Soerjomataram1). Among the treatment modalities, chemotherapy (CT) is recommended for most BC patients(Reference Rapoport, Demetriou and Moodley2,Reference Abrams3) , a practice that contributes to reduce relapse, metastasis and mortality(4). However, CT has a non-selective systemic approach, affecting both mutant and healthy cells, which can be toxic and cause a series of adverse effects that directly affect food consumption(Reference Chen, Jungsuwadee and Vore5).
The adverse effects of CT interfere negatively on daily dietary intake and perceptions related to food intake(Reference Custódio, Marinho and Gontijo6–Reference Marinho, Custódio and Ferreira8). Food that was palatable is often rejected during CT, mainly due to changes in appetite, taste and nausea(Reference Marinho, Custódio and Ferreira7). In addition, there may be a decrease in the intake of macro- and micronutrients during treatment, as well as of important food groups, such as Total Fruit and Dark Green and Orange Vegetables and Legumes(Reference Custódio, Marinho and Gontijo6).
Recent evidence also suggests that dietary behaviours related to lower daily eating frequency (EF) may negatively influence the diet quality(Reference Murakami and Livingstone9–Reference Zizza and Xu11) and the metabolic health of humans(Reference Papakonstantinou, Kechribari and Mitrou12), including the risk of developing cancer(Reference Marinac, Sears and Natarajan13,Reference Perrigue, Kantor and Hasterd14) . Specifically for BC, one single study, to our knowledge, found that a lower number of daily eating episodes in healthy women would be related to the increase in biomarkers linked to systemic inflammation and, consequently, to an increased risk of developing the disease, but the study did not evaluate the impact on diet quality(Reference Marinac, Sears and Natarajan13). Studies with other population groups involving EF and diet quality, however, did not present significant results(Reference Evans, Jacques and Dallal15,Reference Barnes, French and Harnack16) and need to be better explored.
In addition to diet quality, inverse associations between the number of eating episodes and anthropometric variables were identified(Reference Zhu and Hollis10,Reference Marin-Guerrero, Gutiérrez-Fisac and Guallar-Castillón17,Reference Kim, Yang and Park18) . Studies show better control of body weight and healthy maintenance of biological markers when eating episodes are lower in energy intake and more frequent(Reference Jääskeläinen, Schwab and Kolehmainen19–Reference Ma, Bertone and Stanek21), but the results are still inconsistent because of variations in methodological factors, especially for the optimal number of meals for anthropometric benefits(Reference Yildiran22,Reference Kahleova, Lloren and Mashchak23) . It is known that negative anthropometric changes in BC patients are already commonly observed during CT(Reference Custódio, Marinho and Gontijo6,Reference Schavartsman, Gutierrez-Barrera and Song24) and are negatively related to the prognosis of the disease(Reference Sun, Bao and Liu25,Reference Azrad and Demark-Wahnefried26) . However, there are no studies associating anthropometric variables with daily EF during CT in BC patients.
Considering that CT negatively impacts diet quality and the nutritional status of women with BC and that EF is a modifiable dietary factor that can influence the individual health, it is important to understand the relationship between these variables. In this sense, the aim of the present study was to examine the association between the number of eating episodes with diet quality and the nutritional status at the three times of CT, in order to guide personalised nutritional strategies for the women during treatment.
Methods
Ethical aspects
The study was conducted based on the norms of the Declaration of Helsinki and Resolution CNS 466/12, after approval by the Ethics Committee on Research with Human Beings (protocol number: 721.977/14, addendum number: 1.111.998/15). All participants signed a free and informed consent form.
Study sample and clinical setting
A prospective longitudinal study including three sequential assessments with fifty-five women with BC patients during CT was conducted from August 2014 to October 2015 in Clinics Hospital of the Federal University of Uberlandia, Uberlândia, Minas Gerais, Brazil. Considering the CT regimen, the follow-up times ranged from 4 to 6 months.
The three sequential assessments during treatment were called: T0, period before the administration of the first cycle of CT; T1, period after the administration of the intermediate cycle; and T2, period after the administration of the last cycle of CT.
To characterise the sample, socio-economic, therapeutic and clinical data were extracted from the medical records and personal interviews were carried out.
Sample size calculation and eligibility criteria
The G*Power software, version 3.1(Reference Faul, Erdfelder and Lang27), was used to determine the sample size required for the present study. Considering a single group of individuals and three measurements, the sample size calculations were based on an F-test repeated-measures ANOVA with an effect size of 0·25, an α level of 0·05 and 95 % power. Given these specifications, the result of the calculation required a minimum sample size of forty-three women. Considering a 20 % adjustment for possible losses, a minimum of fifty-two women was needed at baseline (T0).
The present study included women aged 18 years or older, diagnosed with primary BC, who were in the first cycle of CT and who had verbal and cognitive ability needed to respond to the interviews. Women with primary tumour site other than the breast and those on anticancer treatment that did not include CT were excluded from the sample. All patients received a doxorubicin and/or taxane-based CT for neoadjuvant or adjuvant treatment.
Anthropometric assessment
Waist circumference (WC) and hip circumference were measured using an inelastic and flexible tape with 1 mm precision, according to the Lohman, Roche and Martorell protocol(Reference Lohman, Roche and Martorell28). After obtaining these measurements, waist:hip ratio(29) and waist:height ratio (WHtR)(Reference Ashwell and Hsieh30) were calculated. In addition, body weight and height were obtained following the protocol recommended by the WHO(31). To measure body weight, a mechanical scale (model P-150C; Líder Balanças) was used with a sensitivity of 100 g. For height, a vertical stadiometer (model P-150C; Líder Balanças) with 1 mm precision scale was used. Subsequently, BMI was calculated dividing weight by height squared (kg/m2) and classified as recommended by the WHO (31) and by Lipschtz(Reference Lipschtz32), for the adult population (age > 20 and <60 years) and the elderly (≥60 years), respectively.
Qualitative dietary assessment
Qualitative dietary assessment was performed using the Brazilian Healthy Eating Index Revised (BHEI-R) for the following components or food groups: Total Fruit (including fruit and natural fruit juices); Whole Fruit (excluding fruit juices); Meat, Eggs and Beans; Total Vegetables (including legumes after reaching the maximum score for Meat, Eggs and Beans); Dark Green and Orange Vegetables and Legumes (including legumes after reaching the maximum score for Meat, Eggs and Beansgroup, and Total Vegetables); Total Grains (including grains, roots and tubers); Whole Grains; Milk and Dairy Products (including milk and dairy products, as well as soya-based drinks); Oils (including mono- and polyunsaturated fats, seed oils and fish oils); Saturated Fat; Na and SoFAAS (energy content from solid fats, alcohol and added sugars)(Reference Previdelli, de Andrade and Pires33).
A total of nine 24-h dietary recalls (24HR) were obtained per participant (three 24HR each time) applied through telephone interviews, on non-consecutive days, including a day of the weekend in order to better reflect the eating habits of the participants. The 24HR were applied preferably in the second week after the infusion of CT to avoid the acute effect of the treatment. The data with household measures from the 24HR were converted to units of measurement (g or ml) by Dietpro® software, using as a reference, preferably, the Brazilian Table of Food Composition(34), followed by the United States Department of Agriculture table(35). The number of daily servings (adjusted by the energy density, 4184 kJ) was calculated. In addition, the total score of BHEI-R and score for each Index food group were calculated. The maximum score is 100 points for total BHEI-R. For individual components, the scores can be from zero (minimum) up to 5, 10 or 20 (maximum), depending on the food group. The criteria for establishing the minimum, intermediate and maximum scores consider the number of daily portions recommended by the Food Guide for the Brazilian Population(36), following the recommendation of Previdelli et al. (Reference Previdelli, de Andrade and Pires33). For components such as saturated fat, Na and SoFAAS, the greater the intake, the lower the score assigned. More details about the BHEI-R score calculation are available in Fig. 1.
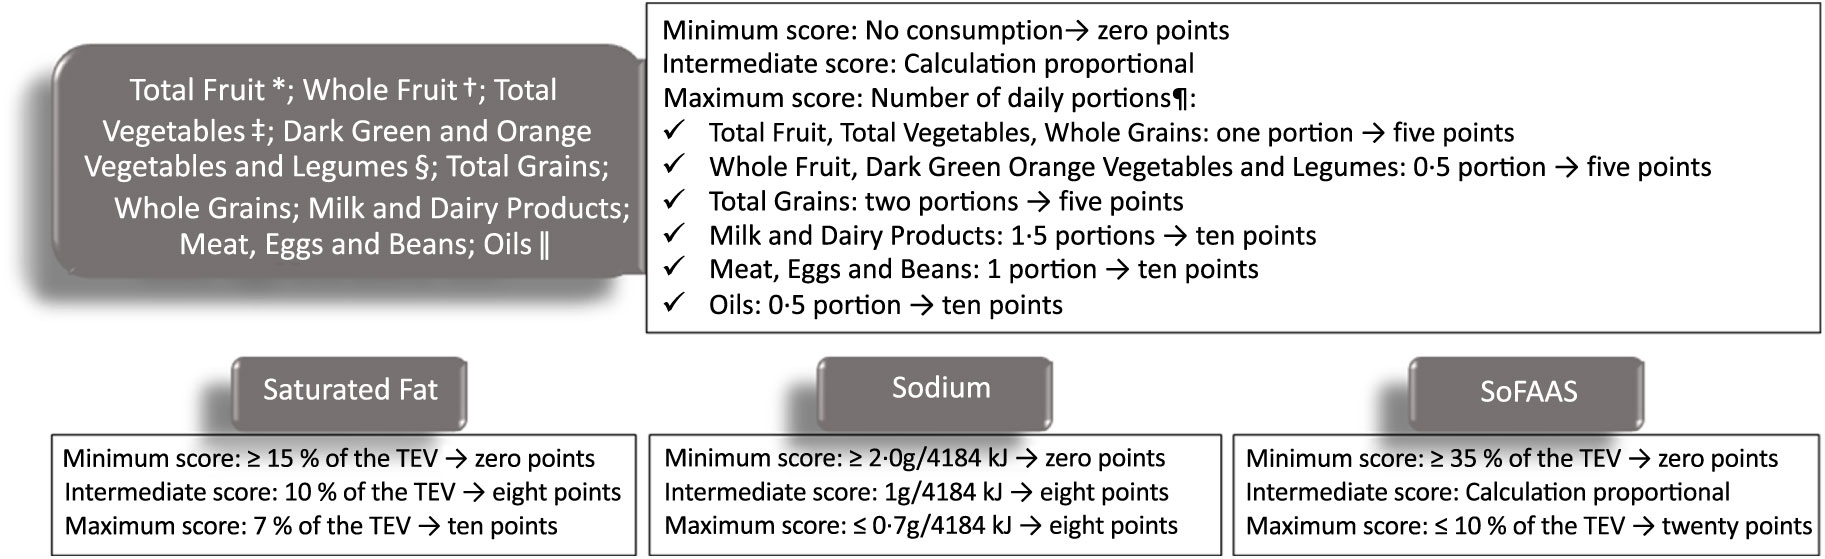
Fig. 1. Scoring criteria for components of the Brazilian Healthy Eating Index Revised. TEV, total energy value. * Including fruit and natural fruit juices; † excluding fruit juices; ‡ including legumes after reaching the maximum score for Meat, Eggs and Beans; § including legumes after reaching the maximum score for Meat, Eggs and Beans group, and Total Vegetables; || including mono- and polyunsaturated fats, seed oils, and fish oils. ¶ Number of daily portions recommended by Food Guide for the Brazilian Population, considering 4184 kJ/d. Adapted from Previdelli et al. (Reference Previdelli, de Andrade and Pires33).
Eating frequency assessment
Daily EF was defined as the mean of the number of daily eating episodes reported in the three 24HR obtained at each CT time. It is unclear how many ingested energy content are needed for initiation of metabolic processes; therefore, we determined a minimum value of 30 kcal (125·5 kJ) for the definition of an eating episode, similar to the study by Marinac et al. (Reference Marinac, Sears and Natarajan13) that used cut-off points of up to 25 kcal (104·6 kJ). The EF was analysed as a continuous variable and also categorised into two groups determined by being equal to or above (higher EF group) or below (lower EF group) the median value. The EF median values were obtained for each CT time.
Statistical analyses
First, the Shapiro–Wilk normality test was performed. From the behaviour of the variables, parametric tests for variables with normal distribution or non-parametric tests for variables without normal distribution were performed. The comparative analyses were performed between the groups determined by the median EF at each time, using the independent-samples t test and Mann–Whitney U test. Values were presented as mean values and standard deviations for data with normal distribution or as medians and minimum and maximum values for data that had no normal distribution. In order to determine the associations of EF on diet quality (BHEI-R groups), generalised linear models were used. Individual tests with continuous variables were done for each BHEI-R group (dependent variables) and EF (independent variable), using gamma or linear distributions. The models were controlled for income (variance inflation factor < 10 and tolerance > 0·1 were considered for the diagnosis of collinearity). The best model was chosen based on the smaller Akaike information criterion resultant from the analysis. All statistical analyses were performed using the SPSS® (SPSS, Inc.) software package (SPSS Statistics for Windows, version 21), and a P ≤ 0·05 was considered statistically significant.
Results
The present study included fifty-five BC women underwent CT, with a mean age of 51·5 (sd 10·1) years. Clinical, hormonal and therapeutic data have been described in recently published studies by our group(Reference Custódio, Marinho and Gontijo6–Reference Marinho, Custódio and Ferreira8). There was a higher percentage of women with a low educational level (43·6 %, n 24) and income (52·7 %, n 29) (Table 1). In addition, 60·0 % (n 33) declared themselves white and, in relation to marital status, 60·0 % (n 33) reported having partners. For socio-demographic characteristics, we investigated differences between the groups with respect to EF at T0, T1 and T2. The EF median values (minimum; maximum) were obtained for each time (T0: 4·67 (2·67; 5·67); T1: 4·67 (2·67; 6·00) and T2: 4·33 (2·00; 5·33) eating episodes per d). At T0, before the first cycle of CT, women who consumed a greater number of eating episodes (≥4·67) had significantly higher income compared with those with an EF of <4·67 daily episodes (73·1 %, n 19 v. 30·4 %, n 7, P = 0·034, respectively). For other characteristics and times, no statistically significant differences were identified (Table 1).
Table 1. Socio-demographic characteristics divided by the median eating frequency in each of the three periods of chemotherapy (n 55) (Numbers and percentages)
T0, period after administration of the first cycle of chemotherapy; T1, period after administration of the intermediate cycle; T2, period after administration of the last cycle of chemotherapy.
* Minimum wage per month. R$ 880·00. χ 2 Independence test.
† Monte Carlo test, considering three cells with frequency below 5; statistically significant (P < 0·05).
Table 2 presents the analysis of the groups and BHEI-R Total score and the anthropometric variables in relation to the EF groups at each time. When we compare women by medians of daily EF, significant differences were observed for some of the BHEI-R groups. In T1, it was verified that women with a higher EF, compared with those with lower frequency, had higher scores for the Total Fruit group (4·1 v. 3·3 points, P = 0·023, respectively), Whole Fruit (4·4 v. 3·3 points, P = 0·008, respectively); Total Vegetables (4·4 v. 3·6 points, P = 0·016, respectively); Dark Green and Orange Vegetables and Legumes (3·7 v. 2·3 points, P = 0·001, respectively); Whole Grains (0·5 v. 0·0 points, P = 0·013, respectively) and BHEI-R Total score (68·4 v. 63·3 points, P = 0·019, respectively). Similarly, with the exception of the Whole Grains group, in T2, the women with higher EF compared with those with lower frequency presented higher scores: Total Fruit group (4·2 v. 1·7 points, P < 0·001, respectively); Whole Fruits (3·8 v. 1·7 points, P < 0·001, respectively); Total Vegetables (4·5 v. 3·5 points, P = 0·019, respectively); Dark Green and Orange Vegetables and Legumes (3·3 v. 2·1 points, P = 0·020, respectively) and BHEI-R Total score (68·2 v. 60·3 points, P = 0·001, respectively). In T0, no statistically significant differences were found for the mentioned groups; however, an inverse relationship was observed for Meat, Eggs and Legumes (7·6 v. 8·4 points, P = 0·019, respectively), where there was a higher consumption by those women who had a lower EF.
Table 2. Scores of the total Brazilian Healthy Eating Index Revised (BHEI-R) and its groups and anthropometric variables divided by the median eating frequency in each of the three periods of chemotherapy (Mean values and standard deviations; medians and p25–p75 values)
T0, period after administration of the first cycle of chemotherapy; T1, period after administration of the intermediate cycle; T2, period after administration of the last cycle of chemotherapy; SoFAAS, energy from solid fats, alcohol and added sugars; WC, waist circumference; WHR, waist:hip ratio; WHtR, waist:height ratio.
* Mann–Whitney U test (medians and p25–p75 values); statistically significant P < 0·05.
† Independent t test (mean values and standard deviations).
When comparing the anthropometric variables between the EF groups, it was found that, at T0, women with consumption ≥ 4·67 eating episodes, compared with the consumption group < 4·67, presented lower values for BMI (25·0 v. 29·8 kg/m2, P = 0·034, respectively), WC (86·1 (sd 14·4) v. 97·2 (sd 15·3) cm, P = 0·009, respectively), waist:hip ratio (0·8 (sd 0·1) v. 0·9 (sd 0·1), P = 0·007, respectively) and WHtR (0·5 (sd 0·1) v. 0·6 (sd 0·1), P = 0·009, respectively). These findings were similar in T1 for WC (87·6 (sd 17·2) cm v. 95·3 (sd 11·7) cm, P = 0·020, respectively), waist:hip ratio (0·8 (sd 0·1) v. 0·9 (sd 0·1), P = 0·020, respectively) and WHtR (0·6 (sd 0·1) v. 0·6 (sd 0·1), P = 0·045, respectively). No significant difference was found at T2 (Table 2).
The associations of daily EF on BHEI-R groups and anthropometric variables were analysed and are shown in Table 3. In T0, T1 and T2, the generalised linear model analyses showed that EF was positively associated with the following BHEI-R groups: Total Fruit (0·62 (95 % CI 0·14, 1·10), P = 0·012; 1·09 (95 % CI 0·53, 1·64), P < 0·001 and 1·25 (95 % CI 0·72, 1·77), P < 0·001, respectively), Whole Fruit (1·08 (95 % CI 0·58, 1·57), P < 0·001; 1·36 (95 % CI 0·81, 1·92), P < 0·001 and 1·47 (95 % CI 0·92, 2·02), P < 0·001, respectively), Total Vegetables (0·57 (95 % CI 0·20, 0·94), P = 0·002; 0·54 (95 % CI 0·16, 0·91), P = 0·005 and 0·52 (95 % CI 0·07, 0·97), P = 0·024, respectively) and Dark Green and Orange Vegetables and Legumes (0·94 (95 % CI 0·39, 1·48), P = 0·001; 0·72 (95 % CI 0·18, 1·26), P = 0·009 and 0·64 (95 % CI 0·09, 1·19), P = 0·022, respectively). In addition, the EF was also positively associated with the BHEI-R Total score in T1 and T2 (4·44 (95 % CI 7·55, 1·27), P = 0·006 and 5·42 (95 % CI 2·50, 8·35), P ≤ 0·001, respectively), as well as with Whole Grains in T1 (0·40 (95 % CI 0·03, 0·77), P = 0·036). No significant associations were found for other groups.
Table 3 Associations between eating frequency and the total Brazilian Healthy Eating Index Revised (BHEI-R) and its groups and anthropometric variables
(β-Coefficients; Wald χ 2 values; 95 % confidence intervals)
T0, period after administration of the first cycle of chemotherapy; T1, period after administration of the intermediate cycle; T2, period after administration of the last cycle of chemotherapy; SoFAAS, energy from solid fats, alcohol and added sugars; WC, waist circumference; WHR, waist:hip ratio; WHtR, waist:height ratio.
* The estimation of the scale parameter was zero after removing extreme values and outliers, making the requested generalised linear models analysis impossible; models controlled for income.
As regards the nutritional status, at T0, we observed negative and significant associations between daily EF and all anthropometric variables evaluated: BMI (−0·11 (95 % CI −0·20, −0·01), P = 0·024), WC (−0·09 (95 % CI −0·16, −0·02), P = 0·009), waist:hip ratio (−0·03 (95 % CI −0·06, −0·00), P = 0·037) and WHtR (−0·09 (95 % CI −0·16, −0·02), P = 0·016). At T1, significant negative associations were observed between daily EF and WHtR (−0·04 (95 % CI −0·08, −0·00), P = 0·032). There were no significant associations at T2 (Table 3).
Discussion
In the present study, we observed that women with BC undergoing CT with a higher median daily EF presented better anthropometric parameters, at T0 and T1, as well as higher scores for BHEI-R specific groups and BHEI-R Total score at T1 and T2. The generalised linear models showed that the daily EF had the ability to predict all the anthropometric variables at T0 and, specifically, the WHtR at T1. Also, a higher daily EF was associated with higher intakes for the following groups of BHEI-R at T0, T1 and T2: Total Fruit, Whole Fruit, Total Vegetables and Dark Green and Orange Vegetables and Legumes. Additionally, at T1 and T2, a daily EF was also associated with higher BHEI-R Total score, as well as the higher intake of Whole Grains group at T1.
The systemic effect of CT can lead to undesirable adverse effects such as changes in eating perceptions, appetite reduction, nausea and vomiting(Reference Marinho, Custódio and Ferreira7,Reference Marinho, Custódio and Ferreira8,Reference Pearce, Haas and Viney37) . These effects may negatively affect the dietary intake of BC women in terms of quantity and quality(Reference Custódio, Marinho and Gontijo6), as well as resulting in changes in dietary hedonism during CT(Reference Marinho, Custódio and Ferreira7). In a previous study with the same sample of women with BC, important food components such as Total Fruit and Dark Green and Orange Vegetables and Legumes reduced with a significant difference during the three times of CT(Reference Custódio, Marinho and Gontijo6). Also, significant changes were observed when comparing the anthropometry at the beginning and at the end of the treatment, such as weight gain, BMI and waist circumference(Reference Custódio, Marinho and Gontijo6). Fang et al. (Reference Fang, Gan and Chen38) also found that women with BC experienced gains in weight and body fat percentage after CT.
In the present study, we observed a negative association between the anthropometric parameters and daily EF, especially before the first cycle of CT. Results from previous studies with other populations also suggest that EF may be associated with nutritional status(Reference Kim, Yang and Park18–Reference Munsters and Saris20). A recent meta-analysis found that EF was positively associated with reductions in percentage of fat mass, as well as increases in fat-free mass. However, these associations resulted from a single study, and caution should be taken when interpreting the results(Reference Schoenfeld, Aragon and Krieger39). In addition, when establishing EF groups in the present study, women who reported ≥ 4·67 daily eating episodes had lower anthropometric values before the first cycle and after the intermediate cycle of CT. Similarly, Kim et al. (Reference Kim, Yang and Park18) found that Korean adults with an EF ≥ 5 daily eating episodes compared with <3 episodes had a lower BMI, WC and body fat percentage. However, the literature still presents contradictory results for the ideal number of daily eating episodes and their benefits in nutritional status(Reference Yildiran22–Reference Kahleova, Lloren and Mashchak23), providing evidence for the necessity for further studies relating to these variables.
A few mechanisms have already been suggested in an attempt to explain the possible relationship between EF and nutritional status. LeBlanc et al. (Reference LeBlanc, Mercier and Nadeau40) inferred that the increase in body thermogenesis is related to the performance of more eating episodes during the day. Also, a recent review highlights the influence of the intraindividual variability of EF (regular v. variable) on thermogenesis, as well as diet composition and circadian rhythm(Reference Vázquez Cisneros, López-Espinoza and Martínez Moreno41). Another assumption is that the increased EF could increase satiety by controlling the appetite and suppressing ghrelin (especially in individuals who have breakfast)(Reference Jakubowicz, Barnea and Wainstein42,Reference Leidy and Campbell43) , but these controversial results(Reference Aljuraiban, Chan and Oude Griep44,Reference Perrigue, Drewnowski and Wang45) indicate that the factors involved in this relationship are complex.
Studies reporting the relationship between nutritional status and EF, specifically in patients with BC at different times of CT, were not found. However, it is known that during CT, weight gain is commonly observed(Reference Kwok, Palermo and Boltong46) and may persist for 2–3 years after diagnosis(Reference Saquib, Flatt and Natarajan47). In the present study, no associations between EF and anthropometric variables were observed at T2. Other variables may be involved in this process, such as decreased physical fitness at the end of CT (compared with before treatment) in women with BC(Reference Hurria, Soto-Perez-de-Celis and Allred48), fluid retention due to the use of steroids(Reference Wang, Cai and Wang49) and psychological factors such as anxiety and depression(Reference Lyon, Kelly and Walter50). In addition, Marinho et al. (Reference Marinho, Custódio and Ferreira7) did not analyse the differences between the reasons to have or not to have an eating episode in women with BC at different times of CT. However, meal enjoyment was significantly lower after the intermediate cycle when compared with before the first and after the last cycle of CT. On the other hand, body weight, BMI and WC were significantly higher after the intermediate cycle, compared with before the first cycle of treatment(Reference Marinho, Custódio and Ferreira7). Considering that meal enjoyment is related to EF and this, in turn, to the nutritional status, it becomes relevant to review and complement dietary guidelines for the different times of CT, therefore contributing to the best prognosis of the disease(Reference Azrad and Demark-Wahnefried26).
In the present study, we observed a positive association between EF and diet quality for BHEI-R food groups such as Whole Fruit, Total Vegetables and Dark Green and Orange Vegetables and Legumes at the three times of CT. Additionally, at T1 and T2, EF was also positively associated with the Total Fruit and BHEI-R Total score. Similarly in a study with healthy Brazilian women, the highest number of meals was positively associated with the consumption of fruit and vegetables(Reference Pereira, Vieira and Horta51). In healthy American adults, positive associations between EF and the Healthy Eating Index (2010) were also verified for most food groups, such as Whole Fruit, Total Fruit, Whole Grains, Dairy, Sea Food and Vegetable Proteins, Na and the Total Index score(Reference Zhu and Hollis10). These results corroborate with the positive impact of greater dietary eating episodes on health in general, since it contributes to the improvement of the whole diet and the increased consumption of healthy food with high micronutrient content in main meals and snacks, such as fruit(Reference Crory and Campbell52). Also, other clinic and therapeutic factors possibly associated with diet quality in BC patients should be explored in future research.
The recommendations of the ideal number of daily eating episodes for cancer patients are not available yet. However, there are medical indications for frequent and small meals throughout the day to relieve transient symptoms of a variety of diseases, including cancer(Reference Dashti and Mogensen53). In addition, the American Dietetics Association recommends the daily energetic distribution in four to five meals (including breakfast) in order to avoid the development of diseases(Reference Seagle, Strain and Makris54). In our study, eating episodes above 4·67 (in T0 and T1) and 4·33 (in T2) per d showed positive differences in diet quality. In another study with healthy Brazilian women, it was found that having <5 eating episodes per d was more common among women who had inadequate EF of fruit and vegetable(Reference Pereira, Vieira and Horta51). In other populations, such as healthy adolescents, consumption of ≥7·5 to <9·5 or ≥9·5 eating episodes per d resulted, respectively, in a diet quality of 4·6 and 4·9 points higher compared with those who consumed one to five episodes. However, when only eating episodes with >50 kcal (>209·2 kJ) were counted, no significant difference was found(Reference Llauradó, Albar and Giralt55).
It is emphasised that a higher daily EF, among another practices, such as lower energetic intake in later periods of the day and prolonged nightly fasting may reduce systemic inflammation in adult women, therefore reducing the risk of BC(Reference Marinac, Sears and Natarajan13). Furthermore, maintaining diet quality and anthropometric parameters within the recommendations during treatment are associated with a better prognosis of BC(Reference Sun, Bao and Liu25,Reference Azrad and Demark-Wahnefried26) . A prospective study that followed 2295 postmenopausal women with BC for 12 years showed that those women whose Health Eating Index (2010) score decreased ≥ 15 % after the diagnosis had a greater risk of death from BC when compared with those who maintained a relatively stable diet quality (around 14·9 % score variation), even with the BMI adjustments(Reference Sun, Bao and Liu25). In addition, Schavartsman et al. (Reference Schavartsman, Gutierrez-Barrera and Song24) verified that an increase of 0·5 kg/m2 on BMI was enough to raise the risk of locoregional recurrence in patients with early-stage BC. Therefore, a better understanding of the potential effects of EF on general health in women with BC, especially during treatments such as CT, may be of importance to implement future public health strategies that deal with better prognosis of BC and other high incident diseases.
Possible limitations of the present study must be considered. Dietetic and daily EF were collected retrospectively by a self-reported method, which may have led to underestimation of the dietary intake due to memory bias inherent in this method. In addition, recent studies also suggest the importance of meal timing of eating episodes on metabolic health and body weight regulation(Reference McHill, Phillips and Czeisler56,Reference Leung, Huggins and Bonham57) . However, due to insufficient data on meal timing collected in the 24-h recalls, analyses including these data could not be performed. In order to minimise this limitation, nine 24HR were applied to each individual, three at each of the evaluating times, in order to reflect the actual consumption and EF. Also, more accurate methods to estimate total body fat (such as dual-emission X-ray absorptiometry, X-ray computerised tomography or bioelectrical impedance) were not used, even though all the antropometric measurements were performed by experienced professionals. As a strength, we highlight, to the best of our knowledge, that this is the first prospective study that evaluated the importance of EF in terms of diet quality and nutritional status in women with BC during CT.
Conclusion
The results of the present study showed that a higher daily EF was associated with better diet quality in women with BC undergoing CT, especially in the intermediate and last cycles, with more BHEI-R dietary groups with significant associations. In contrast, an inverse association was observed between EF and anthropometric parameters before the first cycle of CT. Considering that the adoption of a better quality diet and an adequate nutritional status are related to a better prognosis for BC patients and the reduction of co-morbidities and that CT can interfere negatively with these factors, EF is a modifiable and relevant dietetic factor for study. Longitudinal studies and randomised controlled trials need to be conducted in this area for greater clarification regarding the possible benefits of an increase in EF, especially during important treatments such as CT in women with BC.
Acknowledgements
The authors thank the volunteer women of the present study.
This work was supported by Conselho Nacional de Desenvolvimento Científico e Tecnológico, Brasil, (CNPq); Fundação de Amparo à Pesquisa do Estado de Minas Gerais (FAPEMIG) and the Coordenação de Aperfeiçoamento de Pessoal de Nível Superior (CAPES). The funders had no role in study design, data collection and analysis, decision to publish or preparation of the manuscript.
M. T. M. L., T. C. M. and Y. C. P. M. performed the statistical analyses and wrote the article; I. D. D. C., E. C. M. and I. B. F. collected the data, compiled the database, performed the statistical analyses and revised the article; C. E. P., C. A. P. and Y. C. P. M. were responsible for the supervision of all stages of the study, statistical analyses and article revision.
The authors declare that there are no conflicts of interest.


