


Introduction
Farmland bird species represent a large proportion of European avifauna, and the populations of several species have suffered a dramatic decline in recent decades, especially in Western Europe (Donald et al. Reference Donald, Green and Heath2001, Reference Donald, Pisano, Rayment and Pain2002). The causes of this decline have been identified mostly in the changes of agricultural practices, such as heavy mechanization, increased fertilizer inputs, and a temporal shift in cereal sowing from spring to autumn. In addition, the intensification of agricultural practices and the consequent loss of landscape heterogeneity, determined by the destruction of hedgerows, shrubs, tree patches, and other natural areas, is also a major threat (Fuller et al. Reference Fuller, Gregory, Gibbons, Marchant, Wilson, Baillie and Carter1995, Donald et al. Reference Donald, Pisano, Rayment and Pain2002, Benton et al. Reference Benton, Vickery and Wilson2003, Newton Reference Newton2004). These changes have led to both the reduction of refuge and breeding sites and to a decrease in invertebrate prey, prompted as well by the increase in biocide use (Wilson et al. Reference Wilson, Morris, Arroyo and Clark1999, Benton et al. Reference Benton, Bryant, Cole and Crick2002, Boatman et al. Reference Boatman, Brickle, Hart, Milsom, Morris, Murray, Murray and Robertson2004, Brambilla Reference Brambilla2019). A further cause of farmland species decline is represented by land abandonment (Donald et al. Reference Donald, Pisano, Rayment and Pain2002, Suárez-Seone et al. Reference Suárez-Seone, Osborne and Baundry2002, Rippa et al. Reference Rippa, Maselli, Soppelsa and Fulgione2011), which is now threatening important farmland bird populations in mountain areas (Brambilla et al. Reference Brambilla, Casale, Bergero, Bogliani, Crovetto, Falco, Roati and Negri2010). To make safeguarding agro-ecosystems and their dependent species possible, a set of agri-environmental policies (AEPs) has been initiated. Targeting is therefore required, to direct agri-environment funding to those areas and actions which will provide the greatest environmental results (Webster and Felton Reference Webster and Felton1993, Thompson et al. Reference Thompson, Larcom and Lee1999). Consequently, knowledge of the distribution and characterization of the selected species’ habitats is essential to achieving this goal and, hence, species’ conservation and management planning.
The European Turtle Dove Streptopelia turtur (hereafter Turtle Dove) is a long-distance migratory farmland bird. Typically associated with woodland edges, it inhabits a wide variety of lowland habitats, with a mosaic of open ground and wooded or shrubby areas (Cramp Reference Cramp1985, Gibbs et al. Reference Gibbs, Barnes and Cox2001). However, in the absence of natural arboreal vegetation, as in intensively cultivated agroecosystems, the Turtle Dove also nests in orchards, i.e. olive and citrus groves, as happens in southern Italy (Chiatante and Meriggi Reference Chiatante and Meriggi2016), Greece (Solomou and Sfougaris Reference Solomou and Sfougaris2015), and North Africa (Hanane and Baamal Reference Hanane and Baamal2011, Yahiaoui et al. Reference Yahiaoui, Arab, Belhamra, Browne, Boutin and Moali2014). The Turtle Dove has undergone a rapid decline in much of its European range, where it has decreased by 30–49% in 16 years (BirdLife International 2017, PECBMS 2019), as highlighted also by the recent international Action Plan for the species (Fisher et al. Reference Fisher, Ashpole, Scallan, Proud and Carboneras2018). In some countries the species has suffered a severe decline, greater than 80%, as in Belgium, Finland, Netherlands, European Russia, and United Kingdom (BirdLife International 2015, 2017). For this reason it is listed as ‘Vulnerable’ (BirdLife International 2015, 2017). The intensification of agriculture, including the transformation of the landscape, the simplification of crop rotation, the removal of hedgerows and other non-farmed features (e.g. ponds, woodlands, etc.), as well as the intensive use of fertilizers and pesticides, represent the main threats to the species. These changes can both reduce the food supply and nesting habitat availability (Browne and Aebischer Reference Browne and Aebischer2004, BirdLife International 2017, Fisher et al. Reference Fisher, Ashpole, Scallan, Proud and Carboneras2018). Overexploitation and illegal hunting, especially during migration and in the wintering grounds, are also significant threats (BirdLife International 2017, Fisher et al. Reference Fisher, Ashpole, Scallan, Proud and Carboneras2018). Other threats include diseases, severe droughts in the Sahel, and the loss of suitable stop-over sites along migration routes (BirdLife International 2017, Fisher et al. Reference Fisher, Ashpole, Scallan, Proud and Carboneras2018). On the other hand, climate change seems to be beneficial, at least in the northern part of its range, because of the expansion of suitable breeding areas (Harrison et al. Reference Harrison, Vanhinsbergh, Fuller and Berry2003, Marx and Quillfeldt Reference Marx and Quillfeldt2018), even if wintering grounds can lead to an abnormally high mortality rate because of increasing drought (Fisher et al. Reference Fisher, Ashpole, Scallan, Proud and Carboneras2018).
In the light of this context, the main aims of this research were to estimate the population density of the Turtle Dove and to define its habitat requirements at home range scale in an intensively cultivated agroecosystem in northern Italy. We expected that the Turtle Dove would select sites with high woodland cover and hedgerow density, used likely for nesting. Moreover, we expected a negative effect of intensively cultivated crops, i.e. paddyfields and maize. These hypotheses derived from the knowledge of the general habits and ecology of the species (Cramp Reference Cramp1985, Gibbs et al. Reference Gibbs, Barnes and Cox2001). There are many reasons that make this research relevant. Considering the strong decline of its populations and its conservation importance, it is vital to carry out research concerning the ecology of this species in Europe, especially because it holds 25–49% of the species’ global population (BirdLife International 2017). Indeed, action 7.4.1 “Improve knowledge of turtle-dove habitat selection and dietary needs” of the International Action Plan for the species is considered essential (Fisher et al. Reference Fisher, Ashpole, Scallan, Proud and Carboneras2018). This is true particularly in Priority Intervention Areas for the species’ conservation, as is most of the Italian territory (PECBMS 2019). In Italy, where 150,000–300,000 pairs are estimated (5% of European population), the population trend is unknown both in the short and in the long-term (BirdLife International 2017) and the Turtle Dove is listed as SPEC1, a European species of global conservation concern (BirdLife International 2017), with an unfavourable conservation status (Gustin et al. Reference Gustin, Brambilla and Celada2016). However, to our knowledge there is no other research on this species in Italy, and the few data available are derived from the grey literature or studies not focused on this species (Brichetti and Fracasso Reference Brichetti and Fracasso2006). Furthermore, the Turtle Dove being a farmland species, our findings might help also to better understand the ecology of farmland birds in Italy (Brambilla Reference Brambilla2019) and, more generally, in Europe, inasmuch they are decreasing sharply as previously stated.
Materials and methods
Study area
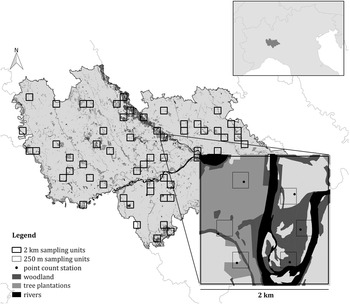
The present study was carried out in the western Po Plain (north-western Italy), in an area of about 2,900 km2 (45°11’N, 9°05’E) (Figure 1). The Ticino River crosses the study area from north to south, flowing into the Po River that runs from west to east. The Sesia River and the Lambro River flow along the western and the eastern boundaries of the study area, respectively. The landscape is characterized by cultivated areas, especially paddy fields (39.4%), other annual crops (mainly maize, soybean, oil-seed rape, winter wheat, and alfalfa) (29.1%), and tree plantations (6.8%). Broad-leaved forests and built-up areas represent 4.9% and 10.3% of the total area, respectively. The data used to measure the land use cover were obtained from the regional land use map “DUSAF 5.0” (ERSAF 2015) and from the regional forest map “Carta dei tipi forestali reali della Lombardia” (ERSAF 2012), and processed by the software Quantum GIS v.3.2.3 ‘Bonn’. Continuous forests (composed mainly of Quercus robur, Carpinus betulus, willow Salix sp., poplar Poplar sp., and the invasive Robinia pseudoacacia) are located along the Ticino River and in the southern part of the study area, near the Apennine slopes, whereas remnants of broad-leaved forest fragments are scattered in the cultivated area (95% of which are smaller than 10 ha). Tree plantations mainly consist of monospecific plantations of hybrid poplar species, but also of reforestations and short rotation coppices (SRCs). Due to its particular geographical location, this area is difficult to relate to other European lowlands. Even though the Po Plain has a subcontinental climate, it is separated from the rest of continental Europe by the Alps, which could act as a zoogeographical barrier (Bianco Reference Bianco1990, Hermansen et al. Reference Hermansen, Saether, Elgvin, Borge, Hjelle and Saetre2011). Furthermore, even if it is attributable to the Mediterranean Basin, the climate, land use, and vegetation in the Po Plain differ from the rest of the Mediterranean area (Mikusiński and Angelstam Reference Mikusiński and Angelstam1997, Capotorti et al. Reference Capotorti, Guida, Siervo, Smiraglia and Blasi2012).
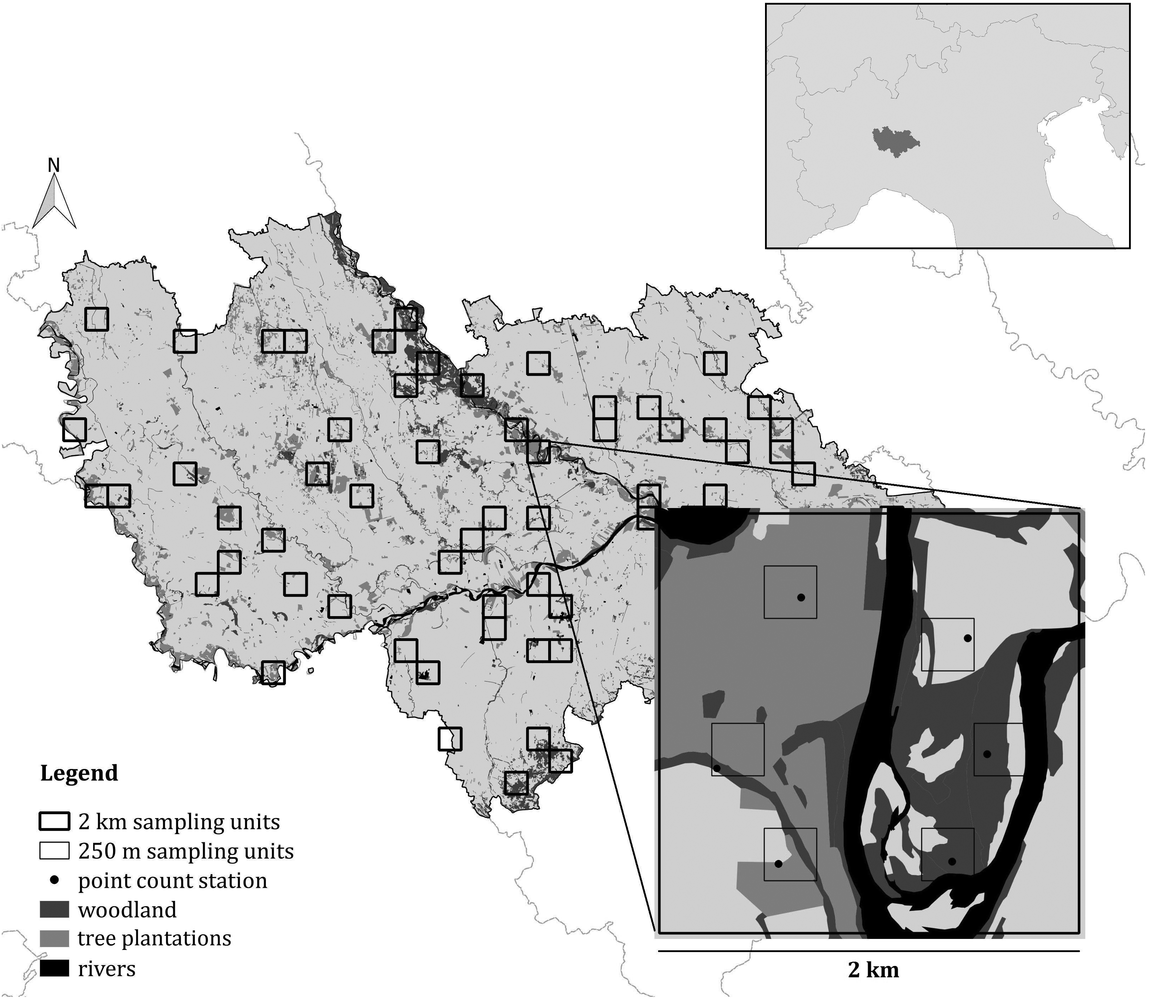
Figure 1. The survey design used in the study. Both the 2 km and the 250 m sampling units are shown, as well as the point count stations. The location of the study area in northern Italy is shown in the insert.
Survey design and data collection
In order to obtain a representative sample in this large and heterogeneous study area, a stratified cluster sampling design was performed (Krebs Reference Krebs1999, Sutherland et al. Reference Sutherland, Newton and Green2004, Sutherland Reference Sutherland2006, Barabesi and Fattorini Reference Barabesi and Fattorini2013). According to this approach, the area was firstly divided in Landscape Units (LUs), i.e. homogeneous portions of the area in terms of habitat or ecological characteristics likely to induce systematic variations in population density (Sutherland Reference Sutherland2006). To this aim, a 2 × 2 km grid of sampling cells was superimposed on the study area and each cell was assigned to a LU, based on its characteristics. More details on LU definition are reported in Appendix S1 in the online Supplementary Materials. Data were collected in 62 randomly selected sampling cells (approximatively 10% of the study area). The number of sampling cells selected for each LU was proportional to the LU extent, in such a way that all the landscape characteristics of the study area were represented and each stratum was investigated with an effort proportional to its extent (Krebs Reference Krebs1999). Within each selected sampling cell six point-counts were carried out (Bibby et al. Reference Bibby, Burgess, Hill and Mustoe2000, Sutherland Reference Sutherland2006) during the breeding season 2015, between May and early June, the peak of the singing and breeding activity (Cramp Reference Cramp1985, Brichetti and Fracasso Reference Brichetti and Fracasso2006). Data on species occurrence were therefore collected in 372 point-counts. The selection of the six point counts inside the 2-km cell was carried out by multi-level sampling (Sutherland Reference Sutherland2006), subdividing the 2-km cells into cells of 250 × 250 m and randomly selecting six of them (Figure 1). Using this second grid, it was possible to obtain estimates that are more precise. Each point, placed randomly inside the cells, was surveyed once from dawn to 10:30, and the count lasted for 10 minutes (Chamberlain and Rolando Reference Chamberlain and Rolando2014); overall, data collection took place for 32 effective days. During the fieldwork, we measured the exact distance from the observer to the birds with a laser rangefinder (Leica Rangemaster 900; Leica, Solms, Germany). When we did not see a calling bird, we mapped its approximate position on aerial photographs (1:5,000 scale) based on the likely attenuation and direction of its vocalization. We then measured the distance from observer to the position of each calling bird using the software QGIS v.3.2.3 ‘Bonn’.
Density estimation
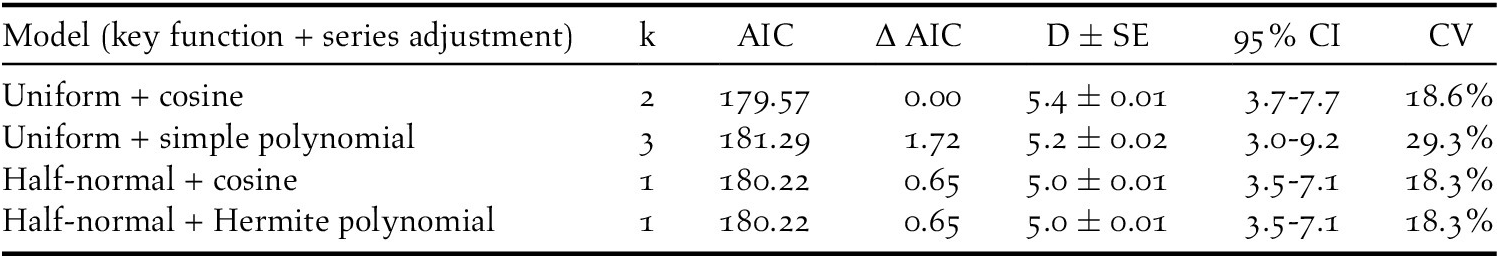
The density of the species was estimated through the distance sampling method using the software Distance 7.2 (Buckland et al. Reference Buckland, Anderson, Burnham and Laake1993, Reference Buckland, Anderson, Burnham, Laake, Borchers and Thomas2001, Thomas et al. Reference Thomas, Buckland, Rexstad, Laake, Strindberg, Hedley, Bishop, Marques and Burnham2010). For density estimation, we used only the first detection of each located individual or pair, as suggested by Buckland et al. (Reference Buckland, Anderson, Burnham, Laake, Borchers and Thomas2001). After a visual inspection of distance distribution, we truncated 10% of the largest observations as suggested by Buckland et al. (Reference Buckland, Anderson, Burnham and Laake1993) and transformed the distance data into equal intervals of 60 m. We chose these intervals because they were the best for assuring a good shape of the distance data, inasmuch as shape criterion is one of the main assumption of distance sampling (Buckland et al. Reference Buckland, Anderson, Burnham and Laake1993). We tested various combinations of key functions (uniform, half-normal) and series adjustments (cosine, simple polynomial, Hermite polynomial) (Buckland et al. Reference Buckland, Anderson, Burnham and Laake1993) and we used the Akaike Information Criterion (AIC) (Akaike Reference Akaike, Petrov and Csaki1973) to evaluate the fit of each model (Buckland et al. Reference Buckland, Anderson, Burnham and Laake1993, Thomas et al. Reference Thomas, Buckland, Rexstad, Laake, Strindberg, Hedley, Bishop, Marques and Burnham2010). Among the models with the lowest AIC values, the one that appeared most suitable based on a visual examination of histograms and the results of χ2 goodness-of-fit tests was selected (Buckland et al. Reference Buckland, Anderson, Burnham, Laake, Borchers and Thomas2001, Buckland Reference Buckland2006, Thomas et al. Reference Thomas, Buckland, Rexstad, Laake, Strindberg, Hedley, Bishop, Marques and Burnham2010). Furthermore, the average probability of detection was estimated, and the effective detection radius (EDR) was defined. For each estimate the percentage coefficient of variation (CV) and the 95% confidence intervals (CI) were calculated.
Habitat suitability
The habitat requirements of the Turtle Dove were evaluated following a presence vs. availability approach (Boyce et al. Reference Boyce, Vernier, Nielsen and Schmiegelow2002, Manly et al. Reference Manly, McDonald, Thomas, Mcdonald and Erickson2002). The environmental variables (Table 1) were measured at the home-range scale (Manly et al. Reference Manly, McDonald, Thomas, Mcdonald and Erickson2002, Morrison et al. Reference Morrison, Marcot and Mannan2006) at presence sites and subsequently compared with those of an equal number of availability sites which were randomly selected in the study area without any constraints (Boyce et al. Reference Boyce, Vernier, Nielsen and Schmiegelow2002, Manly et al. Reference Manly, McDonald, Thomas, Mcdonald and Erickson2002, Keating and Cherry Reference Keating and Cherry2004). By considering the relevance of taking into account the spatial ecology of the species (Brennan et al. Reference Brennan, Bender, Contreras and Fahrig2002, Manly et al. Reference Manly, McDonald, Thomas, Mcdonald and Erickson2002), presence/availability sites corresponded to cells whose extent was defined based on the home range size of the species during breeding, as suggested by the available literature. Specifically, the home range of the species is equal to 1.91–3.08 ha (Browne and Aebischer Reference Browne and Aebischer2004), hence, considering an average of about 2.5 ha, a grid was generated with hexagonal cells with this area (Caprio et al. Reference Caprio, Chamberlain, Isaia and Rolando2011, Boan et al. Reference Boan, Malcolm and McLaren2014). Subsequently, in order to investigate the relationships between the environmental variables and the Turtle Dove, we tested for significant difference between presence and random sites using the non-parametric Mann-Whitney U test (Legendre and Legendre Reference Legendre and Legendre1998). Then, a Resource Selection Probability Function was formulated (Boyce et al. Reference Boyce, Vernier, Nielsen and Schmiegelow2002, Manly et al. Reference Manly, McDonald, Thomas, Mcdonald and Erickson2002) performing a generalized linear model with a binomial error distribution (Keating and Cherry Reference Keating and Cherry2004, Rushton et al. Reference Rushton, Ormerod and Kerby2004). In particular, a priori sets of models were first built using all the combination of the environmental variables that seemed to affect species occurrence. For each model the second-order Akaike Information Criterion (AICc) was calculated and the model with the lower AICc was selected as the best (Anderson and Burnham Reference Anderson and Burnham2002, Burnham and Anderson Reference Burnham and Anderson2002). However, considering that models with Δ AICc ≤ 2 give substantial support (Burnham and Anderson Reference Burnham and Anderson2002), we showed and discussed them also. For the analysis, all variables considered were standardized by normalization, that is, each variable had a mean of zero and a standard deviation of one (Quinn and Keough Reference Quinn and Keough2002, Zuur et al. Reference Zuur, Ieno and Smith2007). The model’s ability to distinguish between occupied and available sites was tested by means of the area under the curve (AUC) of the Receiver Operating Characteristic plot (ROC curve) (Pearce and Ferrier Reference Pearce and Ferrier2000, Fawcett Reference Fawcett2006). Moreover, we tested both the residuals’ normality by the Kolmogorov-Smirnov test (Legendre and Legendre Reference Legendre and Legendre1998) and the residuals’ spatial autocorrelation by the Moran I test (Zuur et al. Reference Zuur, Ieno and Smith2007, Bivand et al. Reference Bivand, Pebesma and Gómez-Rubio2008). We used the Variance Inflation Factor (VIF) with a threshold of 3 to exclude variables’ collinearity (Fox and Monette Reference Fox and Monette1992, Zuur et al. Reference Zuur, Ieno and Elphick2010). The explained deviance D2 was used as a measure of the variance explained by the model (Crawley Reference Crawley1993, Zuur et al. Reference Zuur, Ieno and Smith2007).
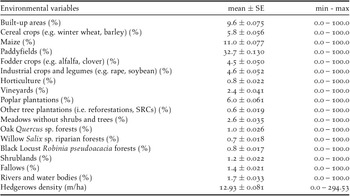
Table 1. Environmental variables used to investigate the habitat selection of the European Turtle Dove in northern Italy. Mean (± SE), minimum, and maximum values of each variables in the hexagonal grid superimposed on the study area were reported.
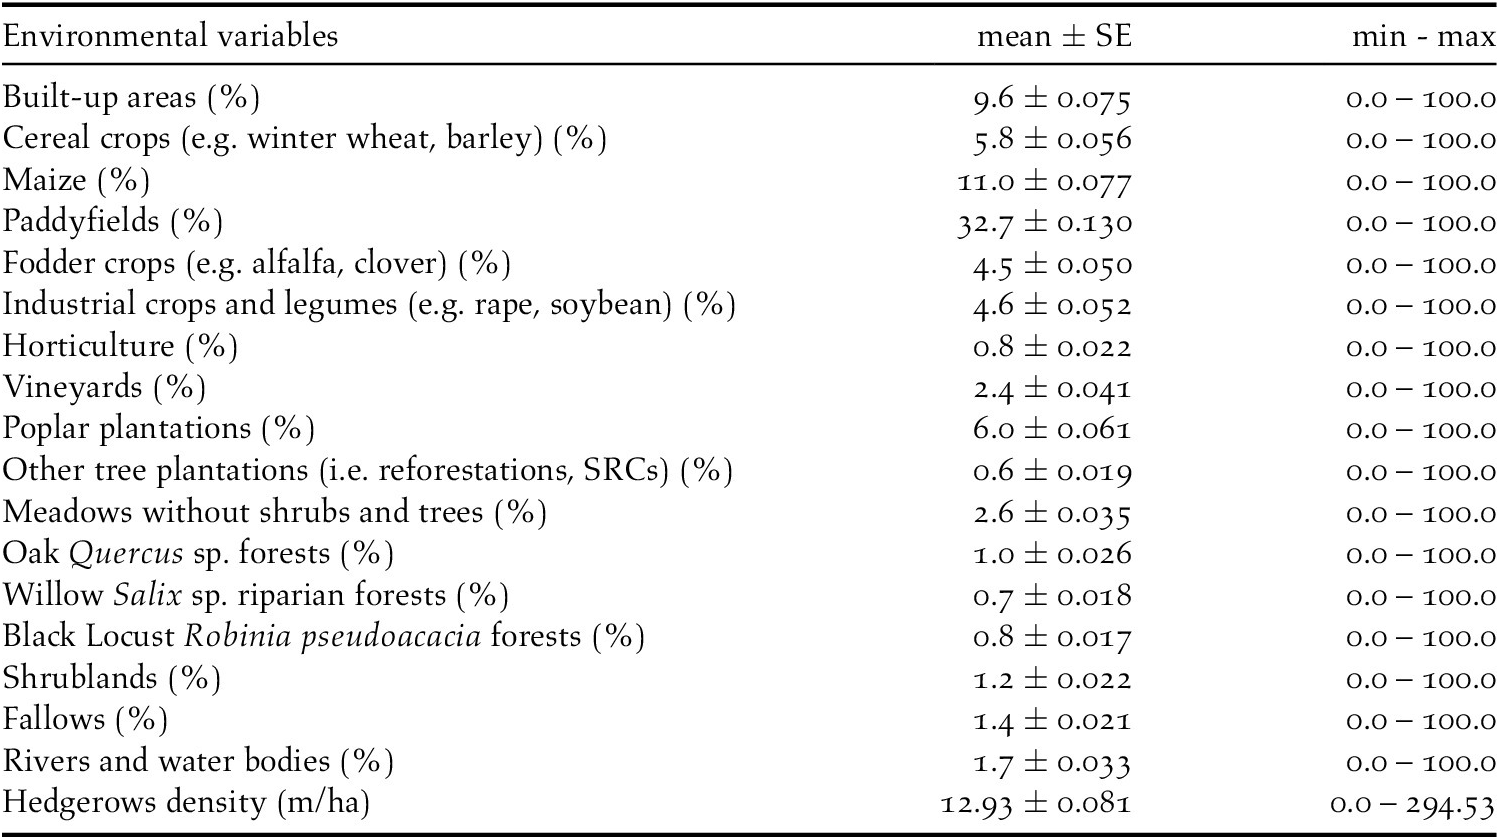
Data used to measure the environmental variables were obtained from the regional land use map “DUSAF 5.0” (ERSAF 2015) and from the regional forest map “Carta dei tipi forestali reali della Lombardia” (ERSAF 2012) and processed by the software Quantum GIS v.3.2.3 ‘Bonn’. All the analyses were performed using the statistical software R v.3.3.2 (R Core Team 2019) and the packages MuMIn (Tillé and Matei Reference Tillé and Matei2016), car (Fox and Weisberg Reference Fox and Weisberg2011), and ROCR (Sing et al. Reference Sing, Sander, Beerenwinkel and Lengauer2007).
Results
Density estimation
During fieldwork, 76 observations of Turtle Dove were collected, at an average distance of 113 m (SE = 9.0, min = 0 m, max = 363 m), but six of them were removed from the analysis because of the right truncation. The best detection probability function obtained was the uniform + cosine with two parameters (AIC = 179.57, χ2 = 0.389, df = 1.0, P = 0.533) (Table 2). This gave an EDR of 107 m and the average probability of detection was estimated to be 0.20 (CV = 14.0%; 95% CI = 0.15-0.26). Single birds or pairs were usually observed, with an average of 1.04 ± 0.01 (SE) ind/group. There was no correlation between group size and distances of detection (r = 0.181, df = 68, P = 0.934). The density of Turtle Doves estimated was 5.0 pairs/km2 (SE = 0.01, min = 3.7, max = 7.7, CV = 18.6%) (Figure 2).
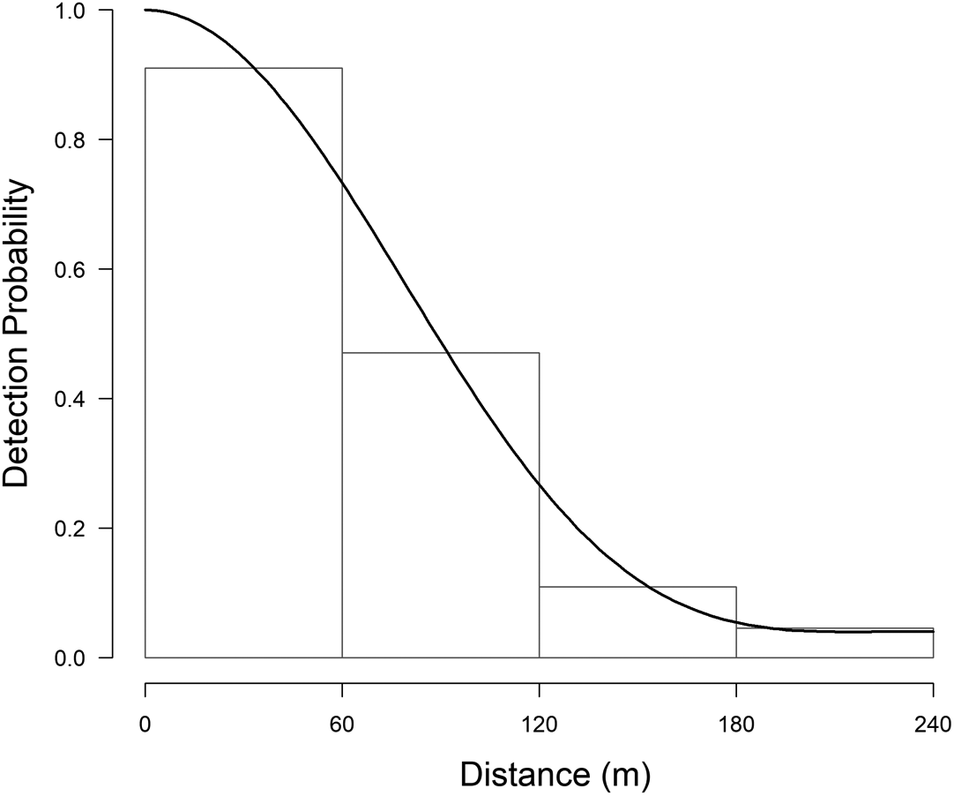
Figure 2. Histograms of the detection functions calculated to estimate the density of the European Turtle Dove. On the x-axis the detection distance in meters, on the y-axis the detection probability (from 0 to 1).
Table 2. Models obtained by distance sampling for the density estimation of European Turtle Dove in northern Italy. The number of parameters (k), AIC values, densities estimations (D), and their standard errors (SE), 95% confidence intervals (95% CI) and coefficients of variation (CV) were showed. Densities are shown as pairs/km2.
Habitat suitability
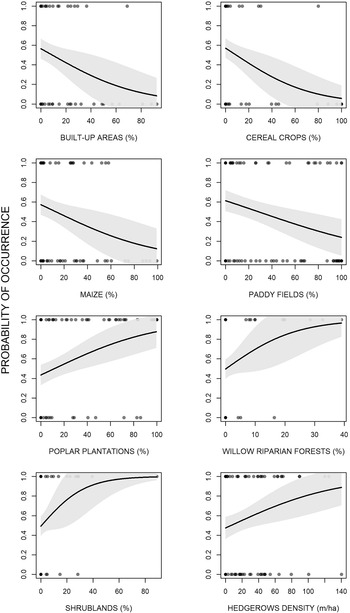
The analyses showed that there were some differences between presence and availability sites (Table 3). In particular, in the presence sites there was a greater cover of poplar plantations and other tree plantations, oak forests, riparian willow forests, and shrublands, than in the availability sites. In contrast, there was also a lesser cover of maize and paddy fields. The best model showed that density of poplar plantations, riparian willow forests, shrublands, and hedgerows positively affected the presence of the Turtle Dove (Figure 3, Table 4). On the contrary, built-up areas, cereal crops, maize, and paddy fields negatively influenced the presence of the species. The set of the best models (ESM Table S1) showed that another three variables positively affected the presence of the Turtle Dove, though they were less important. Specifically, other tree plantations, oak forests, and Robinia pseudoacacia forests. The ability of the best model to distinguish between occupied and unoccupied sites was good, with an area under the ROC curve equal to 0.832 (P < 0.001). The model residuals were normally distributed (D = 0.053, P = 0.726) and did not show any spatial correlation (Moran test, I = 0.484, P = 0.314). The VIF revealed no collinearity among predictors (Table 4) and the explained deviance D2 was equal to 26.4%. The study area showed an average predicted probability of 0.49 ± 0.008 (SE) (min. 0.05, max 1.0) (Figure S2).
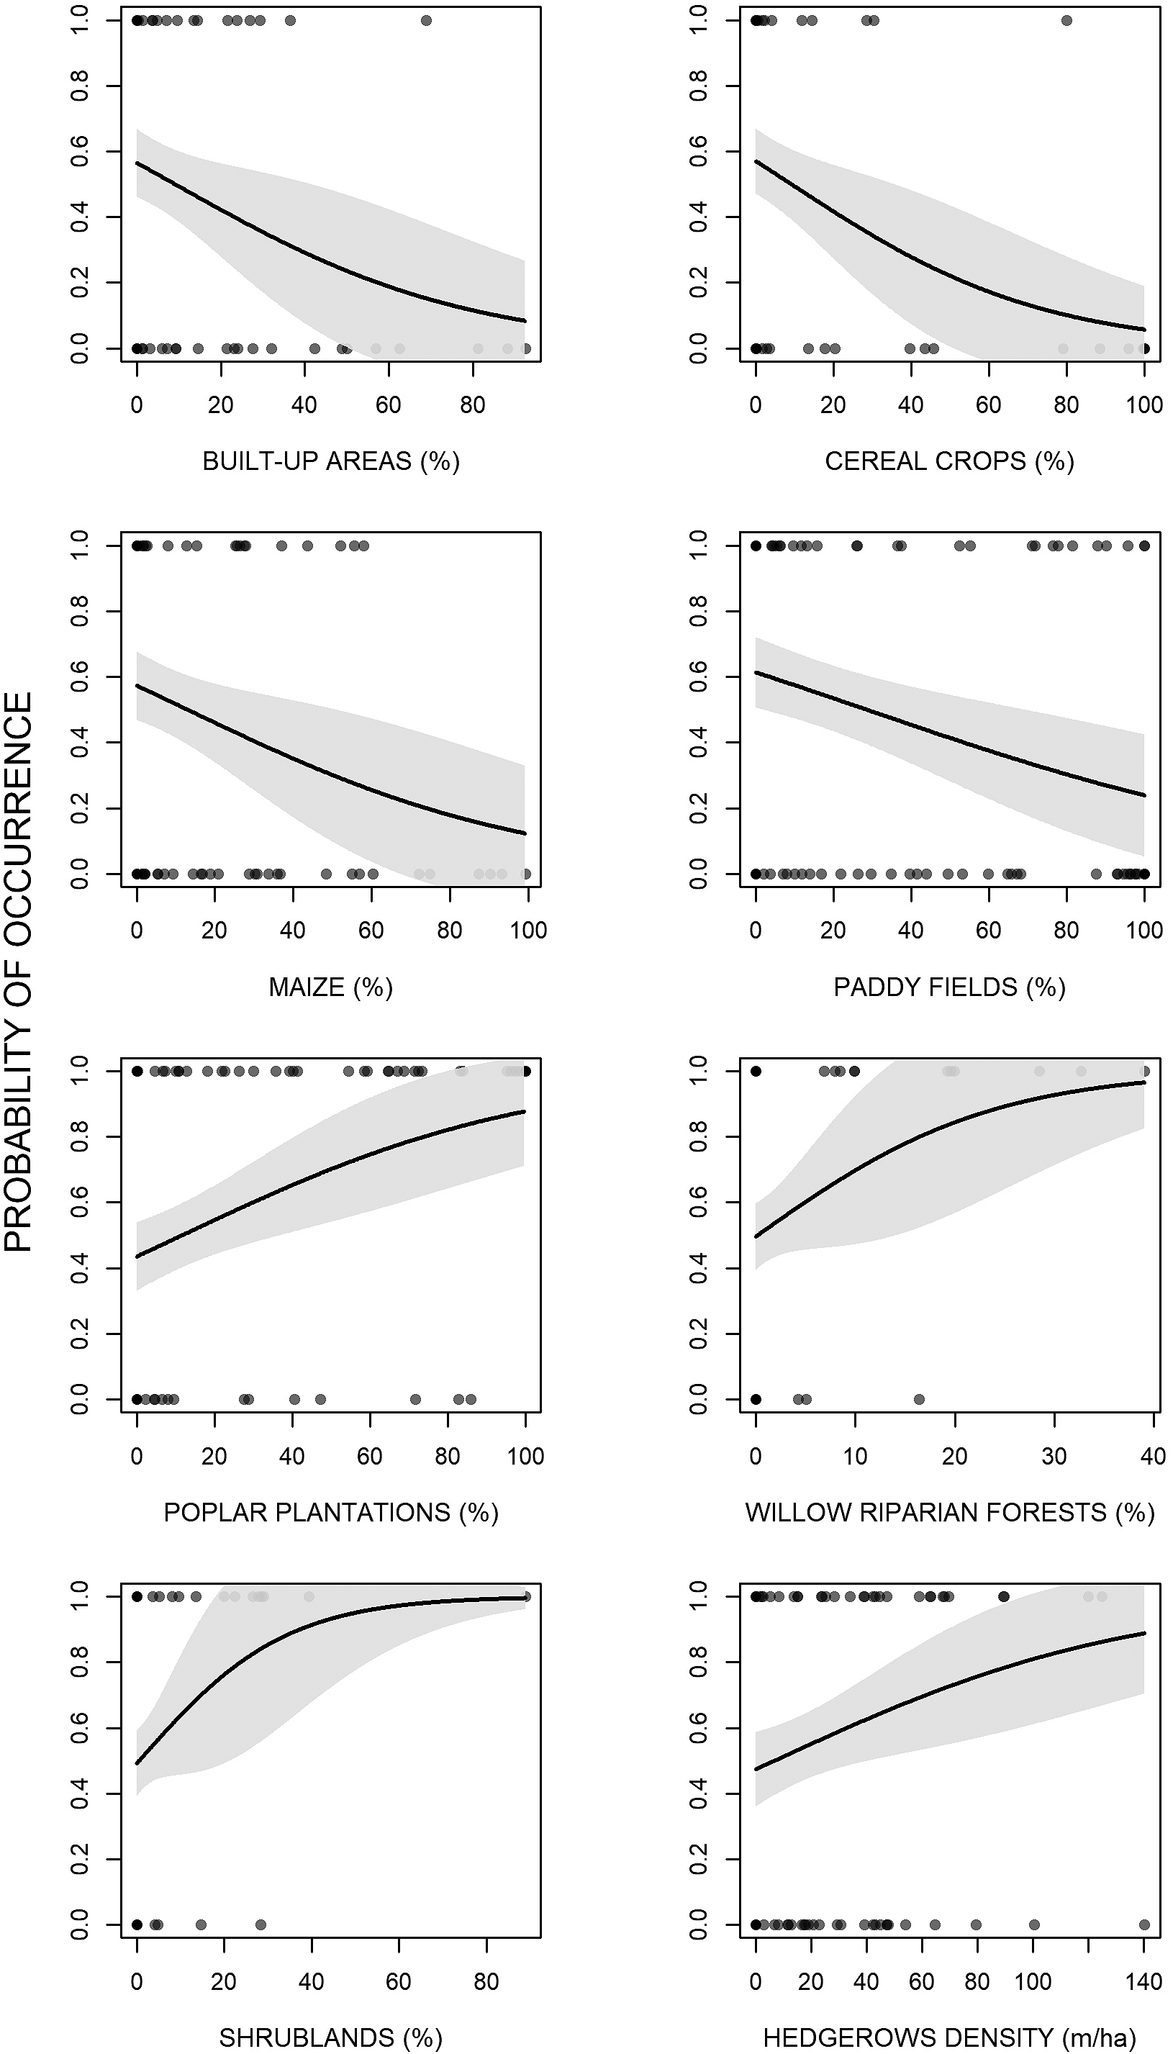
Figure 3. Effects of the environmental variables on the occurrence of the European Turtle Dove in northern Italy.
Table 3. Mean values (± SE) of the environmental variables measured in the presence and in the random sites. We highlighted in bold the variables for which we found significant differences (P < 0.05) by the non-parametric Mann-Whitney U test.
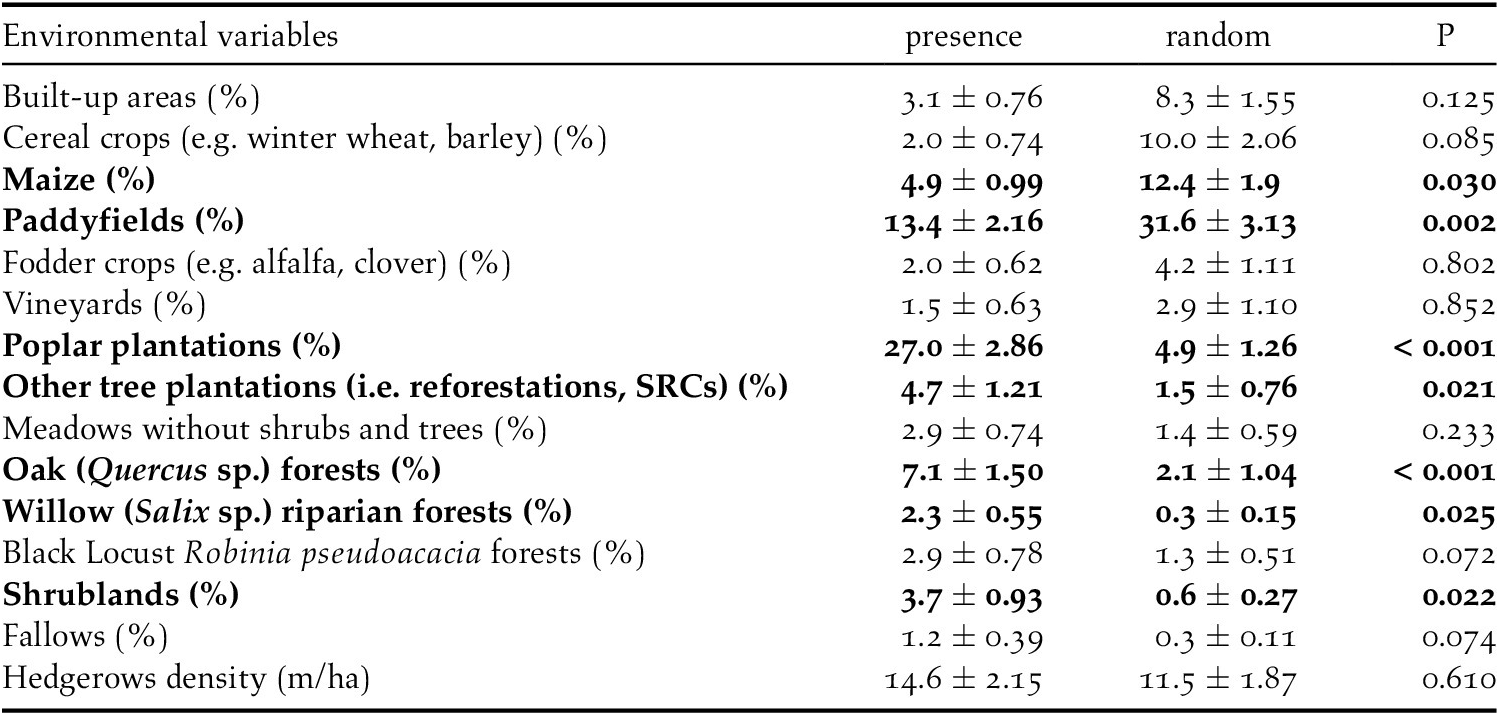
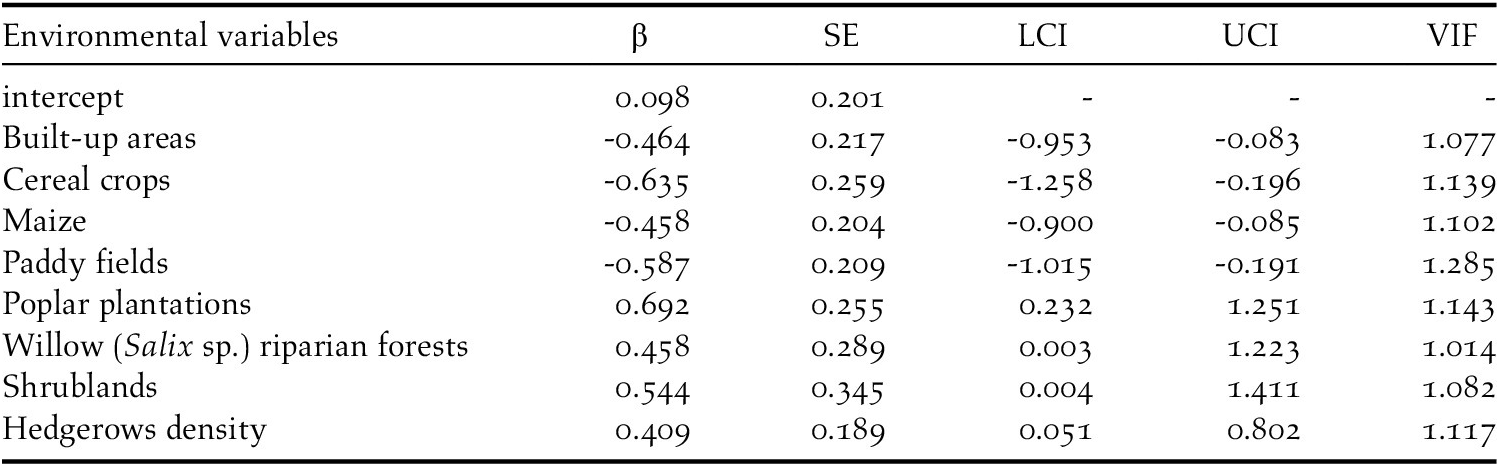
Table 4. The best model explained the habitat requirement of the European Turtle Dove in northern Italy. The estimate (β), the standard error (SE), the lower (LCI) and upper (UCI) 95% confidence intervals, and the Variance Inflation Factors (VIF) were shown.
Discussion
Our analyses showed that breeding densities of the Turtle Dove in the agroecosystem investigated are between 3.7 and 7.7 pairs/km2, with an average of 5.0 pairs/km2. These densities are similar or slightly higher than other densities observed in northern Italy, where 1–5 pairs/km2 were estimated (Brichetti and Fracasso Reference Brichetti and Fracasso2006). Unfortunately, due to the small sample size, we could not estimate densities for each land use type, therefore our estimate is related to the whole study area. However, in general the densities are lower in farmlands than in woodlands (Fisher et al. Reference Fisher, Ashpole, Scallan, Proud and Carboneras2018). Indeed, in Spanish farmlands, 5 pairs/km2 were estimated (Sáenz De Buruaga et al. Reference Sáenz De Buruaga, Onrubia, Fernández-García, Campos, Canales and Unamuno2012), whereas in English farmlands the densities estimated are lower (0.4–4.3 pairs/km2; Browne and Aebischer Reference Browne and Aebischer2004). On the other hand, densities in areas with higher woodland cover in Spain comprised between 10 and 26 males/km2 (Sáenz De Buruaga et al. Reference Sáenz De Buruaga, Onrubia, Fernández-García, Campos, Canales and Unamuno2012). On the other hand, our estimates are largely lower than those observed in North Africa, where 45 pairs/ha were estimated in citrus groves (Brahmia et al. Reference Brahmia, Zeraoula, Bensouilah, Bouslama and Houhamdi2015); besides, in Moroccan olive groves 16–20 nests/ha were estimated (Hanane and Baamal Reference Hanane and Baamal2011). The relatively high densities estimated could be partially explained by the average detection probability of 0.20, quite low with respect to the value of 0.56 found in another study (Johnston et al. Reference Johnston, Newson, Risely, Musgrove, Massimino, Baillie and Pearce-Higgins2014). However, this low detection could be explained by at least two reasons. First, in our study most of the observations referred to closed habitat types, such as forests, shrublands, and tree plantations, where lower detectability is the rule (Buckland et al. Reference Buckland, Anderson, Burnham and Laake1993, Gottschalk and Huettmann Reference Gottschalk and Huettmann2011, Johnston et al. Reference Johnston, Newson, Risely, Musgrove, Massimino, Baillie and Pearce-Higgins2014). Second, we observed Turtle Doves also in very heterogeneous landscapes with small patches of forests and it is known that detection probability declined with increasing forest fragmentation (De Wan et al. Reference De Wan, Sullivan, Lembo, Smith, Maerz, Lassoie and Richmond2009).
Concerning its habitat requirements, the Turtle Dove selects semi-natural forests, especially riparian willow forests but also oak-dominated forests. Certainly, the species regularly inhabits forests, both broadleaved and needleleaved, as well as mixed (Browne and Aebischer Reference Browne and Aebischer2003, Browne et al. Reference Browne, Aebischer and Crick2005, Bakaloudis et al. Reference Bakaloudis, Vlachos, Chatzinikos, Bontzorlos and Papakosta2009, Dias et al. Reference Dias, Moreira, Beja, Carvalho, Gordinho, Reino, Oliveira and Rego2013, Marx and Quillfeldt Reference Marx and Quillfeldt2018). This is a rule not only in Central Europe, but also in North Africa, where the subspecies S. t. arenicola is also distributed (Yahiaoui et al. Reference Yahiaoui, Arab, Belhamra, Browne, Boutin and Moali2014, Hanane and Yassin Reference Hanane and Yassin2017, Hanane Reference Hanane2018). The selection of riparian forests by the Turtle Dove is already known (Sáenz De Buruaga et al. Reference Sáenz De Buruaga, Onrubia, Fernández-García, Campos, Canales and Unamuno2012, Gruychev and Mihaylov Reference Gruychev and Mihaylov2019), although in some studies the distance from open water was not relevant (Gutiérrez-Galán et al. Reference Gutiérrez-Galán, Sanchez and González2018, Hanane Reference Hanane2018). As pointed out by Hanane (Reference Hanane2018), this fact could be explained by the ability of the species to travel long distances to reach water points, or by the fact that other factors are more limiting. In our study area, however, we need to consider that a large proportion of wooded areas are placed along the Ticino River, therefore there could be some spatial dependence in relation to forests. In our study area, there is some evidence that Turtle Doves also inhabit sites with high cover of black locust. This fact could be due to the less dense structure of this tree, which might be favorable for the species; indeed, in Morocco there was evidence of the fact that the species does not tolerate a very enclosed microhabitat (Hanane Reference Hanane2018). However, considering its statistical weakness, it is reasonable to think that this finding is a random result, especially because black locust is often associated with oaks in our study area. As well as semi-natural forests, shrublands and hedgerows have a positive effect on the species’ presence. Past research has demonstrated that shrubs are very important for the species because nests are very often concealed inside them (Mason and MacDonald Reference Mason and MacDonald2000, Browne et al. Reference Browne, Aebischer and Crick2005, Dunn and Morris Reference Dunn and Morris2012). In particular, it was estimated that the most suitable should be 4.5 m high and 3 m wide (Sparks et al. Reference Sparks, Parish and Hinsley1996, Browne et al. Reference Browne, Aebischer, Yfantis and Marchant2004). Nonetheless, in the Ebro valley (northern Spain), the abundance of the species is negatively associated with shrublands (Sáenz De Buruaga et al. Reference Sáenz De Buruaga, Onrubia, Fernández-García, Campos, Canales and Unamuno2012). Furthermore, hedgerows are undoubtedly very important in other parts of its range (Browne and Aebischer Reference Browne and Aebischer2004, Browne et al. Reference Browne, Aebischer and Crick2005, Dunn and Morris Reference Dunn and Morris2012, Dias et al. Reference Dias, Moreira, Beja, Carvalho, Gordinho, Reino, Oliveira and Rego2013) and their removal from farmland is one of the reasons for its decline in England (Browne et al. Reference Browne, Aebischer, Yfantis and Marchant2004). Generally, the most used are composed of thorny species like hawthorn Crataegus monogyna and blackthorn Prunus spinosa (Browne et al. Reference Browne, Aebischer and Crick2005). In addition, the importance of hedgerows could be due to the presence of weeds along these linear features. Indeed, it is well known that one of the main habitat requirements for the species is weed-rich areas (Mason and MacDonald Reference Mason and MacDonald2000, Browne and Aebischer Reference Browne and Aebischer2003, Dunn et al. Reference Dunn, Morris and Grice2015, Reference Dunn, Stockdale, Moorhouse-Gann, McCubbin, Hipperson, Morris, Grice and Symondson2018). This is true because the diet of both adult and juveniles is often composed of seeds of wild species, especially common fumitory Fumaria officinalis and common chickweed Stellaria media (Murton et al. Reference Murton, Westwood and Isaacson1984, Gutiérrez-Galán and Alonso Reference Gutiérrez-Galán and Alonso2016, Dunn et al. Reference Dunn, Morris and Grice2017). The Turtle Dove also selects sites with high cover of tree plantations, such as poplar plantations and reforestations/SRCs. Notably, poplar plantations are selected in spite of the completely absence of shrubby understorey. In fact, in Portugal the species is positively affected by coniferous forests without understorey, probably because they provide a suitable combination of secure nesting sites and food resources in the herbaceous understorey (Dias et al. Reference Dias, Moreira, Beja, Carvalho, Gordinho, Reino, Oliveira and Rego2013). In our case, however, poplar plantations are likely not used as nesting sites because their structure is not very dense and therefore cannot provide safe shelter, but it is possible that they are used as feeding sites, as in Portugal. On the other hand, the positive selection for reforestations/SRCs is already known for the species in the study area (Chiatante et al. Reference Chiatante, Giordano and Meriggi2019). This land cover type could be used for nesting because it is often dense and thick, becoming a safe place in which build the nest.
As expected, paddy fields and maize have a negative effect on the Turtle Dove because of their unsuitability. Likewise, we found a negative effect of cereals on the Turtle Dove, which concurs with other research (Browne and Aebischer Reference Browne and Aebischer2003, Reference Browne and Aebischer2004). Our research was focused on the first part of the breeding period, so the under-use of cereals is to be expected because Turtle Doves use this habitat only after harvest (Browne and Aebischer Reference Browne and Aebischer2003). In addition, the species is prone to extinction in arable lands where barley increased (Chamberlain and Fuller Reference Chamberlain and Fuller2000). However, cultivated crops, principally wheat, barley, and oil-seed rape, often form the bulk of the diet of both adult and the nestlings (Browne and Aebischer Reference Browne and Aebischer2002, Mansouri et al. Reference Mansouri, Al-Sadoon, Rochdi, Paray, Dakki and Elghadraoui2019), and some studies have pointed out the importance of cereal crops for improving the number of chicks hatched and fledged per nest (Kafi et al. Reference Kafi, Hanane, Bensouilah, Zeraoula, Brahmia and Houhamdi2015, Mansouri et al. Reference Mansouri, Al-Sadoon, Rochdi, Paray, Dakki and Elghadraoui2019). Undoubtedly, the presence of useful crops is important for the Turtle Dove, but probably not so much as the presence of weed-rich areas, especially in intensively cultivated agroecosystems, where the absence of fallows could be a limiting factor (Browne and Aebischer Reference Browne and Aebischer2002, Reference Browne and Aebischer2003). Finally, in our study area the Turtle Dove lives in sites with few built-up areas, which is in accordance with other researches carried out in the Iberian Peninsula and Morocco (Patón et al. Reference Patón, Romero, Cuenca and Escudero2012, Hanane Reference Hanane2018).
Conclusion
In summary, in an intensively cultivated agro-ecosystem in northern Italy, the Turtle Dove has densities of 5.0 pairs/km2; however, considering the low detectability (equal to 0.20) this estimate could be biased (MacKenzie et al. Reference MacKenzie, Nichols, Royle, Pollock, Bailey and Hines2006). This species inhabits areas with higher tree cover, either semi-natural forests or tree plantations, as well as areas with many shrubs and hedgerows, that are likely used for nesting. In addition, it avoids areas with a high proportion of crops, such as paddy fields, maize, and cereals. Furthermore, we point out the importance of maintaining weed-rich areas, such as hedgerows, which provide food both for adults and for juveniles. We have to keep in mind that these landscape features should also be maintained in areas in which there are no trees, shrubs, or hedgerows suitable for nesting, because the Turtle Dove can fly for many kilometres to reach feeding areas (Browne and Aebischer Reference Browne and Aebischer2003, Gutiérrez-Galán et al. Reference Gutiérrez-Galán, Sanchez and González2018). For conservation purposes, these should be encouraged also within or adjacent to cropped fields. They should be produced by sowing seed mixes that contain species eaten by Turtle Doves (Browne and Aebischer Reference Browne and Aebischer2003, Dunn et al. Reference Dunn, Morris and Grice2015, Rocha and Quillfeldt Reference Rocha and Quillfeldt2015, Fisher et al. Reference Fisher, Ashpole, Scallan, Proud and Carboneras2018). Besides, these landscape features should not be sprayed with herbicides or other pesticides because of the sensitivity of the species to biocides (Ruiz-Suárez et al. Reference Ruiz-Suárez, Boada, Henríquez-Hernández, González-Moreo, Suárez-Pérez, Camacho, Zumbado, Almeida-González, Mar Travieso-Aja and Luzardo2015, Fisher et al. Reference Fisher, Ashpole, Scallan, Proud and Carboneras2018). Hence, Turtle Doves require a combination of habitat features with suitable nesting and feeding areas, both in close proximity and in the surrounding context of the home range, and the degradation of either of these may reduce Turtle Dove populations (Gillings and Fuller Reference Gillings and Fuller1998, Browne et al. Reference Browne, Aebischer, Yfantis and Marchant2004, Dias et al. Reference Dias, Moreira, Beja, Carvalho, Gordinho, Reino, Oliveira and Rego2013, Fisher et al. Reference Fisher, Ashpole, Scallan, Proud and Carboneras2018).
Supplementary Materials
To view supplementary material for this article, please visit http://dx.doi.org/10.1017/S0959270920000532.
Acknowledgements
We thank Arianna Musacchio, Arianna Bazzocchi, Kati Sara Bovo, and Jacopo Maria Santoro for the help on the fieldwork. We acknowledge Andrew Sturgeon for proofreading and providing linguistic advice. This research was conducted with ethical approval from the University of Pavia (Department of Earth and Environmental Sciences). Bird surveys were conducted with permission from local landowners where necessary. Data collection did not involve sampling procedure, and experimental manipulation of birds and the fieldwork was conducted under Law of the Republic of Italy on the Protection of Wildlife (February 25, 1992).


 Open access