


Introduction
The Caatinga covers c. 735,000 km2 of north-eastern Brazil (Leal et al., Reference Leal, Silva, Tabarelli and Lacher2005) and is considered to be a significant wilderness area (Aguiar et al., Reference Aguiar, Lacher, da Silva, Mittermeier, Mittermeier, Robles Gil, Pilgrim, da Fonseca, Brooks and Konstant2002). It is the largest and most diverse seasonally dry tropical forest in the Americas and harbours large numbers of endemic species (DRYFLOR et al., Reference Banda-R, Delgado-Salinas, Dexter, Linares-Palomino and Oliveira-Filho2016). However, its natural vegetation has been declining at an alarming rate (Beuchle et al., Reference Beuchle, Grecchi, Shimabukuro, Seliger, Eva, Sano and Achard2015) as a result of land-use intensification (Aguiar et al., Reference Aguiar, Lacher, da Silva, Mittermeier, Mittermeier, Robles Gil, Pilgrim, da Fonseca, Brooks and Konstant2002; Leal et al., Reference Leal, Silva, Tabarelli and Lacher2005). There is an urgent need for conservation measures to protect the Caatinga, with only 1.2% of the area currently under full protection (DRYFLOR et al., Reference Banda-R, Delgado-Salinas, Dexter, Linares-Palomino and Oliveira-Filho2016). Protected areas need to be expanded, and charismatic species, such as large primates, can facilitate this process (Ducarme et al., Reference Ducarme, Luque and Courchamp2013) as they function as umbrella species for the conservation of valuable but more discreet biodiversity within their range. One of the species with the greatest potential for this role is the Caatinga howler monkey Alouatta ululata, which requires vast areas of suitable habitat to maintain viable populations.
The Caatinga howler monkey is categorized as Endangered on the IUCN Red List because of its small and declining population, a consequence of tree cover loss, habitat fragmentation and hunting (Oliveira & Kierulff, Reference Oliveira and Kierulff2008). Most of the species’ range is within the Caatinga, although it extends into the Cerrado (Oliveira & Kierulff, Reference Oliveira and Kierulff2008), but its limits are poorly known, which is a major constraint for the planning of conservation measures (Oliveira & Kierulff, Reference Oliveira and Kierulff2008).
Species distribution modelling is a tool for mapping geographical distributions and studying how they are influenced by environmental variables (Miller, Reference Miller2010). It is widely applied in conservation science and its models may support the selection of areas for conservation (Araújo et al., Reference Araújo, Williams and Fuller2002). The most common approach in species distribution modelling is maximum-entropy modelling, often applied using Maxent software (Phillips et al., Reference Phillips, Anderson and Schapire2006).
The identification of priority areas for conservation of species is a fundamental step in developing conservation plans (Pressey et al., Reference Pressey, Cabeza, Watts, Cowling and Wilson2007), and computational tools have been developed to carry out this process of prioritization, taking into consideration factors such as habitat quality, connectivity and conservation cost (Kukkala & Moilanen, Reference Kukkala and Moilanen2013). C-Plan (Pressey et al., Reference Pressey, Watts, Barrett, Ridges, Moilanen, Wilson and Possingham2009), Marxan (Watts et al., Reference Watts, Ball, Stewart, Klein, Wilson and Steinback2009) and Zonation (Moilanen et al., Reference Moilanen, Franco, Early, Fox, Wintle and Thomas2005) are examples of approaches and packages developed for conservation prioritization. The general objective of all these packages is similar, although their strategies vary. For example, Zonation, used in this study, prioritizes landscapes by iteratively removing the least valuable remaining areas while accounting for connectivity and generalized complementarity (Moilanen et al., Reference Moilanen, Anderson, Eigenbrod, Heinemeyer, Roy and Gillings2011).
The overarching objective of this project was to conduct spatially explicit analyses that contribute to the planning of measures to conserve A. ululata and the ecosystems with which it is associated. Our specific objectives were to (1) carry out field surveys to collect information on the distribution of the species, (2) identify areas where further surveys are needed, (3) develop a model to generate a potential species distribution map, and examine the environmental determinants of the species’ distribution, (4) identify the areas with most potential for the conservation of the species, and (5) determine the degree of coverage of the priority areas by existing protected areas. We use our results to make spatially explicit recommendations for actions needed to improve the conservation of A. ululata and of the many species that depend on the same Caatinga habitats.
Study area
The study area includes the known range of A. ululata, across the states of Maranhão, Piauí and Ceará (Fig. 1). In the spatial analysis we included not only the area encompassing all the known locations of the species, but also a 30-km wide buffer zone around this. The aim was to identify areas that may be suitable for the species but that are outside its currently known range.
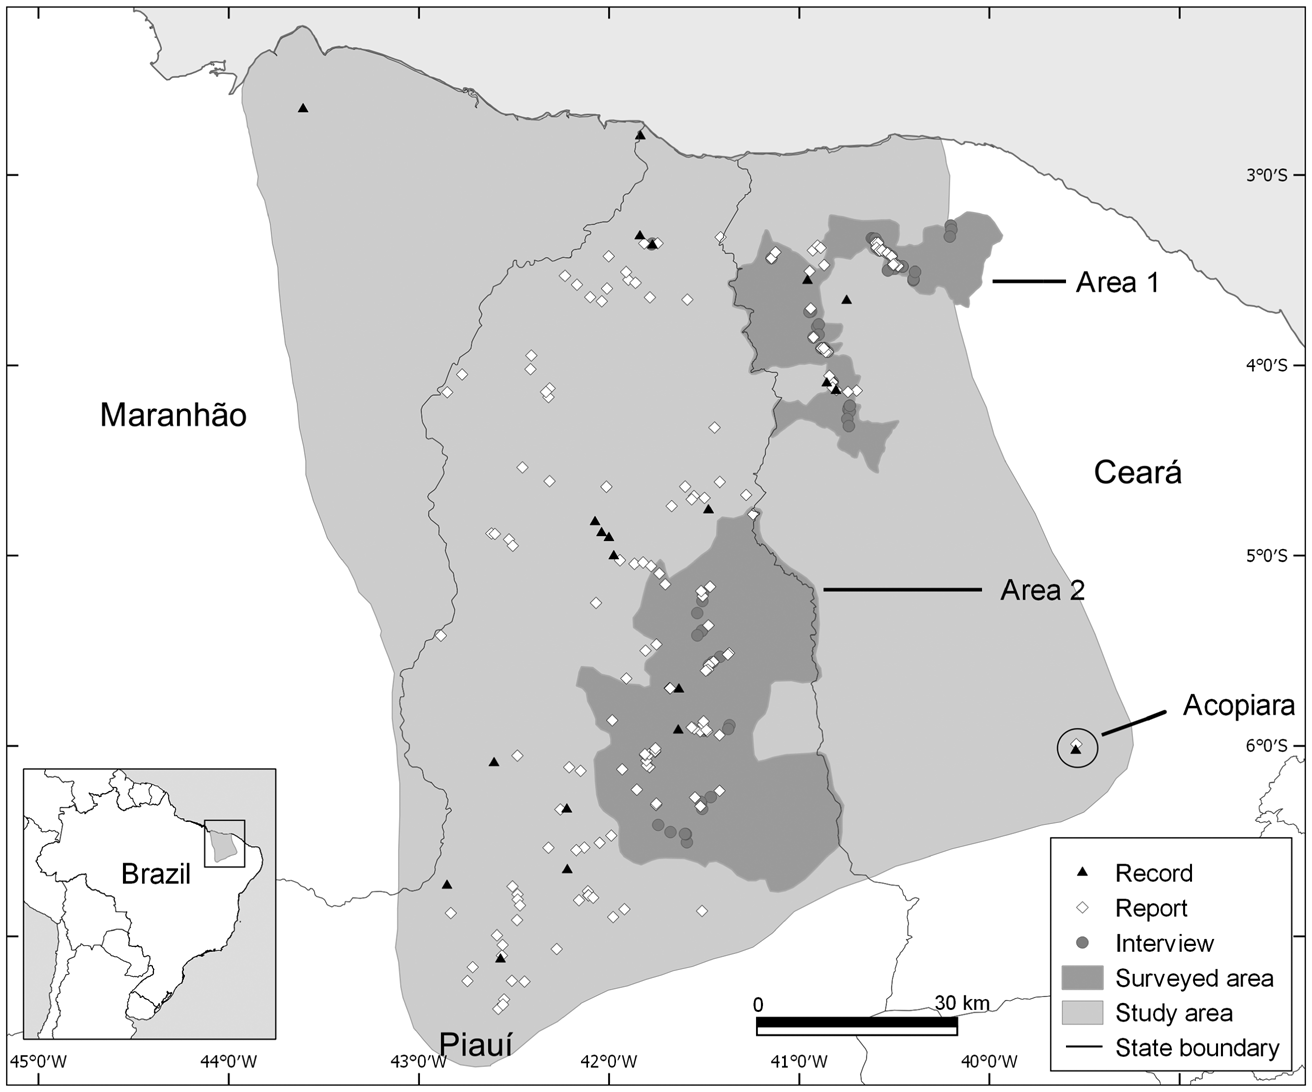
Fig. 1 Locations of records and reports of the Caatinga howler monkey Alouatta ululata, and interviews with members of the local rural community, throughout the species’ known range, in north-eastern Brazil.
Methods
Data collection
We compiled existing information on the distribution of A. ululata, most of which was collected during 2004–2010 by the National Center for Research and Conservation of Brazilian Primates (CPB/ICMBio). As the number of direct observations by researchers is low (20 records), we also used reports obtained in CPB/ICMBio interviews with members of the local rural community during 2004–2010 (112 reports). Interview-based distribution analysis can complement direct monitoring data in the case of easily identifiable species (Anadón et al., Reference Anadón, Giménez and Ballestar2010; Brittain et al., Reference Brittain, Ngo Bata, De Ornellas, Milner-Gulland and Rowcliffe2018). We also carried out surveys in two regions for which information was scarce, during August 2016–May 2017 (Fig. 1). We interviewed 112 farmers and hunters who lived or worked close to areas with natural vegetation. To minimize bias we did not reveal that A. ululata was the focus of our interviews (Freire Filho et al., Reference Freire Filho, Pinto and Bezerra2018). We asked about other mammals present in the region before asking about A. ululata (Freire Filho et al., Reference Freire Filho, Pinto and Bezerra2018). All interviews were conducted with the consent of the participants.
Some records based on interviews were initially referenced with the coordinates of the place of the interview, usually farmhouses. We replaced these coordinates with those of the nearest area of natural environment within a 2-km radius of the original coordinates (approximately the distance up to which the vocalization of the species can be heard). Points without natural environment within a 2-km radius were excluded. This procedure adds locational uncertainty, but Maxent modelling can make useful predictions even when the occurrence data include a moderate level of locational error (Graham et al., Reference Graham, Elith, Hijmans, Guisan, Townsend Peterson and Loiselle2008). Our initial database included 184 occurrences, 52 from our surveys and 132 from CPB/ICMBio. However, to minimize problems associated with spatial biases in sampling we used spatial filtering (Kramer-Schadt et al., Reference Kramer-Schadt, Niedballa, Pilgrim, Schröder, Lindenborn and Reinfelder2013), reducing the number of occurrences in oversampled areas by using only one within a radius of 5 km. This filtering procedure reduced the number of occurrences used in the modelling to 117 (20 direct observations and 70 reports from CPB/ICMBio, and one observation and 26 reports from our surveys).
Modelling of potential distribution
We used Maxent to identify variables influencing the distribution of A. ululata and generate a distribution map (Phillips et al., Reference Phillips, Anderson and Schapire2006). The choice of environmental variables was guided by the species’ biology; A. ululata is arboreal, feeds on leaves, fruits and other plant parts, and lives in a semi-arid region influenced by seasonal rainfall and high temperatures. We expected areas with higher precipitation to be more suitable during the most critical period of the year, the dry season. Furthermore, we hypothesized that tree cover and tree height would influence suitability, and that areas with rugged terrain would be more suitable because terrain ruggedness tends to be an obstacle to habitat destruction and to provide some protection from hunting. With the help of a matrix of correlations between all candidate variables, we selected a set of six predictors (Table 1) that were not highly correlated (|r| < 0.70; Rainho & Palmeirim, Reference Rainho and Palmeirim2013) and that were biologically meaningful.
Table 1 Predictive variables used in our analysis of the potential distribution of and priority conservation areas for the Caatinga howler monkey Alouatta ululata.
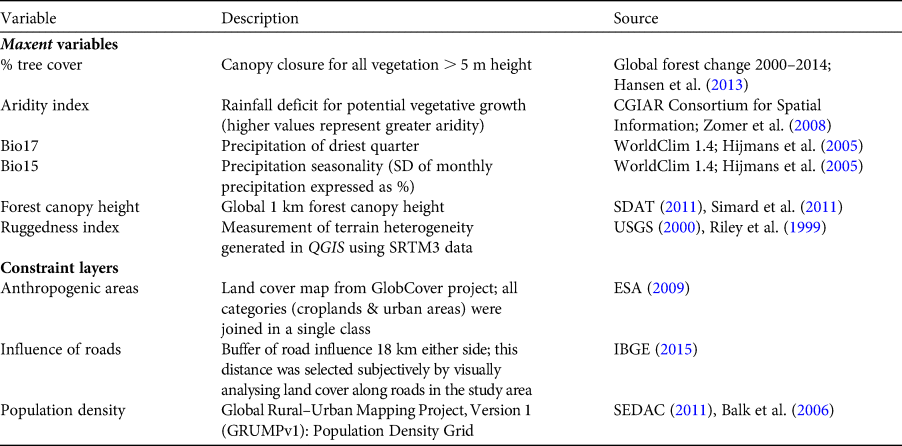
Prior to running Maxent all layers were converted to the WGS 1984 geographical coordinate system and to a cell size of 30 arc seconds (c. 1 km2), using IDRISI Selva (Eastman, Reference Eastman2012) and QGIS 2.8 (QGIS Development Team, 2016). In Maxent we used the following settings: convergence threshold (10–5), maximum iterations (500), regularization multiplier (1), maximum number of background points (104), linear, quadratic, product and hinge features, random seed generation and 50 replicates. The resulting map is in logistic format, with the probability of presence for each cell being in the range 0–100% (Phillips, Reference Phillips2008). To select a suitability threshold for the potential distribution map we used the methodology described in Rainho & Palmeirim (Reference Rainho and Palmeirim2013), which facilitates the selection of the smallest area including most occurrences. The area selected was that corresponding to the Maxent suitability threshold 70%, which encompassed 83% of the occurrences (Fig. 2); above this threshold the inclusion of more occurrences would force the addition of a disproportionally large area.
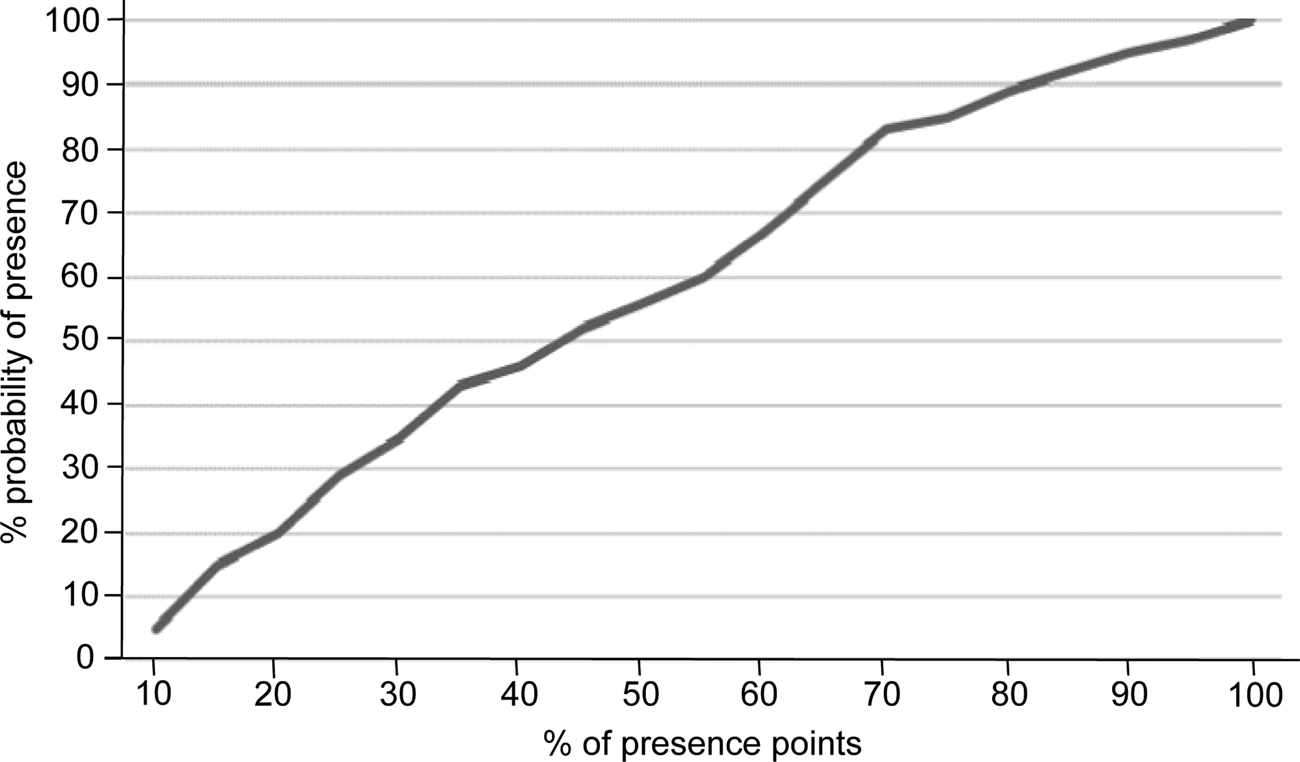
Fig. 2 Relationship between per cent probability of presence and per cent of presence points for the Caatinga howler monkey, used to define the suitability threshold for the species in the Maxent model.
Prioritizing areas for conservation
We used Zonation (Moilanen et al., Reference Moilanen, Franco, Early, Fox, Wintle and Thomas2005) to prioritize areas for the conservation of A. ululata. Zonation generates a priority map that can be used to inform decision-making. Cost efficiency can be considered in this prioritization through the inclusion of a cost layer. We assume that conservation cost efficiency is higher in areas with fewer anthropogenic constraints, and thus generated a single constraints layer combining three thematic layers: human population density, proximity to roads, and anthropogenic areas (i.e. urban areas and farmland). These three layers (Table 1) were given equal weight in the generation of the constraints layer. Zonation assigned this layer negative weights and combined it with the map of potential distribution of A. ululata generated with Maxent.
In Zonation we selected distribution smoothing as the aggregation method. It considers fragmentation to be undesirable and thus retains areas that are well interconnected. The size of the smoothing kernel used was 6 km, a value based on the distances crossed by various Alouatta species outside their usual home ranges (Glander, Reference Glander1992; Crockett, Reference Crockett1998). As a cell removal rule we used core-area zonation, which is appropriate when importance is given to core areas, i.e. locations with the highest suitability in terms of abundance or high probability of occurrence (Moilanen et al., Reference Moilanen, Pouzols, Meller, Veach, Arponen, Leppänen and Kujala2017). To avoid losing valuable areas and to keep structural connectivity we selected the options ‘add edge points’ and ‘edge removal’ (Moilanen et al., Reference Moilanen, Pouzols, Meller, Veach, Arponen, Leppänen and Kujala2017).
To identify the priority regions lacking protection, we overlaid the Zonation map with existing protected areas. We used a map of forest loss during 2000–2014 (Hansen et al., Reference Hansen, Potapov, Moore, Hancher, Turubanova and Tyukavina2013) to identify recent deforestation in priority areas.
Results
The mean test area under the curve (AUC) for the Maxent distribution model of A. ululata was 0.857 ± SD 0.032, indicating a high efficiency in distinguishing presence from random background locations (Fig. 3). The variables with greatest contributions in the potential distribution model were per cent tree cover, precipitation of driest quarter (Bio17) and aridity index (Table 2). The jackknife analysis corroborates these results (Table 2). Probability of presence increases with tree cover, canopy height and terrain ruggedness (Fig. 4). In the case of the climatic variables (aridity, precipitation in driest quarter and precipitation seasonality) the highest probability of occurrence tends to be in the intermediate values (Fig. 4).
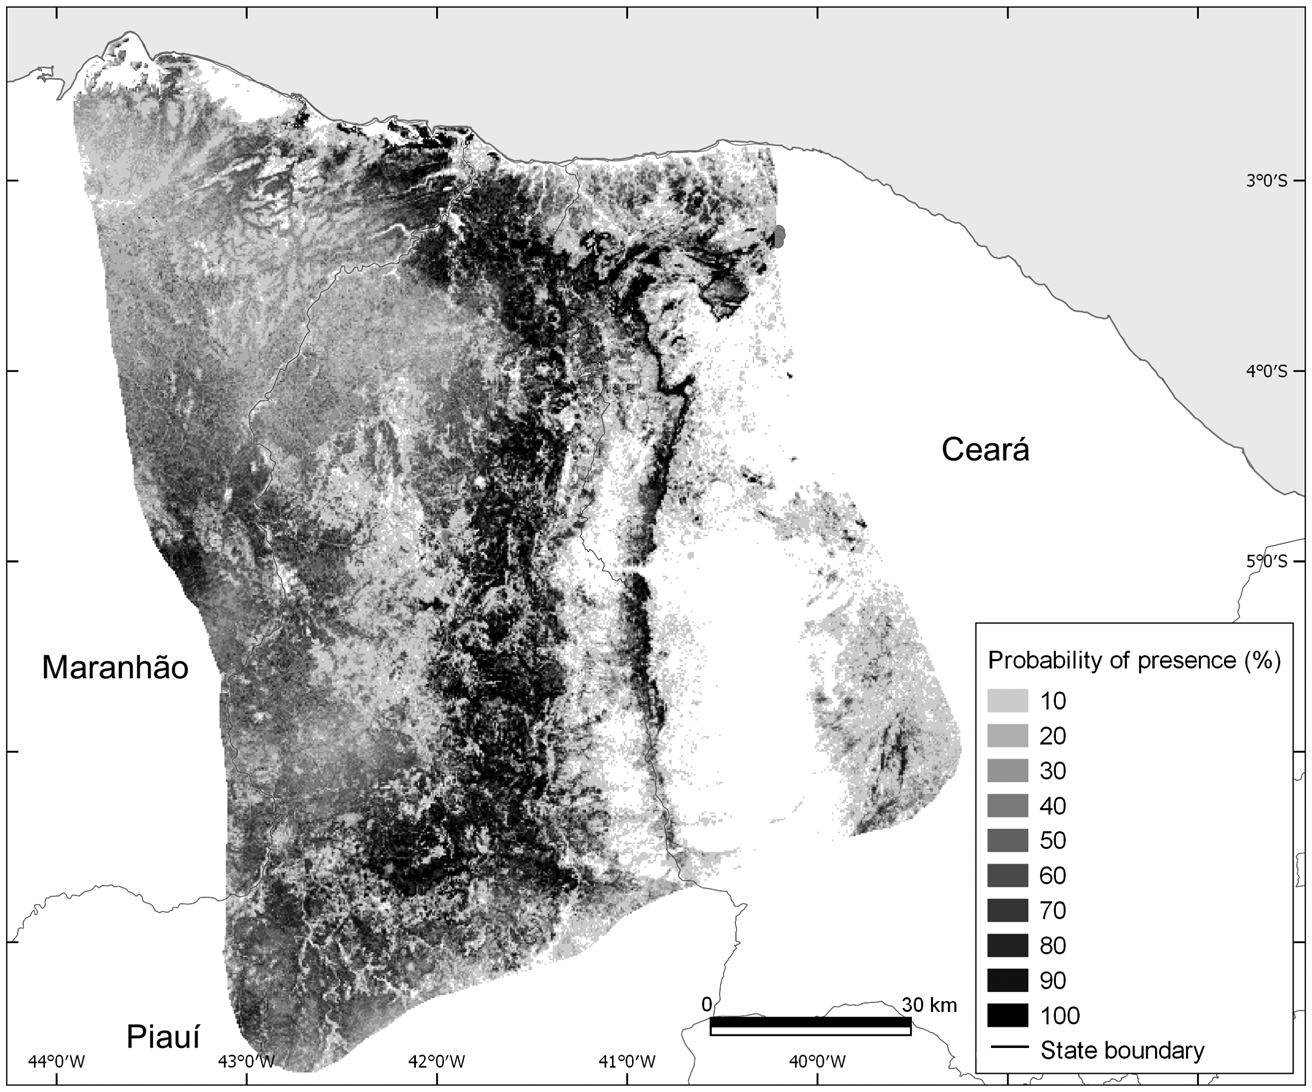
Fig. 3 Probability of presence of the Caatinga howler monkey, as predicted by the Maxent model.

Fig. 4 The relationship of the probability of presence of the Caatinga howler monkey with six environmental variables: (a) per cent tree cover, (b) aridity, (c) precipitation of driest quarter, (d) Ruggedness, (e) precipitation seasonality, and (f) forest canopy height.
Table 2 Results of the Maxent distribution model for A. ululata.

*AUC, area under the curve.
Results of the Zonation prioritization are shown in Fig. 5a. For graphical clarity we show only two levels of priority: high priority (the best 20%) and top priority (the best 10%, c. 34,400 km2). These priority areas can be divided into four ecologically distinct regions: (1) mangroves, in the mouth of the Parnaíba River; (2) enclaves, encompassing the humid areas of north-west Ceará and northern Piauí; (3) Caatinga, a vast region within the Caatinga biome; and (4) border, located along the border of the states of Piauí and Maranhão (Fig. 5a).
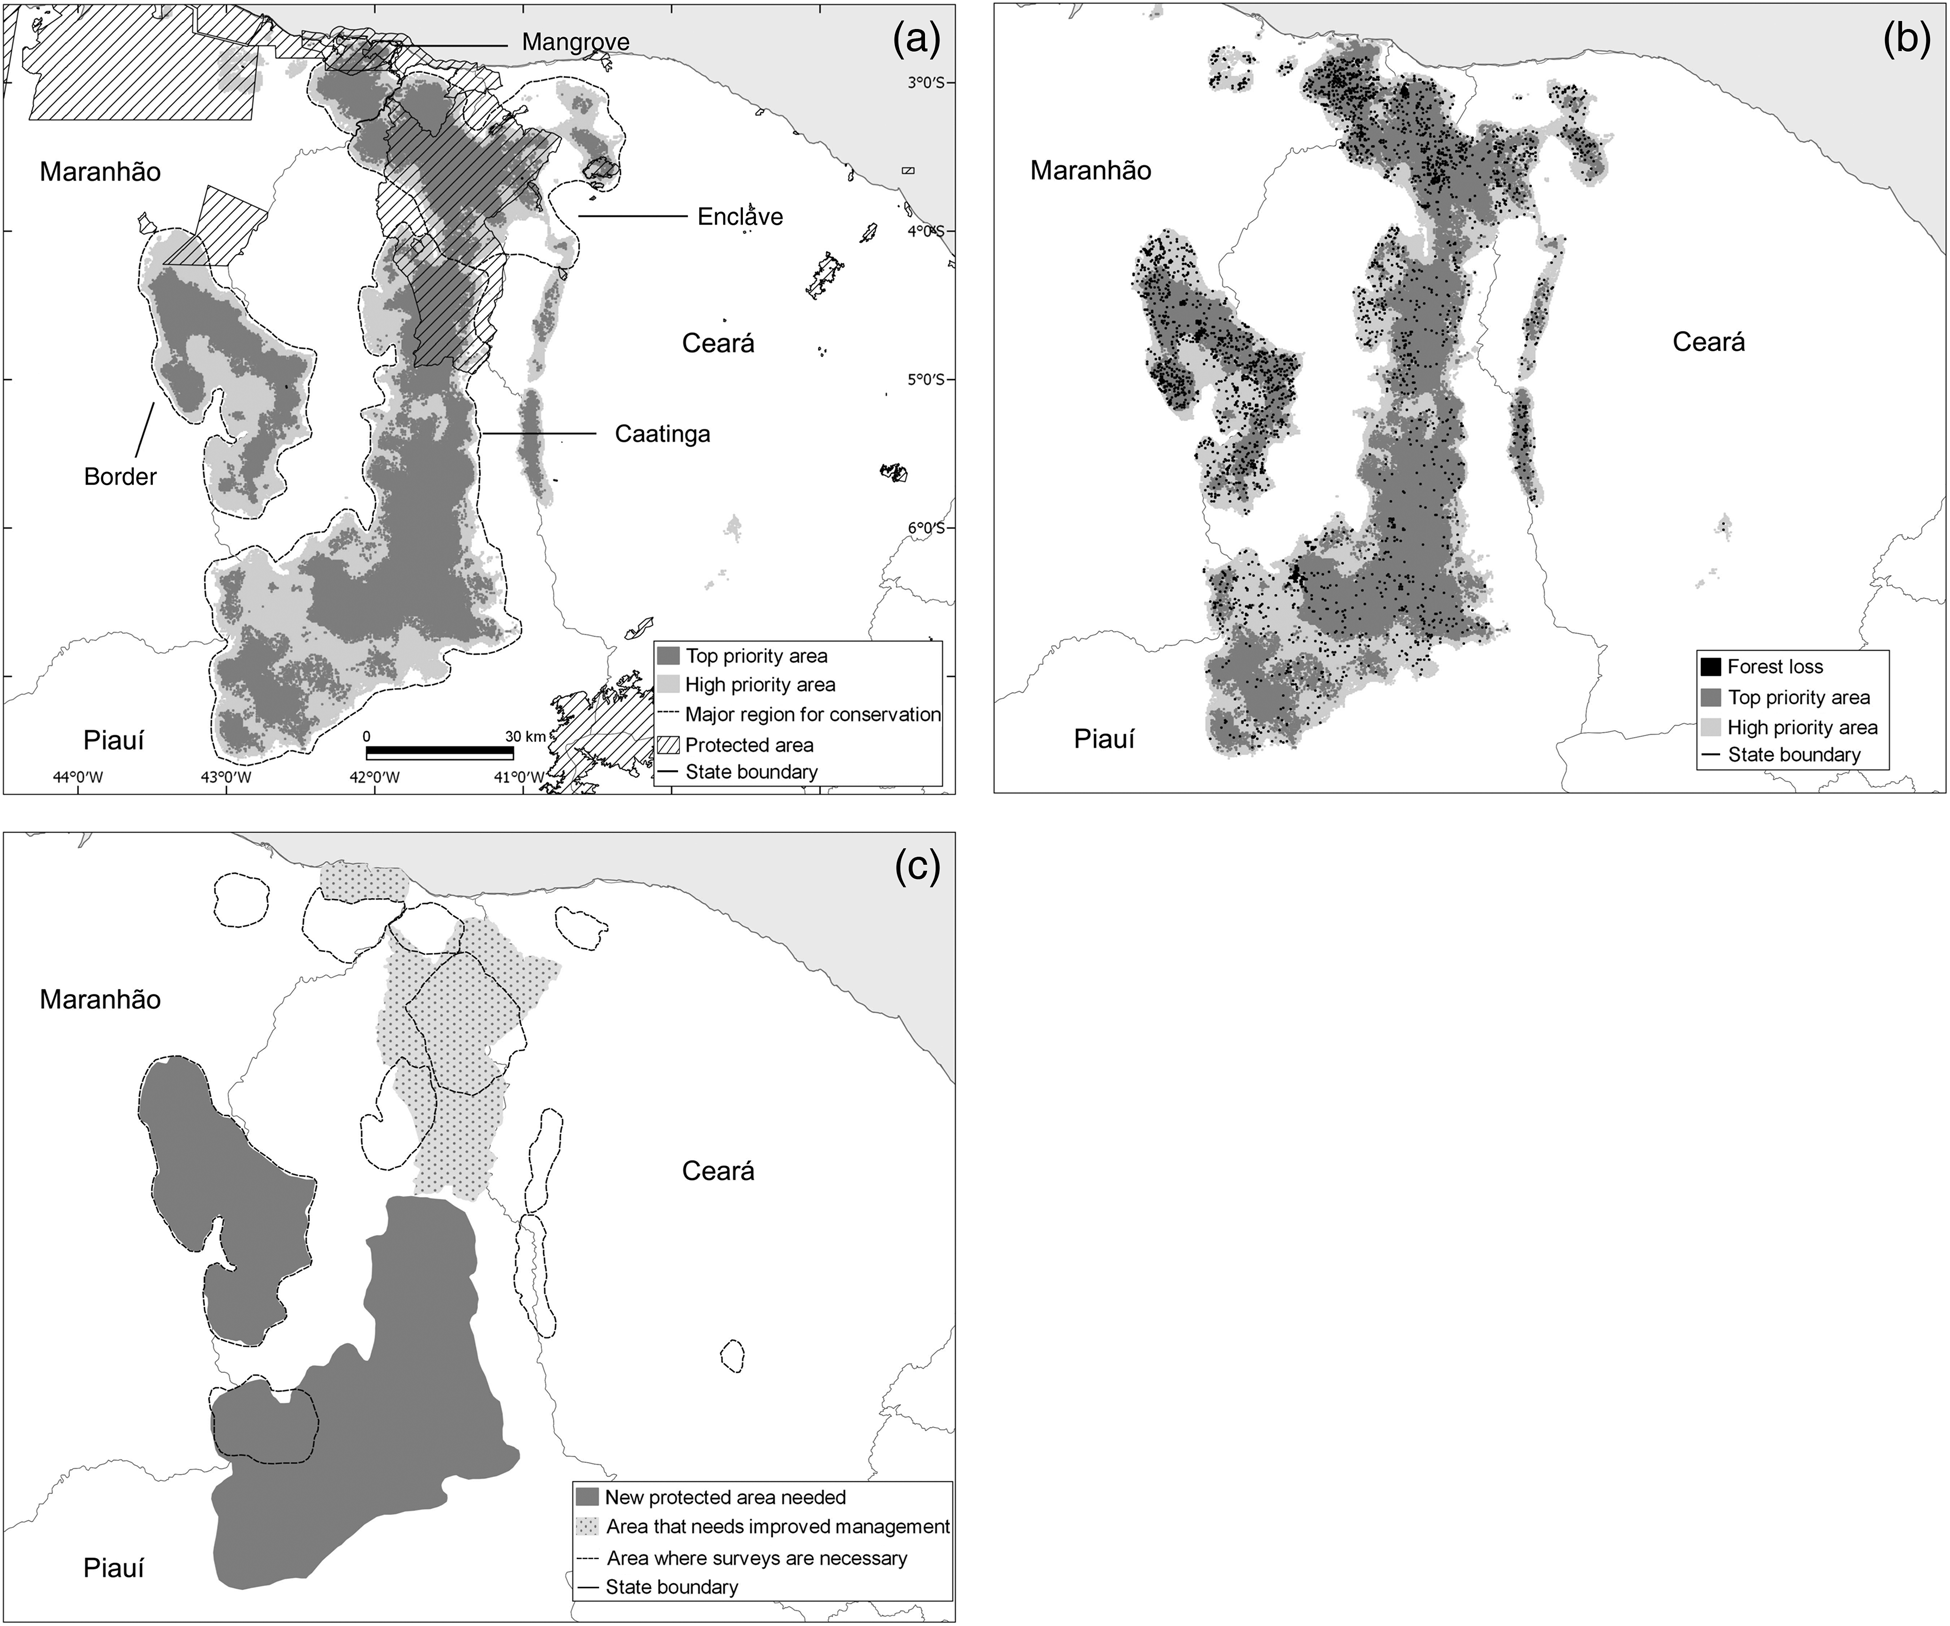
Fig. 5 (a) Priority areas for the conservation of the Caatinga howler monkey A. ululata in mangrove, enclave, Caatinga and border areas, and existing protected areas; (b) forest loss during 2000–2014 within priority areas; (c) areas requiring survey work, new protected areas, and improved management.
Circa 21% of the most important areas for the conservation of A. ululata are within legally protected areas (Fig. 5a). However, the coverage of priority regions by these protected areas is uneven; important parts of mangrove and enclave areas have some level of legal protection, whereas border and Caatinga areas are virtually unprotected (Table 3).
Table 3 Protected area and forest loss in each of the four priority regions identified for A. ululata.
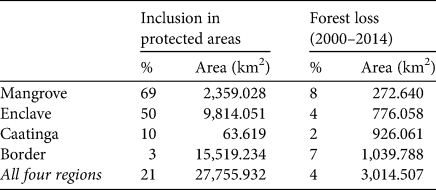
Although the loss of tree cover during 2000–2014 was scattered, it occurred throughout the high-priority areas, including in protected areas. In some enclaves of northern Piauí deforestation is more widespread and there are larger deforested patches (Fig. 5b). Overall c. 3.8% of prime area for the conservation of A. ululata was deforested during 2000–2014 (Table 3).
Discussion
Potential distribution
A visual analysis shows a good correspondence between the distribution and density of the occurrence of the species with the map generated by Maxent. However, there are suitable areas without occurrences, possibly because of local extinctions (e.g. as a result of hunting) or a lack of survey effort (Oliveira & Kierulff, Reference Oliveira and Kierulff2008). There are also a few occurrences in areas with low Maxent suitability, which can be explained by the extensive loss of natural habitat (Oliveira & Kierulff, Reference Oliveira and Kierulff2008).
An isolated population inhabits a small humid enclave in Acopiara, Ceará, separated from the range of the species by > 100 km of unsuitable dry Caatinga (Fig. 1; Oliveira et al., Reference Oliveira, Ferreira, Mota, Soares and Bicca-Marques2007). It is probably a remnant of a broader distribution of the species when humid forest dominated the region (Carmignotto et al., Reference Carmignotto, Vivo, Langguth, Patterson and Costa2012), but could have been introduced by people long ago (monkeys are often kept as pets by Indigenous People, so this population could potentially have originated from escaped animals).
The eastern limit of the range of A. ululata is clear, defined by the high-aridity conditions in central Ceará. However, the western limit is ill defined and possibly explained by the wet conditions prevailing in Maranhão. Moreover, competition with Alouatta belzebul, a closely related species occurring further west, may contribute to shaping the western limit of the range of A. ululata. It is unclear if the two taxa are distinct species or differentiated populations of the same species (Viana et al., Reference Viana, Bonvicino, Ferreira, Jerusalinsky, Langguth and Seuánez2015).
The variables used in the Maxent model are coherent with the biology of the species (Oliveira & Kierulff, Reference Oliveira and Kierulff2008). Per cent tree cover was the most important of these variables and suitability was low up to c. 50% tree cover, which is probably explained by the marked arboreal habit of the species (Oliveira & Kierulff, Reference Oliveira and Kierulff2008). The species' diet of leaves and fruit may also contribute to its dependence on dense tree cover, as trees are its main food source (Oliveira & Kierulff, Reference Oliveira and Kierulff2008). Moreover, the results indicate that A. ululata prefers tall forest, even though it occupies a variety of woodland types (Oliveira & Kierulff, Reference Oliveira and Kierulff2008).
The second and third most influential variables in the model are both climatic and related: aridity index and precipitation in the driest quarter (Bio17). The results indicate that regions with an extreme dry season are unsuitable for A. ululata, suggesting vulnerability to the ongoing aridification of the Caatinga (Torres et al., Reference Torres, Lapola, Gamarra, da Silva, Leal and Tabarelli2017), where it is predicted that by the end of the 21st century temperatures may be up to 3.5–4.5 °C higher and rainfall 40–50% lower than at present (PBMC, 2013).
Priority areas for conservation and current level of conservation
The priority areas identified using Zonation (Fig. 5a) should combine high habitat suitability, identified by Maxent, with good connectivity and low conservation constraints. This should make our results a good basis for conservation planning. However, both Maxent and Zonation modelling are affected by sources of error, such as inaccuracies in species occurrences and environmental layers, which create uncertainty (Graham et al., Reference Graham, Elith, Hijmans, Guisan, Townsend Peterson and Loiselle2008; Moilanen et al., Reference Moilanen, Pouzols, Meller, Veach, Arponen, Leppänen and Kujala2017). New and better models should be generated as more information on species or better environmental layers become available, and management decisions may have to be adjusted to take the new results into account. However, the inevitable uncertainty associated with models should not be an obstacle to their careful use in planning conservation action; in the face of rapid environmental change the risks of inaction are probably greater than those of using models judiciously (Wiens et al., Reference Wiens, Stralberg, Jongsomjit, Howell and Snyder2009).
The priority areas identified encompass ecologically distinct regions. For example, the A. ululata population that inhabits the mangroves at the mouth of the Parnaíba River has a unique ecology (e.g. a diet composed of mangrove plants). The groups that inhabit the enclave region of Ceará live mostly in humid areas with open ombrophilous forest. Adaptations to these different environments may have resulted in populations of A. ululata with distinct behaviours, ecologies, gene pools and even morphologies. It is desirable to protect the various ecological contexts in which the species is present. Virtually all priority areas with protected status are in the northern part of the species’ range. The south, including the region with most occurrences, is unprotected. This situation reflects the scarcity of protected areas in the Caatinga (de Marques & Peres, Reference de Marques and Peres2015; DRYFLOR et al., Reference Banda-R, Delgado-Salinas, Dexter, Linares-Palomino and Oliveira-Filho2016).
The level of conservation provided by most protected areas in the range of A. ululata is minimal. Of the nine relevant protected areas only two (Ubajara and Sete Cidades National Parks) are fully protected, with nature preservation being their main objective, and only indirect use of natural resources allowed (MMA, 2016). All other conservation units allow sustainable use of natural resources (MMA, 2016), which needs to be well managed to avoid damage. However, management is insufficient because of a lack of human and financial resources. Moreover, in this region awareness of the protected areas is low (Drummond et al., Reference Drummond, Franco and Ninis2009).
Our analysis indicated that deforestation is ongoing throughout most of the priority areas, even within protected areas (Fig. 5b), in line with the general trend of tree cover loss in the Caatinga (Beuchle et al., Reference Beuchle, Grecchi, Shimabukuro, Seliger, Eva, Sano and Achard2015). The situation is better only in federally protected National Parks, where we did not identify recent deforestation. Thus it is evident that protected areas currently make only a small contribution to the protection of A. ululata and the other natural values of the Caatinga.
Implications for conservation
The Maxent analysis indicates that good tree cover and levels of aridity lower than those prevailing in the Caatinga region are critical for A. ululata, suggesting that the species is affected by both deforestation and climate change. Unfortunately, tree cover is declining (Beuchle et al., Reference Beuchle, Grecchi, Shimabukuro, Seliger, Eva, Sano and Achard2015), even in protected areas (Fig. 5c), and arid conditions are increasing (Torres et al., Reference Torres, Lapola, Gamarra, da Silva, Leal and Tabarelli2017). This negative context should be taken into consideration in planning the conservation of the species.
Based on the results of our spatial analyses we recommend four conservation actions for A. ululata. These actions vary across the range of the species (Fig. 5c).
Firstly, Maxent modelling indicates that the range of A. ululata includes poorly surveyed areas where the presence of the species has not been confirmed, and the Zonation analysis indicates that some of these areas have a high level of conservation priority. These areas should be surveyed as a matter of urgency (Fig. 5c).
Secondly, our results demonstrate that the legal protection of areas suitable for A. ululata is uneven. The central and southern parts of the species’ range, which include some of the potentially best areas for its conservation, are not currently protected. Thus the designation of new state, federal and private protected areas is critical, especially in the larger contiguous priority areas (Fig. 5c).
Thirdly, and concurrently, management of the existing protected areas requires improvement.
Fourthly, knowledge on the biology of A. ululata is still insufficient to plan effective management measures and therefore, in addition to survey work to clarify the status of the species, further research is required on aspects of the species’ ecology that are critical to its conservation.
The priority areas identified by the Zonation models mostly coincide with good-quality remnants of Caatinga, which are also important for the rich biodiversity of this biome, threatened by habitat destruction but poorly covered by protected areas (DRYFLOR et al., Reference Banda-R, Delgado-Salinas, Dexter, Linares-Palomino and Oliveira-Filho2016). Given the species’ medium body size, the conservation of viable populations of A. ululata requires the maintenance of large areas of well-preserved habitat, making it a good umbrella species with potential to contribute to the protection of the biodiversity in this unique ecoregion.
Acknowledgements
This study was funded by a Rufford Foundation grant (19646-1). RFF is supported by a scholarship from Fundação de Amparo à Ciência e Tecnologia de Pernambuco (IBPG-1236-2.05/16). We thank the rural communities who collaborated in this research; Thieres Pinto, Gabriela Linhares, Andressa Fraga and Nádia Freitas for assistance in the field; and Marcos Fialho and Leandro Jerusalinsky (CPB-ICMBio) for providing presence records of A. ululata.
Author contributions
Study conception and design, writing: RFF, JMP; field work and data analysis: RFF.
Conflicts of interest
None.
Ethical standards
This research complies with the Oryx Code of Conduct. No specimens were killed or collected. Interviews were conducted in accordance with the ethical standards of the British Sociological Association (BSA, 2017).


