


Vitamin D plays a critical role in bone mineralisation during growth phases of infancy and childhood. Recent population studies report a high prevalence of vitamin D deficiency and insufficiency, with suggested contributing factors being avoidance of sun exposure owing to skin cancer risks, increased indoor activities and changes in dietary habits( Reference Spiro and Buttriss 1 ). Natural dietary sources of vitamin D3 are limited and include oil-rich fish and eggs; therefore, vitamin D3 levels are largely dependent on sunlight exposure( Reference Calvo, Whiting and Barton 2 ). Supplemented foods may provide a further source of vitamin D. Vitamin D3 (animal sourced) and vitamin D2 (plant sourced) have both been used in dietary fortification and as supplements, although recent studies suggest that vitamin D3 is more readily utilised by humans( Reference Tripkovic, Lambert and Hart 3 ).
Both forms of vitamin D are metabolised by hepatic 25-hydroxylase into 25-hydroxyvitamin D (25(OH)D). This biologically inactive form of vitamin D is further modified by renal 1α-hydroxylase into the active metabolite 1,25-dihyroxyvitamin D (1,25(OH)2D). The activity of 1,25(OH)2D3 is via binding to its receptor, which is highly conserved across mammalian species( Reference Haussler 4 ). Although produced in the kidney, 1,25(OH)2D acts in intestinal cells to increase Ca and P absorption or in the bone to stimulate differentiation and activation of bone cells( Reference Holick 5 , Reference Holick, Binkley and Bischoff-Ferrari 6 ). Owing to its longer half-life, compared with 1,25(OH)2D, serum levels of 25(OH)D are considered the best indicator of vitamin D status( Reference Holick, Binkley and Bischoff-Ferrari 6 , Reference Thacher and Clarke 7 ).
Milk provides an ideal vehicle for supplementing vitamin D( Reference Holick, Binkley and Bischoff-Ferrari 6 , Reference Maguire, Birken and Khovratovich 8 ), with this being practised voluntarily in some European countries( Reference Laaksi, Ruohola and Ylikomi 9 ) and mandatorily in North America( Reference Calvo and Whiting 10 ). Milk products come with normal or reduced fat content and from different animal sources, although cow milk products are predominant( Reference Lee, Birken and Parkin 11 ). With increasing world-wide obesity, there is a trend for use of low-fat milk consumption for young children( Reference Fox, Condon and Briefel 12 , Reference Goldbohm, Rubingh and Lanting 13 ). However, a cross-sectional analysis of children aged 12–72 months found a positive association between milk-fat percentage and 25(OH)D( Reference Vanderhout, Birken and Parkin 14 , Reference Vanderhout, Birken and Parkin 15 ). These authors concluded that low-fat milk (1 or 2 %) may compromise serum 25(OH)D levels and hence bone health.
To understand the effects of dietary components on bone development in humans, many researchers have used young, growing rats as a model; for example, assessment of minerals( Reference Hunt, Hunt and Zito 16 – Reference McKinnon, Kruger and Prosser 18 ) and fatty acids( Reference Li, Seifert and Lim 19 ). Young growing rats have also been used to study the effects of vitamin D on bone development( Reference Anderson, Sawyer and May 20 , Reference Hohman, Martin and Lachcik 21 ). Rats metabolise this vitamin using the same metabolic pathways as humans( Reference Anderson, Sawyer and May 20 ), and deficiencies of dietary vitamin D induce similar changes to bone strength and structure( Reference Lester, VanderWiel and Gray 22 , Reference Anderson, Sawyer and Moore 23 ). Therefore, this provided a suitable model for our study. We evaluated the bioavailability of vitamin D3 when it was offered to young, growing male rats either in solid food or in liquid full-fat or reduced-fat milk from cows or goats, and further assessed the utilisation of this vitamin for bone mineralisation.
Methods
Animals
All animal experiments were performed in accordance with the guidelines of the New Zealand National Animal Ethics Advisory Committee for the use of animals in research, testing, and teaching. All experimental procedures were approved by the Ruakura Animal Ethics Committee. Sprague–Dawley male rats used in the study were housed in large cages (n 4/cage) under specific pathogen-free conditions, in a temperature-controlled room with a 12-h on/off light cycle.
Feeding trials
Two feeding trials were undertaken to assess vitamin D3 uptake from milk and its utilisation. In the first trial, animals were offered vitamin D supplemented in goat or cow liquid skimmed milk, while being fed a rodent diet (containing milk protein) with no vitamin D. In the second feeding trial, animals were offered vitamin D supplemented in goat or cow liquid skimmed milk or full-fat milk, while being fed a dairy-free rodent diet with no vitamin D.
Trial 1 – diets and experimental protocols
During the study, Groups 1–4 were fed a semi-synthetic diet (standard AIN-93G Rodent Diet using milk casein as the protein source; Research Diets, Inc.; 18 % protein, 65 % carbohydrate; 7 % fat) either containing vitamin D3 (25 µg/kg) or no added vitamin D3. Group 5 was fed a dairy-free Teklad Rodent Diet (Teklad Global 18 % Protein Rodent Diet; Harlan Laboratories; 18 % protein; 44 % carbohydrate, 6 % fat) containing vitamin D3 (37·5 µg/kg). Liquids (water, goat skimmed milk (GSM) and cow skimmed milk (CSM)) were supplied via drink bottles to the rats ad libitum. Milk was prepared fresh daily using milk powders supplied by Dairy Goat Co-operative (NZ) Ltd (DGC), with each powder reconstituted to obtain 2·4 % protein, 3 % carbohydrate and 1 % fat. Vitamin D3 (Dry vitamin D3, 100 SD/S; DSM Nutritional Products) had been added to the milk powders to give a final concentration of 8·13 µg/l in the prepared milk.
At weaning (3 weeks of age, Day 0), 40 rats were randomly allocated to five groups (n 8/group). Groups 1–4 were fed ad libitum for 1 week on standard AIN-93G Rodent Diet containing no vitamin D3. From 4 to 8 weeks of age (Days 7–35), the control group (Group 1) was fed standard AIN-93G diet containing vitamin D3, plus water. Over the same time interval, Groups 2, 3 and 4 were retained on the standard AIN-93G diet containing no vitamin D3 and were further supplemented with either water (Group 2), GSM (Group 3) or CSM (Group 4). A dairy-free control group (Group 5) was fed Teklad Rodent Diet containing vitamin D3, plus water, from weaning to 8 weeks of age.
Trial 2 – diets and experimental protocols
During the study, all rats were fed a semi-synthetic, dairy-free diet (modified AIN-93G Rodent Diet using egg albumin as protein source; Research Diets; 18 % protein, 65 % carbohydrate; 7 % fat; 1 % Biotin) either containing vitamin D3 (25·0 µg/kg) or no added vitamin D3. Liquids (water, GSM, goat full-fat milk (GWM), CSM and CWM) were supplied via drink bottles to the rats ad libitum. Milk was prepared fresh daily using milk powders (DGC), with each powder reconstituted to obtain the 2·4 % protein and 8·13 µg/l vitamin D3. The prepared skimmed milk contained 1 % milk fat and WM contained 2·6 % milk fat.
At weaning (3 weeks of age, Day 0), 48 rats were randomly allocated to six groups (n 8 per group) and fed ad libitum for 1 week on modified AIN-93G diet containing no vitamin D3. From 4 to 8 weeks of age (Days 7–35), the control group (Group 1) was fed modified AIN-93G diet containing vitamin D3, plus water. Over the same time interval, the five treatment groups were retained on the modified AIN-93G diet containing no vitamin D3 and were further supplemented with either water (Group 2), GSM (Group 3), GWM (Group 4), CSM (Group 5) or CWM (Group 6).
Food monitoring and sample collection
Liquid intake (24 h) was measured when bottle contents were changed daily. During the last week of each trial, the intake of solid diet was measured daily. Samples of all solid and liquid diets were retained for compositional analysis. Rats were weighed weekly to monitor health. At 8 weeks of age, the rats were euthanised by CO2 asphyxiation and cervical dislocation. Blood (6 ml) was obtained by cardiac puncture; 1 ml was allowed to clot and then centrifuged for 10 min, 1650 g , at room temperature. Serum was collected and stored at −20°C until analysed for minerals. The remaining blood was treated with EDTA and then centrifuged for 10 min, 1650 g , at room temperature. Plasma was collected and stored at −20°C until analysed for 25(OH)D3. The lumbar spine and femurs were removed by simple dissection. The left femur was scraped clean of adhering flesh. All samples were then stored in PBS solution at –20°C.
Measurement of vitamins and minerals in diets, serum and plasma
The vitamin D3 content in the solid and liquid diets was measured by AsureQuality using methods based on Brubacher et al. and Indyk & Woollard( Reference Indyk and Woollard 24 , Reference Brubacher, Muller-Mulot and Southgate 25 ). The levels of 25(OH)D3 in rat plasma samples were measured by liquid chromatography-tandem MS using the method of Lankes et al.( Reference Lankes, Elder and Lewis 26 ). Ca, Mg and P levels were measured in the solid and liquid diets and in the rat sera by AsureQuality using inductively coupled plasma optical emission spectroscopy methodology.
Dual-energy X-ray absorptiometry scans of the right femur and spine
Right femurs and spines were assessed for bone mineralisation using dual-energy X-ray absorptiometry (DEXA) measurements with a Hologic Discovery A bone densitometer. A quality control scan was undertaken at the start and end of each scanning session using a spine phantom according to the manufacturer’s guidelines to verify system calibration. Before DEXA scanning, frozen right femurs and spines were thawed and dissected to a tissue depth of approximately 5 mm. Femurs and lumbar spine (LS1–LS4) were then individually scanned using a small-animal regional high-resolution protocol.
Biomechanical properties of the femur
Before biomechanical testing, the left femurs were thawed and then held at 23°C during the tests. The femur length was measured using an electronic caliper and the wet weight recorded. The midpoint of the femur was marked with a waterproof pen and then placed in a testing jig constructed for a three-point bending test. The distance between the supporting rods had a fixed length of 12 mm. Load was applied at a constant deformation rate of 50 mm/min. Maximum force (N), elasticity (N/mm2) and breaking energy (J) were measured using a Shimadzu Ezi-test texture analyzer. The maximum force is the load required to break the bone and is thought to reflect the mineral content, as well as the protein component of bone. Measured elasticity reflects the distance in mm by which bone can bend under the applied load without permanent deformation (stiffness). Breaking energy (J) is an integration value of force (area under the force/displacement curve) that is required to fracture the bone, or can be defined as the total amount of energy bone must absorb in order to cause a break. The measured energy (J) also reflects the stiffness of bones and is thought to reflect the collagen content of bone.
Statistical analysis
Sample size calculations of eight animals per group were based on femur bone area, with an estimated difference of 0·3 (cm2), an sd of 0·09 (cm2), power of 80 % and significance of 5 %. Data for water and liquid consumption are presented as means with their standard errors. Measurements of weight gain, vitamin D and mineral levels in blood, DEXA and bone biomechanics were analysed by treatment using ANCOVA in Genstat (Genstat for Windows 17th edition; VSN International). Analysis for weights used Day 0 (start of trial at weaning, animals 3 weeks old) weight as a covariate. Analysis for DEXA and bone biomechanics used animal weight at end of trial (Day 34 weight) as a covariate. Means of treatment groups are reported with their corresponding standard errors of difference. Means were compared using Fisher’s unprotected least significant difference test and P values<0·05 were considered significant.
Results
Trial 1
Animal weight gain over the trial
All animals showed a steady weight gain over the course of the trial (Fig. 1). By Day 7, there were no differences between Groups 1, 2, 3 and 4 (standard AIN-93G diet); however, Group 5 (Teklad diet) was heavier (P<0·05) and remained the heaviest group over the remainder of the trial. From Day 10, Groups 1, 3 and 4 were heavier compared with Group 2 (standard AIN-93G with no vitamin D3, plus water; P<0·05). From Day 28, Group 1 (standard AIN-93G with vitamin D3, plus water) was heavier compared with Group 4 (standard AIN-93G with no vitamin D3, plus CSM; P<0·05), whereas Groups 1 and 3 were a similar weight to Group 5 (P<0·05). There were no significant weight differences between Groups 1 and 3 at any of the time points measured, whereas Group 3 (GSM) tended to be heavier compared with Group 4 (CSM).
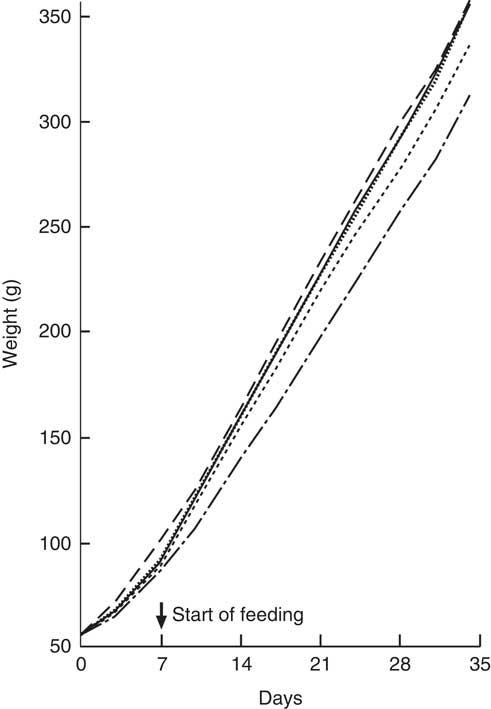
Fig. 1 Trial 1 – mean weight gain over 5 weeks of feeding. At day 0, Groups 1, 2, 3 and 4 were fed standard AIN-93G diet with no vitamin D3, plus water. From days 7 to 35, Group 1 was fed standard AIN-93G diet with vitamin D3. Groups 2, 3 and 4 were retained on standard AIN-93G diet with no vitamin D3. Supplementary feeding with milk containing vitamin D3 began at day 7 (![]() ): Group 3 with goat skimmed milk and Group 4 with cow skimmed milk. Over this time interval, Groups 1 and 2 received water. Group 5 received Teklad diet with vitamin D3 plus water throughout the trial period. Values are group means.
): Group 3 with goat skimmed milk and Group 4 with cow skimmed milk. Over this time interval, Groups 1 and 2 received water. Group 5 received Teklad diet with vitamin D3 plus water throughout the trial period. Values are group means. ![]() , Group 1 – water+D3;
, Group 1 – water+D3; ![]() , group 2 – water−D3;
, group 2 – water−D3; ![]() , group 3 – goat skimmed+D3;
, group 3 – goat skimmed+D3; ![]() , group 4 – cow skimmed+D3;
, group 4 – cow skimmed+D3; ![]() , group 5 – Teklad+D3.
, group 5 – Teklad+D3.
Liquid and solid diet intake
Over the course of the trial, rats consumed increasing volumes of liquid (Table 1). Rats drinking water consumed a smaller volume compared with rats drinking milk. Group 1 drank less water compared with Groups 2 and 5. Rats drinking CSM drank less volume compared with rats drinking GSM. In the final week of feeding, solid food intake (Table 1) was higher in Group 5 (Teklad diet with vitamin D3), followed by Group 1 (standard AIN-93G with vitamin D3). Groups 2, 3 and 4 had similar solid food intakes. In the fourth week of supplementary feeding, the vitamin D3 intake from solid food for Groups 1 and 5 was estimated to be 0·94 and 1·15 µg/rat per d, respectively. In the final week, the vitamin D3 intake from GSM (Group 3) and CSM (Group 4) was estimated to be 0·42, and 0·26 µg/rat per d, respectively.
Table 1 Trial 1 – group daily intake of liquid over 4 weeks of supplementary feeding and solid diet intake in week 4* (Mean intake per group per d for each week, with their standard errors)
GSM, goat skimmed milk; CSM, cow skimmed milk.
* Group 1 received standard AIN-93G diet with vitamin D3. Groups 2, 3 and 4 received standard AIN-93G diet with no vitamin D3. Group 5 received Teklad diet with vitamin D3. Groups 1, 2 and 5 received water. Groups 3 and 4 received GSM and CSM, respectively, both containing vitamin D3.
25-Hydroxyvitamin D levels in plasma
Group 2 (standard AIN-93G with no vitamin D3, plus water) had very low 25(OH)D3 levels (Table 2), with five of eight samples below the limits of detection. Group 1 (standard AIN-93G with vitamin D3, plus water) and Group 5 (Teklad diet with vitamin D3, plus water) had higher levels of 25(OH)D3 compared with milk-fed groups, although the difference between Group 1 and Group 3 (AIN-93G with no vitamin D3, plus GSM) was not significant. Levels of 25(OH)D3 in milk-fed groups were similar. The ratio of the plasma 25(OH)D3 level:dietary vitamin D3 intake was calculated; values for Group 1 and Group 5 were similar (0·89 and 0·78, respectively) and these values were less than half the values of the milk-fed groups. The group fed CSM had a higher ratio value compared with the GSM group (2·45 and 1·70, respectively), reflecting the average milk intake for the two groups over the trial period (33·0 ml/d per rat for the CSM group and 48·5 ml/d per rat for the GSM group).
Table 2 Trial 1 – 25-hydroxyvitamin D3 (25(OH)D3) was measured in plasma and minerals were measured in sera collected from rats at the end of the 4-week supplementary feeding periodFootnote * (Group means with their standard error of difference (SED))
a,b,c,d Mean values within a column with unlike superscript letters are significantly different (ANOVA, P<0·05).
* Over this time, Group 1 received standard AIN-93G diet with vitamin D3. Groups 2, 3 and 4 received standard AIN-93G diet with no vitamin D3. Group 5 received Teklad diet with vitamin D3. Groups 1, 2 and 5 received water. Groups 3 and 4 received goat skimmed milk and cow skimmed milk, respectively, both containing vitamin D3.
Minerals levels in serum
Serum Ca levels were higher in Groups 2 and 4 compared with Groups 1, 3 and 5 (Table 2; P<0·05). Mg and P levels were higher in Groups 1, 3 and 5 compared with Groups 2 and 4 (Table 2: P<0·05). Phosphate levels were also higher in Groups 1, 3 and 5 compared with Groups 2 and 4 (Table 2), with Group 5 having the highest levels. Phosphate levels were not significantly different between milk-fed groups.
Dual-energy X-ray absorptiometry of right femur and spine
The BMC and BMD were determined for the right femur and lumbar spine collected from animals at the end of Trial 1 (Fig. 2 and 3, respectively, adjusted for rat weight at end of trial). The BMC values for Groups 1 and 2 were similar, although the lumbar spine BMD value for Group 1 was higher compared with Group 2 (P<0·05). The milk-fed groups and Group 5 (Teklad diet with vitamin D3, plus water) had similar BMC values for both the right femur and lumbar spine, and these values were higher compared with Groups 1 and 2 (P<0·05). Similarly, BMD values were higher for the milk-fed groups and Group 5 for both the right femur and lumbar spine compared with Groups 1 and 2 (P<0·05). The BMD value for the right femur was higher in Group 5 compared with the milk-fed groups, whereas the BMD values for the spine were similar for all three of these groups.
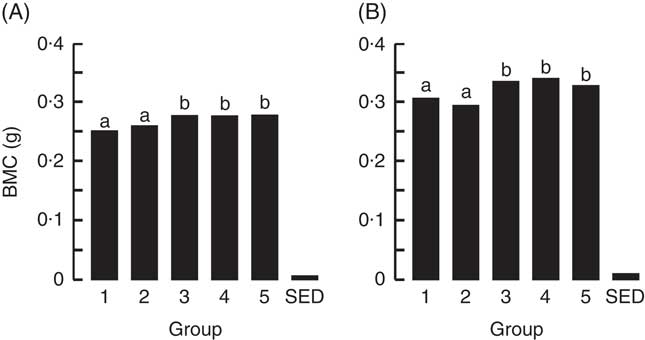
Fig. 2 Trial 1 – bone mineral content (BMC; adjusted for animal weight at end of trial) of right femur (A) and lumbar spine (B) collected at the end of the 4-week supplementary feeding. Over this time, Group 1 received standard AIN-93G diet with vitamin D3. Groups 2, 3 and 4 received standard AIN-93G diet with no vitamin D3. Group 5 received Teklad diet with vitamin D3. Groups 1, 2 and 5 received water. Groups 3 and 4 received goat skimmed milk and cow skimmed milk, respectively, both containing vitamin D3. Values are group means with their standard error of difference (SED). a,b Mean values with unlike letters are significantly different (ANOVA, P<0·05).
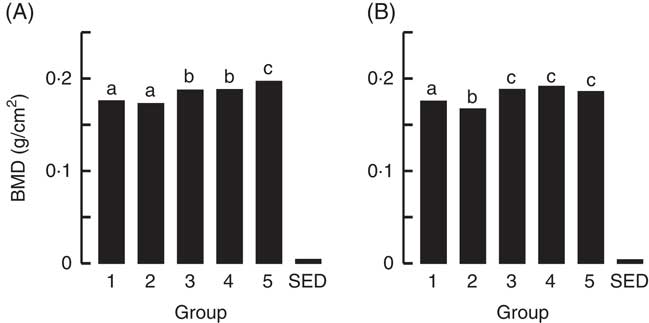
Fig. 3 Trial 1 – bone mineral density (BMD; adjusted for animal weight at end of trial) of right femur (A) and lumbar spine (B) collected at the end of the 4-week supplementary feeding. Over this time, Group 1 received standard AIN-93G diet with vitamin D3. Groups 2, 3 and 4 received standard AIN-93G diet with no vitamin D3. Group 5 received Teklad diet with vitamin D3. Groups 1, 2 and 5 received water. Groups 3 and 4 received goat skimmed milk and cow skimmed milk, respectively, both containing vitamin D3. Values are group means with their standard error of difference (SED). a,b,c Mean values with unlike letters are significantly different (ANOVA, P<0·05).
Bone size and strength
Table 3 shows the biomechanical information for the left femur collected from animals at the end of Trial 1 (adjusted for rat weight at end of trial). The bone lengths for the different groups were not significantly different. Bones from rats in Group 2 could withstand less load (Max N) and fractured at a significantly lower load compared with the milk-fed Groups 3 and 4. Although the Max N value for Group 2 was also lower compared with Groups 1 and 5, values were not significantly different. The stiffness of bones was greater for other groups compared with those from Group 2, which were elastic and deforming permanently. The values for energy (J) showed that Group 2 bones were softer and absorbed more energy before cracking/fracture compared with bones from the other groups. Although energy values for Groups 1, 3, 4 and 5 were all lower than Group 2, only the mean values for Group 3 (GSM) and 5 (Teklad diet) were significantly lower (P<0·05).
Table 3 Trial 1 – wet weight, length, strength and elasticity of left femur (adjusted for animal weight at end of trial) collected at the end of the 4-week supplementary feedingFootnote * (Group means with their standard error of difference (SED))
a,b Mean values within a column with unlike superscript letters are significantly different (ANOVA, P<0·05)
* Over this time, Group 1 received standard AIN-93G diet with vitamin D3. Groups 2, 3 and 4 received standard AIN-93G diet with no vitamin D3. Group 5 received Teklad diet with vitamin D3. Groups 1, 2 and 5 received water. Groups 3 and 4 received goat skimmed milk and cow skimmed milk, respectively, both containing vitamin D3.
Trial 2
Animal weight gain over the trial
All animals showed a steady weight gain over the course of the trial (Fig. 4). By Day 7, there were no differences between groups. From Day 14, Group 1 (modified AIN-93G with vitamin D3) was heavier compared with Group 2 (modified AIN-93G with no vitamin D3) (P<0·05). From Day 14, Group 3 (GSM), Group 4 (GWM) and Group 6 (CWM) were heavier compared with Groups 1 and 2 (P<0·05). Group 5 (CSM) weights were similar to Group 1 and significantly lighter compared with Groups 3 (GSM) and 4 (GWM) from Day 21, but only significantly lighter compared with Group 6 (CWM) on Days 24 and 31.
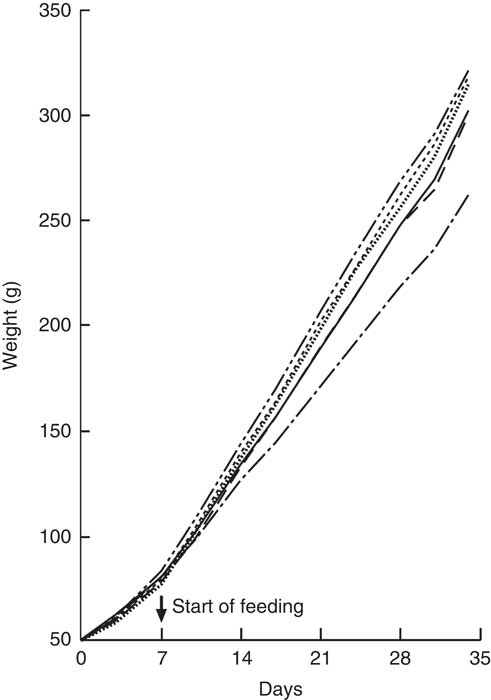
Fig. 4 Trial 2 – mean weight gain over 5 weeks of feeding. At day 0, all rats were fed modified AIN-93G diet containing no vitamin D3, plus water. From days 7 to 35, Group 1 was fed modified AIN-93G diet with vitamin D3. Groups 2, 3, 4, 5 and 6 were retained on modified AIN-93G diet with no vitamin D3. Supplementary feeding with milk containing vitamin D3 began at day 7 (![]() ): Group 3 with goat skimmed milk, Group 4 with goat full-fat milk, Group 5 with cow skimmed milk and Group 6 with cow full-fat milk. Over this time interval, Groups 1 and 2 received water. Values are group means.
): Group 3 with goat skimmed milk, Group 4 with goat full-fat milk, Group 5 with cow skimmed milk and Group 6 with cow full-fat milk. Over this time interval, Groups 1 and 2 received water. Values are group means. ![]() , Group 1 – water+D3;
, Group 1 – water+D3; ![]() , group 2 – water−D3;
, group 2 – water−D3; ![]() , group 3 – goat skimmed+D3;
, group 3 – goat skimmed+D3; ![]() , group 4 – goat full-fat+D3;
, group 4 – goat full-fat+D3; ![]() , group 5 – cow skimmed+D3;
, group 5 – cow skimmed+D3; ![]() , group 6 – cow full-fat+D3.
, group 6 – cow full-fat+D3.
Liquid and solid diet intake
Over the course of the trial, rats consumed increasing volumes of liquid (Table 4). Rats drinking water consumed a smaller volume compared with rats drinking milk. Rats drinking WM tended to consume less compared with rats drinking SM. However, volumes of CSM consumed were much lower compared with volumes of GSM. In the fourth week of supplementary feeding, solid food intake (Table 4) was higher in Group 1 (modified AIN-93G with vitamin D3, plus water) and Groups 3 and 5 (modified AIN-93G with no vitamin D3, plus SM) compared with Group 2 (AIN-93G with no vitamin D3, plus water) and Groups 4 and 6 (AIN-93G with no vitamin D3, plus WM). In the 4th week of supplementary feeding, the vitamin D3 intake for Group 1 was estimated to be 0·50 µg/rat per d from solid food, and 0·26, 0·25, 0·19 and 0·22 µg/rat per d from milk, for Groups 3, 4, 5 and 6, respectively.
Table 4 Trial 2 – group daily intake of liquid over 4 weeks of supplementary feeding and solid diet intake in week 4Footnote * (Mean intake per group per day for each week with their standard errors)
GSM, goat skimmed milk; GWM, goat full-fat milk; CSM, cow skimmed milk; CWM, cow full-fat milk.
* Over this time, Group 1 received modified AIN-93G diet with vitamin D3. Groups 2, 3, 4, 5 and 6 received modified AIN-93G diet with no vitamin D3. Groups 1 and 2 received water. Groups 3, 4, 5 and 6 received GSM, GWM, CSM and CWM, respectively, all containing vitamin D3.
25-Hydroxyvitamin D levels in plasma
Group 2 (modified AIN-93G with no vitamin D3, plus water) had very low 25(OH)D3 levels (Table 5). Group 1 (modified AIN-93G with vitamin D3, plus water) had higher levels of 25(OH)D3 compared with milk-fed groups (P<0·01). Levels of 25(OH)D3 in milk-fed groups were similar. The ratio of the plasma 25(OH)D3 level to dietary vitamin D3 intake was calculated; the value for Group 1 (1·31) was 2- to 3-fold lower compared with the milk-fed groups. Groups 5 (CSM) and 6 (CWM) had the highest ratios (3·88 and 3·33, respectively). Values for Groups 3 (GSM) and 4 (GWM) were similar (2·78 and 2·89, respectively).
Table 5 Trial 2 – 25-hydroxyvitamin D3 (25(OH)D3) was measured in plasma and minerals were measured in sera collected from rats at the end of the 4-week supplementary feeding periodFootnote * (Group means with their standard error of difference (SED))
a,b,c Mean values within a column with unlike superscript letters are significantly different (ANOVA, P<0·05).
* Over this time, Group 1 received modified AIN-93G diet with vitamin D3. Groups 2, 3, 4, 5 and 6 received modified AIN-93G diet with no vitamin D3. Groups 1 and 2 received water. Groups 3, 4, 5 and 6 received goat skimmed milk, goat full-fat milk, cow skimmed milk and cow full-fat milk, respectively, all containing vitamin D3.
Minerals levels in serum
Serum Ca levels were higher in Group 1 (modified AIN-93G with vitamin D3, plus water) compared with all the other groups (Table 5; P<0·05), with levels for all other Groups being similar. Mg levels were also similar for all groups, with the highest Mg level in Group 4 (GWM) and the lowest in Group 1. Phosphate levels were similar in the milk-fed groups, with higher levels compared with water-fed groups. Of all the groups, Group 2 had the lowest level of phosphate (P<0·05).
Dual-energy X-ray absorptiometry of right femur and spine
The BMC and BMD for the right femur and lumbar spine collected from animals at the end of Trial 2 are shown in Fig. 5 and 6, respectively (adjusted for rat weight at end of trial). Group 1 (modified AIN-93G with vitamin D3) and Group 2 (modified AIN-93G with no vitamin D3) had similar BMC and BMD values except for the BMC value of the lumbar spine, which was 1·3-fold higher for Group 1 compared with Group 2 (P<0·05). All milk-fed groups had similar BMC and BMD values for both the right femur and lumbar spine. The exception to this was that the femur BMC value for Group 6 (CWM) was lower compared with Group 3 (GSM) and the lumbar spine BMD value for Group 5 (CSM) was lower compared with Group 6 (CWM). All BMC and BMD values for the milk-fed groups were significantly higher compared with both Groups 1 and 2, except for the lumbar spine BMC value for Group 6 (CWM), which was similar to the value for Group 1.
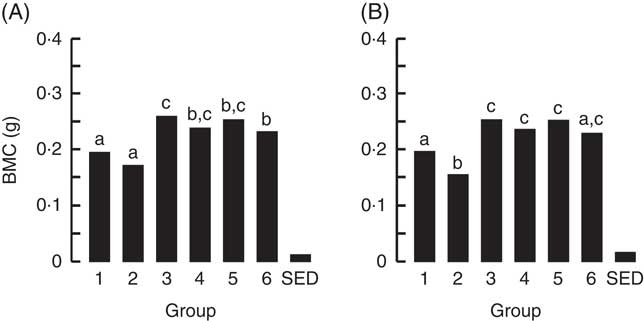
Fig. 5 Trial 2 – bone mineral content (BMC; adjusted for animal weight at end of trial) of right femur (A) and lumbar spine (B) collected at the end of the 4-week supplementary feeding. Over this time, Group 1 received modified AIN-93G diet with vitamin D3. Groups 2, 3, 4, 5 and 6 received modified AIN-93G diet with no vitamin D3. Groups 1 and 2 received water. Groups 3, 4, 5 and 6 received goat skimmed milk, goat full-fat milk, cow skimmed milk and cow full-fat milk, respectively, all containing vitamin D3. Values are group means with their standard error of difference (SED). a,b,c Mean values with unlike letters are significantly different (ANOVA, P<0·05).

Fig. 6 Trial 2 – bone mineral density (BMD; adjusted for animal weight at end of trial) of right femur (A) and lumbar spine (B) collected at the end of the 4-week supplementary feeding. Over this time, Group 1 received modified AIN-93G diet with vitamin D3. Groups 2, 3, 4, 5 and 6 received modified AIN-93G diet with no vitamin D3. Groups 1 and 2 received water. Groups 3, 4, 5 and 6 received goat skimmed milk, goat full-fat milk, cow skimmed milk and cow full-fat milk, respectively, all containing vitamin D3. Values are group means with their standard error of difference (SED). a,b,c Mean values with unlike letters are significantly different (ANOVA, P<0·05).
Bone size and strength
Table 6 shows the biomechanical information from the left femur collected from animals at the end of Trial 2 (adjusted for animal weight at end of trial). The femurs collected from Group 2 were significantly shorter compared with all other groups. The required fracture loads (Max N) for rats in Groups 1 and 2 were similar, and significantly lower compared with bones from rats in Groups 3 (GSM) and 5 (CSM). The fracture load for the skimmed-milk-fed groups was higher compared with the full-fat-fed groups, although only Group 3 (GSM) was significantly higher. The elasticity was less for Groups 1 and 2 compared with all the milk-fed groups, reflecting lower mineralised bones for Groups 1 and 2 and consistent with the DEXA results.
Table 6 Trial 2 – wet weight, length, strength and elasticity of left femur (adjusted for animal weight at end of trial) collected at the end of the 4-week supplementary feedingFootnote * (Group means with standard error of difference (SED))
a,b,c Mean values within a column with unlike superscript letters are significantly different (ANOVA, P<0·05).
* Over this time, Group 1 received modified AIN-93G diet with vitamin D3. Groups 2, 3, 4, 5 and 6 received modified AIN-93G diet with no vitamin D3. Groups 1 and 2 received water. Groups 3, 4, 5 and 6 received goat skimmed milk, goat full-fat milk, cow skimmed milk and cow full-fat milk, respectively, all containing vitamin D3.
Discussion
In our study, we investigated the benefits of supplementing vitamin D in milk using a model of young growing rats with vitamin D deficiency. The animals fed insufficient vitamin D over the course of the two trials (Group 2) had very low serum 25(OH)D3, which shows that the model did result in Vitamin D deficiency. We found that circulating levels of serum 25(OH)D3 were higher in groups fed vitamin D in the solid food compared with groups fed vitamin D in milk and was likely because of the higher estimated intake of vitamin D from solid food. This outcome was the same for both trials, feeding either the standard AIN-93G diet with casein as the protein source or modified AIN-93G with egg albumin as the protein source. However, although the vitamin D intake was 2- to 4-fold higher from solid food, serum 25(OH)D3 levels were only 1- to·2-fold higher in those animals that consumed this food compared with animals drinking milk containing vitamin D3. This may suggest that the bioavailability of vitamin D3 from milk is greater compared with incorporating the vitamin into solid food.
We found little difference in serum 25(OH)D3 levels when the fat-soluble vitamin D3 was supplemented into full-fat milk compared with skimmed milk, with this outcome being the same for both cow milk and goat milk (Trial 2). The response of serum 25(OH)D3 levels to supplementation is reported to vary widely among individuals, and the presence of foods may influence this. Perfusion experiments in rats have demonstrated that PUFA decreased vitamin D3 absorption( Reference Hollander, Muralidhara and Zimmerman 27 ). However, in human studies, absorption of supplemental vitamin D3 with either fat or non-fat meals have shown inconsistent results for improvements in serum 25(OH)D3 levels( Reference Dawson‐Hughes, Harris and Palermo 28 – Reference Tangpricha, Koutkia and Rieke 30 ). Vanderhout et al. found that children consuming higher milk-fat percentage milk supplemented with vitamin D had higher vitamin 25(OH)D3 levels compared with consumption of low-fat fortified milk( Reference Vanderhout, Birken and Parkin 14 , Reference Vanderhout, Birken and Parkin 15 ). Generally, studies in young children have shown improved vitamin D status with consumption of fortified milk( Reference Sidnell, Pigat and Gibson 31 , Reference Houghton, Gray and Szymlek-Gay 32 ).
Our trial data demonstrated that offering vitamin D3 in milk reversed the effects of vitamin D deficiency and increased bone mineralisation parameters, resulting in stronger more resilient bones with higher resistance to fracture. In addition, providing vitamin D3 in milk improved BMC and BMD values compared with providing vitamin D in the AIN-93G diets. This observation was the same for both trials, feeding either the standard or modified AIN-93G with different sources of protein. Animals fed milk did tend to be heavier compared with water-fed animals, with this being most apparent in Trial 2. Therefore, for bone parameter comparisons, end of trial body weight was used as a covariate based on the rationale that the weight of an animal has an impact on bone mechanics( Reference Masarwi, Gabet and Dolkart 33 , Reference Bozzini, Champin and Alippi 34 ). In this way, the changes reported were over and above those that may be attributable to weight differences.
Interestingly, animals fed the vitamin D-sufficient grain/plant protein-based rodent diet (Teklad diet) had BMC and BMD values very similar to the milk-fed groups and for these parameters also outperformed animals fed vitamin D-sufficient AIN-93G (Trial 1). On the other hand, groups fed different vitamin D-sufficient solid diets could not be differentiated by their biomechanical bone data. The Teklad diet used in Trial 1 did contain soyabean meal as an ingredient. A study has reported that soya protein prevented bone loss in an ovariectomised rat model when compared with a diet containing casein as protein( Reference Arjmandi, Alekel and Hollis 35 , Reference Ghisolfi, Fantino and Turck 36 ), although it was not identified whether the change was due to the protein itself or to the presence of isoflavones in the soyabean preparation. A study that directly compared casein protein and soya protein, with and without the addition of soya isoflavones, found no effects of isoflavones, at the levels tested, and no differences between protein source( Reference Cai, Zhao and Glasier 37 ).
Comparison of our two trials showed a marked difference in bone mineralisation for those animals fed vitamin D-sufficient AIN-93G with different protein sources (Group 1). Animals fed the standard AIN-93G containing milk casein had higher BMC and BMD values compared with animals fed modified AIN-93G containing egg albumin. Interestingly, comparison of Group 3, fed GSM with vitamin D in both trials, also showed similar effects: lower BMC and BMD values in Trial 2 using egg albumin as protein in the AIN-93G diet, compared with Trial 1, even though Group 3 also had casein provided in the milk. All in all, these results suggest that in a growing rat model dietary protein source has an effect on bone mineralisation. Casein phosphopeptides, naturally formed during enzymatic digestion of casein, have been shown to improve Ca absorption( Reference Tsuchita, Suzuki and Kuwata 38 – Reference Bennett, Desmond and Harrington 40 ), although bone mineralisation may not be similarly improved( Reference Yuan and Kitts 41 ). Further work is required to determine whether providing casein as protein in solid food improved bone mineralisation or whether egg albumin was detrimental. Egg albumin does contain avidin, which is known to have a high affinity for binding vitamin B7 (biotin)( Reference Adil 42 ). However, the modified AIN-93G diet was further supplemented with 1 % biotin to counter any potential effects of avidin reducing vitamin B7 levels in the animals fed this diet. The modified AIN-93G was also supplemented with additional P to provide the recommended dietary intake of this mineral, similar to the level in standard AIN-93G diet where an amount of P is provided by the casein.
Our findings suggest that using milk as a vehicle to deliver vitamin D is advantageous. This was two-fold. First, there was increased uptake of vitamin D3 supplied in milk compared with supplementing the vitamin in a solid food matrix. Second, those animals fed supplemented milk also had increased bone strength and resilience. While rat studies cannot be directly translated to humans, the action of vitamin D3 is very similar in the two species. Human studies show that supplementation with vitamin D has proven beneficial for bone health, especially for at-risk groups such as infants and young children( Reference Wagner and Greer 43 ), as well as older people( Reference Bischoff-Ferrari, Willett and Wong 44 ). Using milk as a vehicle for vitamin D supplementation allows for improved compliance, particularly in young children for whom milk is a major food. Interestingly, we found no difference in the uptake or bioavailability of vitamin D when supplemented in skimmed milk and full-fat milk, and no difference between cow or goat milk.
Our results are limited by the aspect that the diets were fed ad libitum. Groups consumed different amounts of solid and liquid diet, resulting in different weight gains. However, to compensate for these differences, we used end of trial weight as a covariate, when analysing the bone data. Another limitation was the length of time the animals were maintained on the trial diets. This may not have been long enough to deplete the vitamin reserves supplied by the mother’s milk because the half-life of the vitamin D metabolite 25(OH)D3 is 15 d( Reference Jones, Assar and Harnpanich 45 ). On the other hand, that Group 2 animals fed no vitamin D3 had very low or undetectable blood levels of 25(OH)D3 suggests that the length of trial time was adequate.
We conclude that when undertaking bone studies with dietary interventions that include dairy, it is important to have a control diet that is free of casein or other milk-derived proteins. However, alternative protein sources may also confound experimental results because of the presence of other bone-active factors, such as soya protein containing isoflavones. Future work would be to directly compare the effect of dietary protein on bone mineralisation, using a broader range of proteins. Overall, this study showed that effects of vitamin D3 deficiency in solid diets were reversed by offering milk supplemented with vitamin D3, and suggests that using milk as a vehicle to deliver vitamin D is advantageous.
Acknowledgements
The authors thank Daralyn Hurford, Julie Cakebread, Ric Broadhurst and Anne Broomfield for their expert assistance in animal experiments and laboratory analyses, Harold Henderson for his expert assistance with the statistical analysis and Pauline Hunt for her expert presentation of the figures.
This work was supported by a grant from the New Zealand Ministry of Business, Innovation and Employment (Contract C10×1203). The Ministry had no role in the design, analysis or writing of this article. The Dairy Goat Co-operative (NZ) Ltd provided milk powders for the study.
The authors’ contributions were as follows: A. J. H. and C. G. P. conceptualised and designed the study; O. A. M. W. conducted the experiments; A. J. H., C. P. and M. C. K. analysed and interpreted the data; A. J. H. wrote the first draft of the manuscript; and all authors critically reviewed the manuscript and approved the final content.
None of the authors has any conflicts of interest to declare


