


Colorectal cancer (CRC) is the third most common cause of cancer deaths worldwide( 1 , 2 ) and the second most frequent cancer in Argentina( Reference Ferlay, Soerjomataram and Ervik3 ). Epidemiological studies have shown that some factors linked to glucose metabolism seem to be involved in the aetiology of several cancers( Reference Giovannucci4 – Reference Sieri, Muti and Claudia7 ).
Intake of most carbohydrates (CH) increases blood serum glucose and blood serum insulin but that depends on CH type and processing, the intake amount and the presence of other nutrients contained in the food. These variations are captured by the glycaemic index (GI), which is defined as the incremental area under the blood glucose response curve after eating 50 g of glucose or white bread. The GI is represented as a percentage of the response to the same CH amount from a standard food taken by the same subject( 8 ). The foods containing CH that are quickly digested, absorbed and metabolised are considered high-GI foods (>70), whereas those slowly digested, absorbed and metabolised are considered low-GI foods (<30)( Reference Augustin, Kendall and Jenkins9 ). The GI measures CH quality, and its value is independent of the serving size or the amount of CH consumed. The glycaemic load (GL) is a measure that takes into account the CH amount in a portion of food and estimates the impact on the blood serum glucose; it is calculated by multiplying the GI by its total CH content and dividing the total by 100( Reference Sieri, Krogh and Agnoli10 ).
Dietary GL is the sum of the GL of all foods consumed in the diet( Reference Sieri, Krogh and Agnoli10 ). Per gram of CH, foods with a high GI produce a higher peak in postprandial blood glucose and a greater overall blood glucose response during the first 2 h after consumption, unlike foods with a low GI( Reference Foster-Powell, Holt and Brand-Miller11 , Reference Wolever12 ).
It is suggested that a dietary intake with a high GI induces a greater insulin response, which contributes to keeping higher insulin blood levels and insulin-like growth factors (IGF)( Reference Stoll13 ). These analogues, particularly IGF-1, promote mitosis and cell proliferation and, at the same time, inhibit cell apoptosis, thereby producing uncontrolled cell growth. This may increase the risk of developing any type of cancer, including CRC( Reference Biddinger and Ludwig14 ).
Evidence suggested that frequent eating is also involved in the aetiology of this cancer: it results in an increased secretion of bile acids into the gut lumen, and both dihydroxylation and deconjugation by colonic bacteria induce the conversion of these bile acids into secondary bile acids, which may have tumourigenic effects( Reference Liu, Tang and Zhai15 ). Since a frequent food intake can be harmful and could be related to CRC, it is of interest to evaluate the CRC association with the frequent intake of high-GI food, which would also generate regular imbalances in the metabolism.
Several studies provide suggestive information about the relationship between the quality/quantity of dietary CH and CRC development( Reference Sieri, Krogh and Agnoli10 , Reference Huang, Fang and Xu16 – Reference Choi, Giovanucci and Lee18 ). A recent review has also uncovered consistent evidence that the risk of CRC is increased by a diet inducing high blood glucose levels. Particularly, a high GI was associated with a higher CRC occurrence in cohort and case–control studies( Reference Sieri and Krogh19 ), though the weekly intake of high-GI foods was seldom object of scrutiny.
In Argentina, several epidemiological studies have been conducted to explore the relationship between eating habits and cancer; however, no specific information is yet available about dietary GI and the associated GL for this population related to CRC. We hypothesise that a high dietary GI and GL and/or a frequent dietary intake of high-GI foods could be associated with CRC development.
Thus, the aim of the current study was to examine the characteristics of diverse quality, frequency and quantity indicators of CH intake in the population of Córdoba (Argentina) and to estimate their association with CRC development in a case–control study.
Methods
Study population
A case–control study was performed from January 2008 to December 2016 in the framework of the Environmental Epidemiology of Cancer and other Chronic diseases group. Participants were residents of Córdoba, the second most populated Argentinian province (3·3 million people)( 20 ). To calculate the sample size, the annual incidence of CRC of Córdoba and the operative capacity for approximately 8 years were considered. To guarantee a power of 95 % of the statistical tests to be used, at least two controls are identified for each case. A total of 492 participants aged 21–90 years were interviewed, including 161 subjects with incident histologically confirmed diagnosis of CRC (ICD-10th edition, CIE10: C18–C20), with no previous diagnosis of cancer in other sites (cases) as well as 331 controls. The cases were identified by pathology departments or through oncologists’ referrals in public and private healthcare institutions throughout the province of Córdoba; the controls were selected based on the geographical residence of cases.
Controls were chosen from the general population living in the same neighbourhoods and time periods as the cases, using a multistage sampling design as follows: numerous neighbourhood blocks were randomly selected; in each of these, four houses were visited until finding two to three controls per case frequency matched by sex and age (±5 years). On average, 10 % of the people invited to take part in the interview refused to participate (response rate 92 % in cases and 89 % in controls).
All subjects were asked about their personal history of illness through a structured questionnaire to exclude those with a personal history of any neoplastic disease or any condition likely to result in long-term diet modification (e.g. diabetes, coeliac disease, renal insufficiency).
This study was conducted in accordance with the Declaration of Helsinki and the respective national laws( 21 ). All procedures involving human subjects were approved by the Ethical Committee of the Faculty of Medical Sciences, University of Córdoba. A written informed consent was provided by all subjects.
Data collection
All participants were interviewed by centrally trained and routinely supervised nutritionists. The interview focused on socio-demographic characteristics, occupational history, smoking habits, use of purge and non-steroidal anti-inflammatory drugs, self-reported anthropometric characteristics, physical activity, medical insurance, personal medical history and family history of cancer.
The socio-economic status was determined on the basis of aspects such as income, educational level and occupation of the household’s main earner( Reference Gottfried22 ). The physical activity was measured using the International Physical Activity Questionnaire( 23 ). The frequency, duration and intensity of physical activity were then expressed as the metabolic equivalent of tasks (MET)( Reference Serón, Muñoz and Lanas24 ). Subsequently, MET were categorised into low (<600 MET), moderate (600–1500 MET) and high (>1500 MET) categories of physical activity intensity.
Dietary assessment
To assess dietary exposure, a validated FFQ of 127 items( Reference Navarro, Osella and Guerra25 ) was completed. Subjects were asked about their dietary intake over the 5 years before diagnosis (cases) or interview (controls). The FFQ was coupled with a validated photographic atlas based on standard serving sizes in Argentina( Reference Navarro, Cristaldo and Díaz26 ). The seasonal pattern of consumption for each vegetable or fruit was also taken into account by averaging the intake amount across a particular season throughout the year. The database of food composition used for daily intake quantification (energy content, ethanol, macro and micronutrients) includes a nutritional food composition table of Argentina( Reference Mazzei and Puchulu27 ) and information from other biochemical determinations made at the local level( Reference Navarro, Muñoz and Lantieri28 ).
To compute the average daily GI and GL, we assigned GI values to the seventy-two CH-containing foods or food groups from the FFQ and differentiated their GI according to whether they were raw or cooked. These values were based on the recent international tables of GI and GL( Reference Foster-Powell, Holt and Brand-Miller11 , Reference Atkinson, Foster-Powell and Brand-Miller29 ), from which we chose the GI values of foods typically found on the Argentinian market. The GI was expressed as a percentage of the glycaemic response using white bread as a standard food with a GI of 100. The average daily GI for a subject’s diet was computed by summing the products of the GI value of each food, multiplying the amount of available CH and then dividing it by the total amount of available CH consumed per d. The average daily GL (g) was calculated by adding up the products of the GI value of each food times the amount of available CH consumed per d divided by 100. Each GL unit represents the equivalent of 1 g of CH from white bread.
Statistical analysis
Categorical variables and health status (with or without CRC) associations were evaluated using χ 2 tests. A Student’s t test was performed to compare the mean values of nutrient intake between cases and controls. Missing data for each variable of interest were reported in the tables. To assess the association of quality, frequency and quantity of CH intake indicators with CRC, multilevel logistic regression models( Reference Rabe-Hesketh and Skrondal30 ) for the binary response (one for a CRC case, 0 for control) were estimated. A hierarchical structure in the data was assumed to capture the inter-individual variability and to assess individual-level variable effects such as the association between the exposure variables and the outcome. Subjects were included in a first level nested in a second level, that is, the extent of urbanisation defined as a scale aggregating subjects by the population size of their place of residence. This variable was defined according to three categories: >1 million inhabitants, 30 000–1 000 000 inhabitants and <30 000 inhabitants. A total of four models were fitted including tertiles (based in controls) of the GI, the GL, high-GI food intake (g/d) or weekly intake of high-GI foods as exposure variables. Sex, age (years), BMI (BMI=weight (kg)/height (m)2), socio-economic status (high, medium and low), energy intake (kJ/d), physical activity (low/moderate/high) and family history of CRC (yes/no) were included as adjusting variables at first level. The smallest reasonable number of covariables was included in the models. Some variables were not chosen since they were not associated with CRC (e.g. alcohol consumption data not shown). The models were also stratified by sex. OR and 95 % CI were obtained by adjusting for the mentioned covariates. The Stata® 15.1 software( 31 ) was used for data analysis, and α<0·05 (two sided) was used as the criterion for assessing statistical significance.
Results
Table 1 shows a summary of the characteristics of CRC cases and controls. Ages ranged from 21 to 90 (mean age: 63 years), and 53 % of participants were men. Cases had lower socio-economic status than controls (P<0·001), while overweight and obesity prevalence was similar in both groups (>60 %). Furthermore, the daily energy intake, the CH intake, as well as the GI and GL, were higher in cases than in controls (P<0·001). None of the subjects had low-GI food intake (<30) (Table 1).
Table 1 Characteristics of study participants according to their bio-socio-cultural data* (Numbers and percentages)

MET, metabolic equivalent of task; CH, carbohydrate; GI, glycaemic index; GL, glycaemic load.
* Case–control study of colorectal cancer in Córdoba, Argentina (2008–2016).
† Cut point based on Augustin et al. ( Reference Augustin, Kendall and Jenkins9 ) criterion.
Cases and controls showed a similar distribution of smoking habits and physical activity.
Mean values of GI and GL were 79·38 (sd 6·57) and 291·72 (sd 134·88), respectively, and they were higher in cases than in controls (P<0·001) (Table 2). Cases showed a higher weekly consumption of high-GI foods than controls (forty-two times per week − six times per d − v. thirty-eight times per week − five times per d, respectively, P<0·001) (Table 2).
Table 2 Mean glycaemic index (GI), glycaemic load (GL) and food intake of different GI foods (g/d and frequency of consumption)* (Mean values and standard deviations)
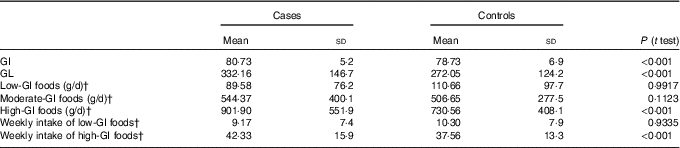
* Case–control study of colorectal cancer in Córdoba, Argentina (2008–2016).
† Low-GI foods: GI <30; moderate 30–70; high >70( Reference Tasevska, Jiao and Cross34 ).
Table 3 illustrates the adjusted OR and the corresponding 95 % CI for CH intake indicators. Subjects in the third tertile of GL and weekly intake of high-GI foods had significantly higher odds for CRC than the reference (OR 1·64; 95 % CI 1·16, 2·34; OR 1·11; 95 % CI 1·09, 1·14, respectively). When stratified by sex, the highest category of GI and GL, and the weekly intake of high-GI foods showed a positive association with CRC in women (OR 2·12; 95 % CI 1·38, 3·27; OR 1·98, 95 % CI 1·24, 3·18 and OR 1·41, 95 % CI 1·09, 1·83, respectively). In men, the second tertile of GL and weekly intake of high-GI foods were associated with CRC presence (OR 1·44, 95 % CI 1·04, 1·99 and OR 1·48, 95 % CI 1·32, 1·65, respectively) (Table 3). The homogeneity test did not show differences by sex (P>0·05, data not shown).
Table 3 Association between quality and quantity indicators of carbohydrate intake and colorectal cancer* (Odds ratios and 95 % confidence intervals)

T, tertile; GI, glycaemic index.
* Case–control study of colorectal cancer in Córdoba, Argentina (2008–2016).
† Sex (only for the entire sample), energy intake, BMI, socio-economic status, smoking habits (ever smoker–never smoker), analgesic consumption and family history of colorectal cancer were included as covariates at the first level and urbanisation at the second level.
‡ Cutpoints of tertiles based on controls distributions: GI: all: T1 77·25, T2 82·50; men: T1 78·29, T2 82·85; women: T1 75·29, T2 80·74. Glycaemic load: all: T1 200·38, T2 298·66; men: T1 213·98, T2 315·76; women: T1 194·03, T2 270·79. Intake of high-GI foods (g/d): all: T1 494·5, T2 803·28; men: T1 512·95, T2 891·12; women: T1 458·12, T2 743·09. Intake of high-GI foods (times/week): all: T1 31·12, T2 41·37; men: T1 31·37, T2 42·25; women: T1 31, T2 40·75.
The presence of a CRC family history was closely linked to CRC development, with OR of up to 2. Besides, the BMI showed a weak association with CRC in models including GL as covariate. On the other hand, the energy intake, socio-economic status, smoking habits and analgesic consumption did not show an association with CRC (data not shown).
Discussion
In this population-based case–control study, a high GL of dietary intake and an elevated weekly intake of high-GI foods were associated with the odds of developing CRC in the entire population. When stratified by sex, similar results were observed for those indicators and a high GI of dietary intake was associated with CRC in women.
Studies analysing the same indicators and their association with CRC in Argentina are not available; therefore, comparing results at the local level has been difficult. Mean values of dietary GI and GL in the present study were 79·38 (sd 6·57) and 291·72 (sd 134·88), respectively. These values are higher than those shown in other studies with similar population characteristics regarding sex and age (55 % men and mean age 56 years): 68·7 (sd 4) for GI and 165·7 (sd 38·9) for GL( Reference Huang, Fang and Xu16 ). When comparing the results with different studies, it was taken into account that the GI tables used were those created by Foster-Powell et al.( Reference Foster-Powell, Holt and Brand-Miller11 ).
Cancer is a complex pathology, and its incidence and survival indexes are closely related to social, cultural and socio-economic determinants of health( Reference Gonzalez-Segura, Secchi and Carrica32 ). Numerous studies have investigated the dietary GI and GL as potential risk factors in several cancers. Overall, results indicate a positive association with some types of cancer( Reference Rossi, Lipworth and Polesel33 – Reference Qin, Moorman and Alberg35 ), and some of them indicate a positive association specifically with CRC( Reference Zelenskiy, Thompson and Tucker36 – Reference Gnagnarella, Gandini and La Vecchia38 ). A case–control study( Reference Zelenskiy, Thompson and Tucker36 ) observed an inconsistent association between GL and CRC; the results showed that compared to the first quartile of GL, the OR for the second through the upper quartiles were 1·38 (95 % CI 1·06, 1·80), 1·67 (95 % CI 1·30, 2·13) and 1·61 (95 % CI 1·25, 2·07), respectively (P trend <0·0001). Similarly, a meta-analysis( Reference Gnagnarella, Gandini and La Vecchia38 ) analysing twenty-four cohort studies and fifteen case–controls studies also found that dietary GI as GL were related to an increased risk of CRC; the summary results for GI and GL were 1·26 (95 % CI 1·11, 1·44) and 1·18 (95 % CI 1·05, 1·34), respectively.
Furthermore, in a large population-based study, an association was found between high levels of blood glucose and the risk of CRC in men( Reference Vulcan, Manjer and Ohlsson39 ); summary results for high v. low quartile of blood glucose were 1·72 (95 % CI 1·05, 2·84) for the entire population, meanwhile for men it was almost double the risk 2·80 (95 % CI 1·37, 5·70). Instead, we found that women developed a higher CRC risk in comparison with men and, in some cases, an increase in CRC risk was observed only in women. Certainly, that study had specifically examined the relationship of the disease with a high level of blood glucose, which might be an effect of high-GI food intake, whereas we had assessed the food intake of the subjects. In a cohort of aging Caucasian adults( Reference Makarem, Bandera and Lin40 ), GI and GL were not associated with the risk of adiposity-related cancers (CRC among them) combined or any of the site-specific cancers. However, higher consumption of low-GI foods, such as legumes, was associated with 36 % lower risk of adiposity-related cancers combined. The protective impact of legumes was more pronounced among women, for whom legume consumption was associated with 43 % lower risk of adiposity-related cancers. However, the protective effect of low-GI foods, particularly legumes, on cancer risk may be because these foods are rich in phytoestrogens, namely, isoflavones, which have weak oestrogenic properties and putative anti-oestrogenic effects( Reference Messina41 ) that may reduce the risk of female adiposity-related cancers.
No associations of GI and GL with CRC were found in two meta-analyses( Reference Aune, Chan and Lau42 , Reference Mulholland, Murray and Cardwell43 ). The first one( Reference Aune, Chan and Lau42 ) included fourteen cohort studies, and the second one, fourteen articles, exploring the relationship between GI, GL and CRC and adenomas. In the latter, there was a non-significant increased risk of CRC in the highest category of GI intake when all studies were combined; it was attributable to case–control study results and was subject to a marked heterogeneity. Other studies( Reference Bao, Nimptsch and Meyerhardt44 , Reference Flood, Peters and Jenkins45 ) showed no associations of the indicators with CRC. Bao et al. (44) had specifically studied the intake of those foods that increase the area under the insulin response curve and they found no relation with CRC. Furthermore, Flood et al. (45) had found that GL, though not significantly associated with the risk of adenoma in women, had a significant inverse association with distal adenomas in men( Reference Flood, Peters and Jenkins45 ).
On the other hand, in an extensive review Turati et al. ( Reference Turati, Galeone and Gandini17 ) found an increased risk of CRC with higher dietary GI (summary results 1·16, 95 % CI 1·07, 1·25). Besides, another review reported that, in contrast with the results obtained in this study, a high dietary GI, but not GL, was significantly and consistently associated with increased CRC risk in both cohort and case–control studies( Reference Sieri and Krogh19 ). More recently, the dietary GI was positively associated with CRC risk (ORquartile 4 v. 1 3·10; 95 % CI 2·51, 3·85), but no evidence supported dietary GL intake as related to an increased risk of CRC in a Chinese population( Reference Huang, Fang and Xu16 ).
Previous results from our study showed that the two patterns containing high-GI foods increased the risk of CRC development. A higher adherence to the ‘southern cone’ pattern (with a combination of starchy vegetables, red meat and wine intake) increases the odds by 50 % (OR 1·5; 95 % CI 1·0, 2·2), and the highest tertile of adherence to the ‘high-sugar drink’ pattern (with predominance of soda and juice intake) almost quadrupled the odds (OR 3·8; 95 % CI 2·0, 7·1) compared with the first tertile( Reference Pou, Díaz M del and Osella46 ).
Wang et al. ( Reference Wang, Uchida and Ohnaka47 ) identified CRC as being associated with sugar and sugary drink intake (both of them with GI values higher than 70) in smoking men with no usual alcohol intake. In this study, the weekly intake of high-GI foods was significantly associated with the disease; however, no association was found with the average daily consumption of those foods.
In this study, a higher weekly intake of high-GI foods was significantly associated with the disease; however, no association was found with g/d intake of high-GI foods. To date, the authors did not find other works examining the weekly intake of high-GI foods as an indicator of the quality/quantity of CH intake. A meta-analysis( Reference Liu, Tang and Zhai15 ) from 2014, which included fifteen studies, explored the association between eating frequency of all kind of foods and the risk of CRC; they found a modest evidence of an increased risk of CRC in case–control studies. One of the plausible physiological mechanisms to support the relationship between eating frequency and risk of CRC involves bile acids. It has been suggested that eating frequently results in an increased secretion of bile acids into the gut lumen and that dehydroxylation and deconjugation by colonic bacteria induce these bile acids to convert into secondary bile acids, which may have tumourigenic effects( Reference Nagengast, Grubben and van Munster48 , Reference Cheah49 ). However, prospective studies suggest an inverse association between eating frequency and CRC risk, with evidence of effect modification by diet composition( Reference Perrigue, Kantor and Hastert50 ). People spend most of their lives in the postprandial state since the true fasting state occurs only in the last 2 h of a regular night sleep( Reference Monnier51 ); therefore, quality of food consumed will be key in the effect on health. Currently most of the foods consumed frequently are ultra-processed products( Reference Rauber, da Costa Louzada and Steele52 , Reference Silva, Giatti and de Figueiredo53 ), which are mainly foods of poor quality (e.g. higher in CH of elevated GI and GL as well as low in dietary fibre and energy dense)( Reference Fardet, Méjean and Labouré54 ). The main hypothesised mechanisms for GI and GL and their association with CRC are related to hyperinsulinaemia and insulin resistance, given that insulin acts as a growth factor and increases the bioavailability and bioactivity of IGF, such as IGF-1, by enhancing their synthesis and by decreasing their binding proteins. IGF-1 can promote tumour development by inhibiting apoptosis, thus stimulating cell proliferation and sex-steroid synthesis( Reference Augustin, Kendall and Jenkins9 ). Higher-GI foods induce larger blood glucose fluctuations over the day than lower-GI foods. A frequent consumption of high-GI foods would imply a constant exposure to hyperinsulinaemia and its deleterious metabolic effect.
Besides, a systematic review( Reference Buyken, Goletzke and Joslowsky55 ) identified several observational studies that reported the relevance of dietary GI/GL, fibre or whole-grain intake for chronic low-grade inflammation. The evidence from thirty-one intervention studies do not report a benefit of increasing fibre or whole-grain intake for low-grade inflammation, whereas several intervention studies do support a potential role of dietary GI or GL( Reference Du, van der A and van Bakel56 – Reference Van Woudenbergh, Kuijsten and Sijbrands59 ). The mechanism whereby high-GI food intake may contribute to both acute and chronic low-grade inflammation and, in turn, promote the CRC development, is through oxidative stress( Reference Dickinson, Hancock and Petocz60 ). The excessive postprandial blood glucose excursions are considered to yield nitric oxide, which in turn combines with superoxide to produce peroxynitrite − a potent long-lived pro-oxidant molecule( Reference Ceriello61 ).
Some methodological issues concerning case–control studies need to be considered. These include information bias related to the knowledge of disease status or ‘recall bias’( Reference Ardila and Gómez62 ) − characterised by a propensity of cases to overestimate their exposure in the past − and selection bias.
To avoid bias due to confounding, we used a detailed procedure manual and considered all known confounding factors in the design of the study. Moreover, our interviewers were trained and the data collection was standardised as much as possible. The participation rate in cases was higher than in controls (92 and 89 %, respectively), given that the oncologists put cases on notice about the visit of members of our team for an interview. Although interviewers visited controls at their homes without previous notification, presenting their identification credentials as members of a research team facilitated their acceptance. The control sample seems to be representative of the Argentinean population. For instance, the prevalence of obesity (21·75 %) and of smoking habit (21 %) in controls was similar to that reported for the adult population of Argentina (20·8 and 25·1 %, respectively)( 63 ).
FFQ may be prone to error; however, the reproducibility of the FFQ used has been accurately tested for epidemiological cancer studies( Reference Navarro, Cristaldo and Díaz26 ). Previous studies about the validity of the results derived from case–control studies conducted by the research group were satisfactory( Reference Becaria Coquet, Tumas and Osella64 , Reference Becaria Coquet, Muñoz and Díaz65 ). Sensibility analysis regarding confounding, selection bias and information bias have also shown reasonably good results. The data showed acceptable correlations between FFQ and 24-h dietary recalls, suggesting that dietary intake is generally well measured( Reference Navarro, Cristaldo and Díaz26 ). This case–control study also benefits from using population-based rather than hospital-based data, thus avoiding Berkson’s bias (where hospital controls might not represent the prevalence of exposure in the community where cases come from). Controls came from the same geographical ‘catchment area’ as the cases and both, cases and controls, share mostly the same interview setting (the home). All of these procedures contribute to minimising both selection and information biases.
Finally, estimates may not accurately reflect the glycaemic effects of mixed dishes and prepared foods because GI measures the value of each food individually, and in the case of mixed meals it would be necessary to know how they were prepared and whether they were combined with other types of food.
In conclusion, this study provides evidence that a high GL and an elevated weekly intake of high-GI foods increase the risk of CRC in the population under study.
Taking this as a starting point, we postulated the need to promote a low-GI and -GL diet. This can be followed by reducing the quantity and the weekly intake of foods rich in simple CH and refined flours, such as honey, cooked vegetables, baked goods, non-whole grains, candies, among others and using strategies of food preparation and appropriate food combinations.
Epidemiological studies are designed to sample subjects from a particular population, so that the study population is representative of the target population. Once the nature and order of magnitude of an effect are established by maximising validity, the generalisation to other groups is simpler( Reference Maldonado and Greenland66 ). This is particularly important in our study, as it has been conducted in a scenario where the known and well-recognised risk factors for this pathology are widely and strongly distributed in the entire Argentine population.
Acknowledgements
The authors acknowledge the National Scientific and Technical Research Council for C. N.’s fellowship, the National Interuniversity Council for E. H.’s fellowship, the Córdoba Tumour Registry and the physicians who contributed to this study. The authors wish to give special thanks to the people who kindly agreed to participate. The authors are also indebted to Gabriela Díaz, a certified English translator graduated from our University for critically reading the manuscript.
This work was supported by the National Agency for Scientific and Technological Promotion (grants PICTO 2006 – 36035, PICT 2008 – 1814 and PICT 2012 – 1019) and the Science and Technology Department of the University of Córdoba (grants 361/16).
E. H. and V. L. D. carried out data collection, participated in the analysis of data and drafted the manuscript. L. R. A. and M. P. D. coordinated the procedures and revised critically the manuscript. A. R. O. and C. N. designed the study and contributed significantly in the discussion and the statistical analysis. All authors read and approved the final manuscript.
The authors declare that there are no conflicts of interest.


