1. Introduction
Boiling is widely used across many industries as a heat transfer mode, owing to its high heat transfer capability. Moreover, boiling heat transfer offers an attractive solution in this era of digitalisation to dissipate high thermal loads of electronic equipment. Hence, an accurate understanding and modelling of boiling heat transfer are essential in designing efficient heat transfer equipment. Unfortunately, the current understanding of boiling from a fundamental viewpoint is still immature. As a consequence, the majority of mathematical models are empirical, which requires case-by-case fine-tuning. Advanced component scale computational fluid dynamics (CFD) models (Colombo & Fairweather Reference Colombo and Fairweather2016), which are essentially macroscopic in nature, rely on heat flux partitioning. Such heat flux partitioning models depend on bubble dynamics, particularly bubble departure characteristics and their associated heat transfer phenomena (Baglietto, Demarly & Kommajosyula Reference Baglietto, Demarly and Kommajosyula2019). However, the bubble growth process is very complex, involving interactions between sub-processes occurring on nano to macro scales. Notably, in atmospheric conditions, during the bubble growth process, a thin liquid layer is trapped beneath the bubble and is widely known as a microlayer (Cooper & Lloyd Reference Cooper and Lloyd1969). The first experimental observation of the microlayer was done by Moore & Mesler (Reference Moore and Mesler1961); they attributed the temperature fluctuations at the bubble base to the formation of the microlayer. Proper quantifications related to the microlayer were done by Cooper & Lloyd (Reference Cooper and Lloyd1969) using thin-film thermometers to measure the transient thermal fluctuations at the bubble base in pool boiling. Sharp (Reference Sharp1964) was the first to use the interferometry technique to visualise the profile of the microlayer. Later, many researchers advanced the technique and quantified the microlayer behaviour (Jawurek Reference Jawurek1969; Koffman Reference Koffman1983). They all reported a wedge-shaped microlayer, which increased monotonously from the nucleation site (real contact line) to the outer periphery. In the last decade, quantification of microlayers has been done using thin-film interferometry (TFI) (Gao et al. Reference Gao, Zhang, Cheng and Quan2012; Suryanarayan & Srivastava Reference Suryanarayan and Srivastava2021) and infrared (IR) thermal imaging (Jung & Kim Reference Jung and Kim2015; Bucci, Buongiorno & Bucci Reference Bucci, Buongiorno and Bucci2021) in pool boiling. Sinha, Narayan & Srivastava (Reference Sinha, Narayan and Srivastava2022) conducted experiments on a vertical flow boiling channel and analysed microlayer thickness evolution beneath a single vapour bubble using TFI. During the bubble growth cycle, the microlayer evaporates and substantially contributes to the bubble's growth while cooling the heater substrate. However, there is no consensus among the researchers on the quantum of contribution of the microlayer towards overall bubble growth (Giustini et al. Reference Giustini, Jung, Kim, Ardron and Walker2019), although the importance of microlayer evaporation as a crucial phenomenon for bubble growth dynamics has been highlighted in the literature.
The presence of a microlayer underneath the bubble is also considered while calculating the evaporation heat flux in heat flux partitioning, with some correction factors to account for the influence of bubble interactions in the calculation of dry area (Baglietto et al. Reference Baglietto, Demarly and Kommajosyula2019). However, the complex microlayer characteristics underneath interacting bubbles are not appreciated in the current heat flux partitioning models. Given its significant contribution towards bubble growth (a few authors have quoted this contribution even up to 60 %; Sato & Niceno Reference Sato and Niceno2015), it is essential to consider the decrease in microlayer spread (if any) while calculating the evaporation heat flux. Without such considerations, the microlayer contribution towards the overall heat transfer is expected to be overestimated, at times significantly. Usually, even in research works involving interface tracking to study the bubble coalescence, researchers do not resolve the microlayer, instead rely on a sub-grid model to account for microlayer evaporation (as done by Mukherjee & Dhir Reference Mukherjee and Dhir2004). Unfortunately, current sub-grid models for microlayer evaporation do not account for any depletion of the microlayer due to the interaction of bubbles.
Moreover, one of the recent works has emphasised the need for an accurate description of the microlayer's shape and thickness profile for a reasonable estimate of bubble growth, even in the case of single vapour bubble nucleation in flow boiling (Vadlamudi et al. Reference Vadlamudi, Sinha, Srivastava and Singh2022). As in practical boiling applications, multiple bubbles form on the heater substrate and, due to the possible interaction of these bubbles (depending on their relative spacings), microlayer characteristics will not be the same as in single nucleation cases. Given the high contribution of the microlayer towards bubble volumetric growth, it is essential to understand the microlayer characteristics involved in such boiling systems.
In the past, studies on bubble interactions have primarily been limited to the pool boiling configuration. For instance, interacting nucleation sites have been previously reported with natural (Jones & Judd Reference Jones and Judd2003; von Hardenberg et al. Reference von Hardenberg, Kenning, Xing and Smith2004) as well as artificial cavities (Bonjour, Clausse & Lallemand Reference Bonjour, Clausse and Lallemand2000; Zhang & Shoji Reference Zhang and Shoji2003). Researchers tried to classify the interaction type based on the relative distance between the nucleations (S) and departure diameter (D) using the S/D ratio (Judd & Chopra Reference Judd and Chopra1993; Zhang & Shoji Reference Zhang and Shoji2003). Zhang & Shoji (Reference Zhang and Shoji2003) tried to explain different types of interactions based on their pool boiling experiments on artificial nucleation sites using radiation thermometry. They observed that when S/D > 3, no interaction took place. They suggested that hydrodynamic interaction takes place when 1.5 < S/D < 2, and hydrodynamic and thermal interaction come into play when 1.5 < S/D < 2, while hydrodynamic, thermal and coalescence take place when S/D < 1.5. Recently, Kangude & Srivastava (Reference Kangude and Srivastava2022) have also classified the type of bubble interactions based on the observations made through simultaneous application of high-speed videography and IR thermography under pool boiling conditions.
Despite some works being comprehensive, the conclusions obtained from such works still have a lot of scope for improvement due to the limited spatial and temporal resolution of measurement techniques employed in these experimental works. Some of the notable contributions include the work by Bonjour et al. (Reference Bonjour, Clausse and Lallemand2000) who conducted pool boiling experiments with three artificial sites on a duraluminium surface and reported that coalescence enhanced the heat transfer coefficient based on substrate surface temperature measurements using thermocouples. The authors attributed these observations to the presence of a microlayer without any direct evidence. In contrast, with relatively improved spatial and temporal measurements of the substrate surface temperature using a high-speed IR camera, Golobic, Petkovsek & Kenning (Reference Golobic, Petkovsek and Kenning2012) did not find any heat transfer enhancement after the coalescence of bubbles. In addition, many recent experimental studies have reported the interaction of bubbles using IR cameras (Richenderfer et al. Reference Richenderfer, Kossolapov, Seong and Bucci2018; Jung & Kim Reference Jung and Kim2019) and even the total reflection technique (Jung & Kim Reference Jung and Kim2019; Choi et al. Reference Choi, Chu, Kim, Jeon and Jo2020).
One of the other major limitations of the earlier reported works lies in the fact that these studies have primarily been limited to the pool boiling configuration only and hence the impact of bulk flow inertia on such interactions could not be accounted for. Moreover, the available literature also shows that while the hydrodynamic interaction of bubbles is appreciated in boiling conditions, the phenomenon of depletion of the microlayer has not yet been given its due attention. This becomes even more important because depletion of the microlayer has a strong thermal impact as well (Kangude & Srivastava Reference Kangude and Srivastava2022). Even separating the two effects is very challenging. Chen et al. (Reference Chen, Hu, Hu, Utaka and Mori2020) used TFI to study the microlayer characteristics for the whole range of nucleate boiling in pool boiling conditions. They reported the microlayer thicknesses at various heat flux levels involving multiple bubbles in pool boiling and even indicated the possible presence of a liquid macrolayer during the interaction of bubbles. However, the study itself is not focused on studying the hydrodynamic interaction of bubbles. Noting that observations reported in these works have relied primarily on photography or IR thermometry with limited resolution techniques, advanced experimental approaches such as thin-film interferometry or total internal reflection have the potential to further improve upon the current understanding of bubble interaction mechanism(s).
To the best knowledge of the present authors, there is no availability of any experimental study involving multiple nucleations related to microlayers in the context of the flow boiling regime. Unlike pool boiling, the microlayer associated with a single vapour bubble in flow boiling is characterised by an asymmetric profile (Sinha et al. Reference Sinha, Narayan and Srivastava2022). Therefore, one can expect complicated microlayer(s) dynamics when multiple bubbles are involved in flow boiling. The interaction of bubbles may decrease the spread and thickness of the associated microlayers depending on the relative spacing between the interacting bubbles. As the microlayer contributes significantly toward the overall bubble growth and influences the bubble dynamics, it is important to understand the depletion of microlayers (if any) in the case of interacting bubbles. Hence, the microlayer and bubble dynamics in multiple bubble interactions, particularly two-bubble interactions, have been investigated experimentally using simultaneous TFI and high-speed photography techniques in flow boiling using water as the working fluid.
2. Experimental setup
Experimental setup, optical layout and data reduction methodology are discussed in detail in the present section. Flow boiling experiments were conducted in a 750 mm long vertical stainless-steel test channel with a rectangular cross-section of 5 × 10 mm2 with an upward flow configuration. The schematic of the complete experimental setup is shown in figure 1. To achieve boiling of the working fluid (water), a 200 mm long heating substrate was installed on one side of the test channel, 400 mm from the inlet of the test section. Additionally, three 75 mm long high-quality optically transparent windows were fixed on the remaining sides at 440 mm from the inlet to visualise the bubble dynamics. The heating substrate is made of transparent borofloat glass (1.1 mm thick, 10 mm wide) coated with an electroconductive layer of fluoride tin oxide (FTO). To achieve joule heating in the FTO-coated heating substrate and to control the applied heat flux during boiling experiments, the heater is connected to a variable DC power supply unit (Aplab, India; range 0–130 V and 0–5 A).

Figure 1. Schematic of the complete experimental setup assembly: (a) heater section indicating the neck region; (b) test channel; and (c) sectional view indicating the positions of the optical windows.
To ensure controlled nucleation site(s) (single/two nucleation sites) and to avoid any possibility of randomly generated multiple vapour bubbles on the heater substrate, the FTO layer was partially etched in a semi-circular manner resulting in a 2 mm wide neck formation (465 mm from the inlet section). This configuration increased the local electrical resistance and resulted in individual (and controlled) nucleations at the neck position (as shown in figure 1a). A thermostated water bath (Julabo), equipped with a preheater, was used to adjust the temperature of the working fluid with an accuracy level of ±0.1 K. The capacity of the water bath is 10 litres, and it has a provision to pump the fluid. An in-line rotameter (CVG, Technocraft, India) was used to control the flow in the test channel.
2.1. Optical layout
Figure 2 shows the schematic of the optical configuration of TFI. TFI is employed to determine the transients associated with the thickness and spread of the microlayer associated with the bubble growth process. The three main components of this arrangement are a monochromatic light source (He–Ne laser with output power 12 mW and wavelength 632.8 nm), a spatial filter and a beam splitter. The spatial filter, which includes a microscopic objective (4×) and a circular aperture of 50 μm, in combination with a collimating lens (focal length 350 mm), has been used to collimate the light beam emerging from the laser source to a size of 20 mm. As shown in the figure, the collimated light strikes the nucleation site from the rear side of the heating surface after passing through the beam splitter (50 : 50).

Figure 2. Schematic representation of the optical arrangement for thin-film interferometry and side-view photography for simultaneous mapping of microlayer dynamics and bubble growth behaviour.
The light beam passes through the heater, and a part of the collimated beam is reflected from the heater surface–liquid interface, while the transmitted part gets reflected at the liquid–vapour (bubble) interface. These reflected beams interfere with each other and, depending upon the extent of relative path length difference, result in the formation of a fringe pattern (set of alternate dark and bright bands). The resultant beam passes through the beam splitter and gets reflected onto a high-speed camera. In the experiments reported, the microlayer dynamics was captured at 10 000 frames per second (fps) using a high-speed camera HSC1 (Phantom, VEO 410L) along with a 12× telecentric zoom lens (Navitar) with a 0.25× adapter and zoom extender system with a spatial resolution of 6.8 μm pixel−1. The entire setup was mounted upon a vibration isolation table (Holmarc, India) to avoid any external disturbances to the phenomena under investigation through TFI.
The methodology for quantifying the transients associated with the microlayer thickness using TFI during pool as well as flow boiling configurations has been extensively discussed in some of our previous works (Suryanarayan & Srivastava Reference Suryanarayan and Srivastava2021; Sinha et al. Reference Sinha, Narayan and Srivastava2022) as well as in the studies reported by a few other researchers (Jung & Kim Reference Jung and Kim2014; Utaka et al. Reference Utaka, Hu, Chen and Morokuma2018). In view of this, the associated details have not been reported here to avoid repeatability. In brief, the relationship between the fringe number and the height of the microlayer at any pixel location of the thin film interferometric image can be expressed as follows:
 \begin{gather}2{n_o}\ {h_{micro}} = \lambda N\ (\textrm{Destructive}\ \textrm{interference}),\end{gather}
 \begin{gather}2{n_o}\ {h_{micro}} = \lambda (2N - 1)/2\ (\textrm{Constructive}\ \textrm{interference}),\end{gather}
where no is the refractive index of water at saturation temperature, hmicro is the local microlayer thickness, N is the fringe number and λ is the wavelength of the light source (632.8 nm). The maximum uncertainty in identifying the location of the fringes is limited to 5 pixels, which corresponds to approximately 34 μm. Furthermore, in synchronisation with TFI, high-speed photography was employed to study the bubble dynamics from the side view. To illuminate the visualisation window from one side, an LED light source (GSVITEC Germany, 84 W) was used, while a high-speed camera HSC2 (IDT Vision) with a 7× zoom lens system (Navitar) was mounted on the other side to capture images at 5000 fps with a resolution of 7.75 μm pixel−1 (figure 2). The software trigger signal from HSC1 simultaneously triggered both the cameras (HSC1 and HSC2), and hence allowed for simultaneous mapping of the process of bubble growth as well as microlayer dynamics.
2.2. Data reduction methodology
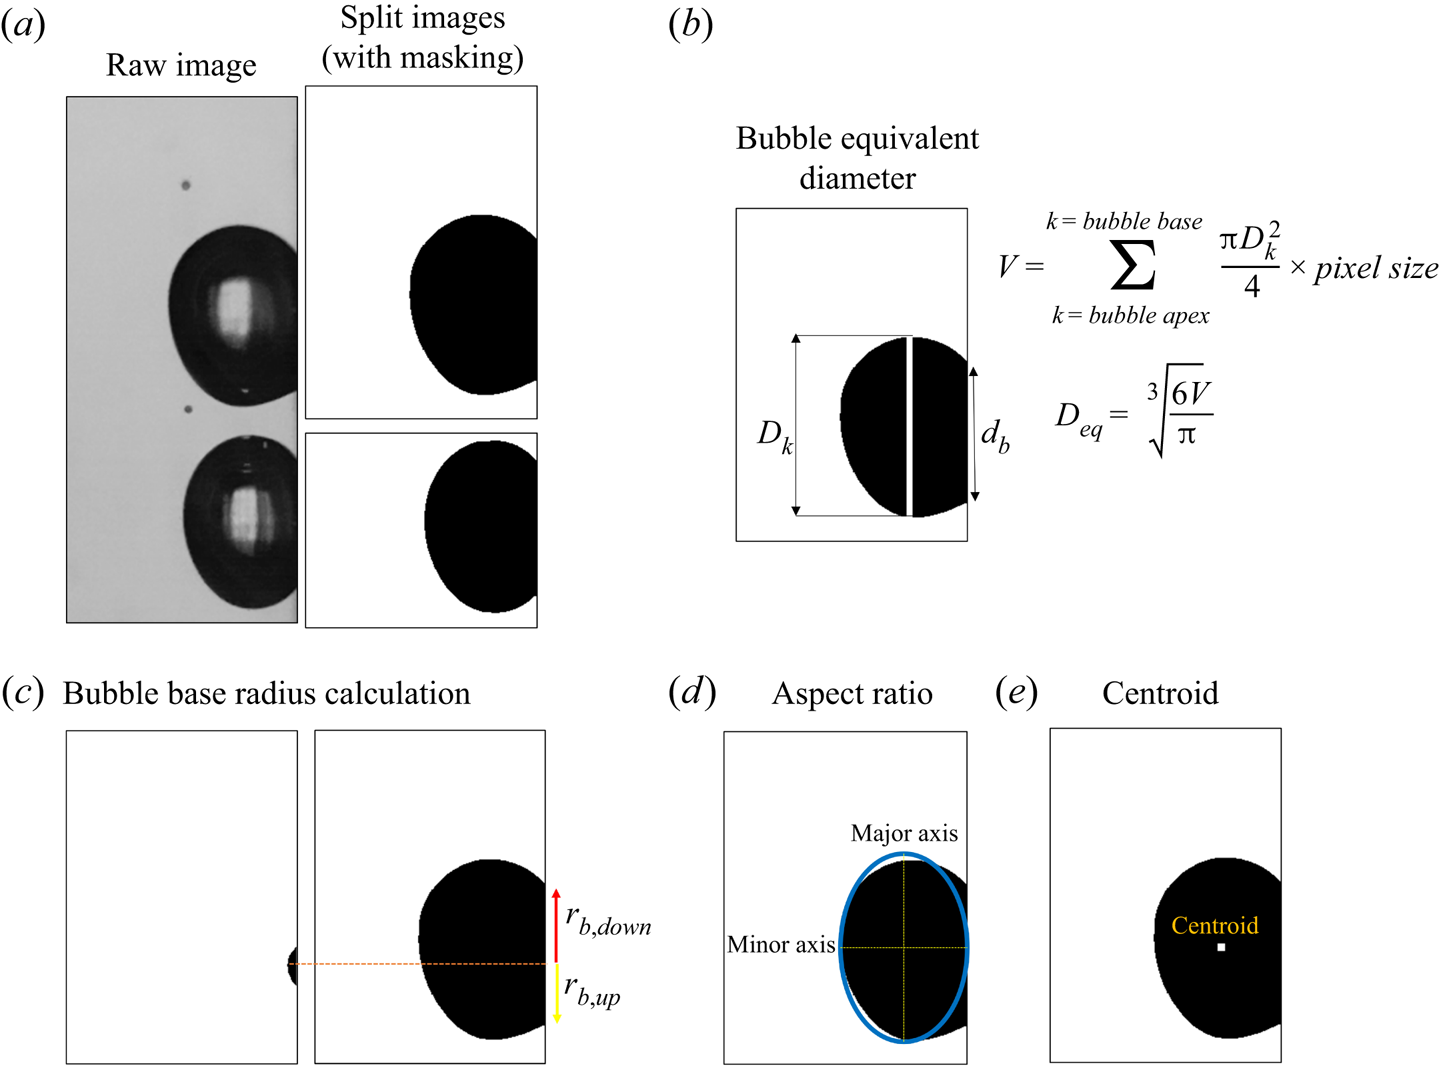
Videographic images obtained from a side view through HSC2 were used to measure some of the important parameters associated with the boiling phenomena, such as bubble equivalent diameter, bubble base radius, bubble aspect ratio and bubble centroids. The flow of methodology adopted to determine bubble dynamics parameters is shown in figure 3. Each raw image involving two bubbles is split into two images containing one bubble each. Thereafter, the bubbles are masked both manually as well as using an in-house developed MATLAB code based on Otsu thresholding (Otsu Reference Otsu1979). The maximum error in the masking procedure has been found to be limited to 5 pixels, corresponding to 37.78 μm. The masked images are then used to obtain the bubble dynamics parameters. The bubble equivalent diameter has been obtained through a methodology in which the volume of the vapour bubble is represented by the sum of the discretised volume of disks from the bubble base to its apex. A stack of disks of varying diameter (Dk) and thickness equal to one pixel has been employed for the estimation of the bubble volume. Subsequently, the equivalent bubble diameter has been determined from the volume. Figure 3(b) shows the approach followed to determine the bubble equivalent diameter. This methodology provides a reasonable estimate of bubble equivalent diameter in a single nucleation case. The methodology is also discussed by many authors and, in the recent past, by Sinha et al. (Reference Sinha, Narayan and Srivastava2022).

Figure 3. (a) Representative raw image and split images; (b) pictorial flow of methodology for calculating bubble equivalent diameter; (c) bubble base radius calculation methodology; (d) and (e) methodologies adopted to determine bubble's aspect ratio and centroid, respectively.
The upstream and downstream bubble base radii are calculated by measuring the dimension of pixels from the centre of the bubble base (which is the centre in the first frame of the nucleation) using MATLAB as well as open-source software Image J on raw images. The maximum error in the process is roughly three pixels, which corresponds to approximately 22.66 μm. At each time instant, i.e. in each split image, the coordinates of the centroid are calculated using the following formulation:
 \begin{equation}\bar{x} = \frac{{\sum {{x_i}{A_i}} }}{{\sum {{A_i}} }},\quad \bar{y} = \frac{{\sum {{y_i}{A_i}} }}{{\sum {{A_i}} }}.\end{equation}
Here, i corresponds to each pixel and A is the area of a pixel. Similar to the methodology adopted by Sinha et al. (Reference Sinha, Narayan and Srivastava2022), the bubble's aspect ratio (AR) has been measured from the ratio of minor to major axes of the fitted ellipse at any given instant. The velocity of the liquid at the bubble's centroid height is calculated using Reichardt's turbulent single-phase flow model and vbulk/vw = 0.05, where vbulk and vw are the bulk liquid and friction velocities, respectively (Yoo, Estrada Perez & Hassan Reference Yoo, Estrada Perez and Hassan2021).
The parameters upstream microlayer radius and downstream microlayer radius are also shown in figure 4(a). Bubbles in the downstream and upstream directions are referred to as top and bottom bubbles, respectively. The first time instant where the depletion of primary nucleation's microlayer is seen along the second bubble's direction in thin-film interferograms is referred to as the depletion time (tdep).

Figure 4. (a) Microlayer upstream and downstream radii; (b) representative two-nucleations case with indications of top and bottom bubbles, as referred to in the present work.
3. Results and discussions
To understand the influence of bubble interaction on microlayers, experiments have been conducted in the vertical channel at inlet subcooling of 2 K and inlet flow rate of 50 lph (Re = 6000). As discussed in § 2, bubble dynamics have been recorded from the side view using a high-speed camera, and microlayer fringe pattern evolution (obtained through thin film interferometry) from the bottom of the heater substrate using another high-speed camera simultaneously (further details are reported by Sinha et al. Reference Sinha, Narayan and Srivastava2022). Before dwelling on the details of microlayer dynamics in the case of interacting multiple bubbles, it is essential to understand the dynamic interaction between the bubble and microlayer in the case of single vapour bubble nucleation to appreciate the new findings. Hence, § 3.1 discusses the bubble and microlayer dynamics of a single vapour bubble under the flow boiling configuration. The subsequent sections are dedicated to the interaction of microlayers of two vapour bubbles.
3.1. Bubble and microlayer dynamics of a single vapour nucleation
This section considers a representative case (ΔTsub = 2 K and 80 kW m−2) for single nucleation in the flow boiling configuration. Unlike pool boiling, the microlayer spread is not uniform in all directions; nevertheless, the microlayer radius is directly proportional to the bubble base radius in both upstream and downstream directions. Figure 5 shows the temporal evolutions of AR, apparent upstream bubble base radius (rb,up) and upstream microlayer radius (rm,up).

Figure 5. (a) Evolution of aspect ratio (AR), upstream bubble base radius (rb,up) and upstream microlayer radius (rm,up) for single nucleation; (b) temporal evolution of non-dimensional numbers (ND), Wegr and We for single nucleation; (c) snapshots of bubble and microlayer dynamics at various time instances.
During the initial stages of bubble growth, until approximately 0.5 ms (as indicated by the blue region in figure 5a), the aspect ratio almost remained constant, and the bubble and microlayer upstream radii increased with time. However, after 0.5 ms, the bubble and microlayer upstream radii decreased and the aspect ratio increased. This result indicates a relation between bubble shape dynamics and microlayer dynamics. In the absence of bubble growth, buoyancy and liquid inertia, the shape dynamics of the bubble are governed by the liquid–vapour interfacial tension. The liquid–vapour interfacial tension tries to make the bubble spherical. However, during the initial stages of bubble growth, the growth rate of the bubble is quite high; consequently, the liquid inertia and added mass effect will be strong during that phase. Unfortunately, the formulations that calculate the growth force (which is usually considered to account for liquid inertia and added mass effect) suffer serious shortcomings (Bucci et al. Reference Bucci, Buongiorno and Bucci2021) and cannot be used to reasonably estimate the bubble dynamics.
As an alternative, one can track a non-dimensional Weber number based on the growth rate of the bubble (dReq/dt), i.e.  $W{e_{gr}} = {\rho _l}{(\textrm{d}{R_{eq}}/\textrm{d}t)^2}{D_{eq}}/\sigma $, where ρl is the liquid density, Deq is the equivalent diameter and σ is the surface tension. Figure 5(b) shows the temporal variation of Wegr along with We (Weber number based on liquid velocity at the height of centroid location (Vl)). Initially, Wegr is more than one, indicating that growth is dominant compared to capillary forces. With time, the bubble growth rate (dReq/dt) decreases, leading to a decrease in Wegr; as Wegr goes below one, the capillary force starts dominating and the aspect ratio (characterising the bubble shape) changes quite significantly. The shape change facilitates the liquid movement towards the upstream bubble base, resulting in the movement of the upstream edge of the microlayer in the flow direction. No depletion of the microlayer has been observed from the downstream direction (opposite to the flow direction). Overall, the microlayer does not deplete as long as the bubble growth is dominant. Moreover, the We number is less than one; it never played a dominant role in the investigated cases during the initial stages of bubble growth (in the growth-dominated regime). In parallel to the microlayer's depletion from the upstream side due to the inward movement of bulk fluid, the microlayer depletes from the inside due to its evaporation and hydrodynamic movement of the contact line in all directions. The microlayer depletion from the bottom (upstream) is significant in the present case, as indicated by the thin-film interferograms of microlayers shown in figure 5(c). The microlayer depletion from upstream continues and the entire upstream microlayer depletes (figure 5c, t = 2.5 ms). Eventually, the dry spot and the downstream microlayer also disappear. Such microlayer dynamics described in the section differs significantly from the case of multiple nucleations.
Our past experiments (Vadlamudi et al. Reference Vadlamudi, Sinha, Srivastava and Singh2022) on single vapour bubbles in flow boiling indicated that at lower flow rates (for instance, at Re = 2400), after the bubble growth-dominated phase (Wegr < 1), Eo is generally greater than 1, implying that buoyancy dominates the depleting mechanism, while We remains below 1. However, higher flow rate conditions (Re = 6000) result into Eo < 1 (close to zero) and We > 1 indicating the negligible impact the buoyancy has over capillary and inertial forces on the depletion of the microlayer after the growth-dominated phase (Wegr < 1).
Realising that, under flow boiling configuration, the microlayer depletes due to the coupled effect of buoyancy and flow, an attempt was made to reduce the relative contribution from buoyancy. Due to the choice of a higher flow rate (Re = 6000), the Eo value is less than 1 in all the single and multiple bubble cases (before the bubble coalescence). Hence, the choice of Re value, as employed in the present set of experiments, has reduced the plausible influence of buoyancy. In addition, to reduce the impact of subcooling on the bubble dynamics, the inlet subcooling to be 2 K has been considered for the multiple nucleation cases. Furthermore, the maximum heat flux supplied to the heater is also optimised so as to not get the heater crowded with multiple nucleation sites (and hence randomly generated multiple bubbles), in which case, distinguishing individual bubbles would not be possible to explain any hydrodynamic interaction.
3.2. Impact of secondary nucleation on bubble movement/motion
The bubble movement can be influenced by secondary nucleation in its vicinity. Particularly, if a second bubble nucleates in the downstream direction with respect to the primary nucleation, the motion of the first (primary) bubble alters significantly. Figure 6(a) shows the displacement of the centroids of the two bubbles with time. In the representative case shown in figure 6, the first nucleation occurred on the upstream side, i.e. at the bottom (of the visual domain). After t = 1.5 ms, the second nucleation occurred on the downstream side (figure 6b), i.e. at the top. The movement of the first bubble, as indicated by the displacement of the centroid, halted (for approximately 0.4 ms) due to secondary nucleation in its downstream (figure 6a). The first (primary) bubble's shape also changed significantly; it appears as if it has been squeezed from one end (figure 6b). As soon as the second bubble started to move, the first bubble also started to move again in the flow direction.

Figure 6. (a) Temporal evolution of centroid displacement (dc,f) in flow direction for both the nucleations and (b) temporal evolution of the (primary) bubble lift-off process due to the second (secondary) nucleation in the downstream direction.
Figure 6(b) shows an interesting phenomenon of possible interaction between these two bubbles. After the secondary nucleation, the shape of the first bubble changed, eventually leading to the first bubble's early lift-off (figure 6b, t = 2.3 ms). Due to the growth of the second bubble, the liquid surrounding the bubble is accelerated and, as a consequence, the bubble lift-off process of the first bubble is accelerated. The mechanism pertaining to accelerated bubble lift-off can be properly appreciated with the knowledge of microlayer depletion, which will be discussed in the next section. Overall, this result emphasises that secondary nucleation in the downstream direction can cause a reduction in bubble lift-off time or at least hinder the movement of the first bubble and distort its shape. However, the reduction in bubble lift-off time or the hindrance of bubble movement due to secondary nucleations is not usually appreciated (and/or accounted for) in the boiling models by researchers.
3.3. Interaction of two bubbles and its impact on microlayers
Even without any apparent contact of bubbles, two bubbles can hydrodynamically interact with each other. As discussed in § 3.2, the second nucleation in the vicinity of the first bubble can alter the dynamics of the first bubble. Such secondary nucleation in the presence of a microlayer beneath the first bubble may lead to the depletion of the first bubble's microlayer. As microlayer evaporation contributes quite significantly towards bubble growth, understanding the microlayer's depletion is vital to assess the bubble dynamics and evaluate the associated heat transfer. To show the impact of secondary nucleation on the primary nucleation's microlayer, a case where the secondary nucleation occurs in the downstream direction (top side) is shown in figure 7.

Figure 7. Microlayer dynamics associated with interacting bubbles (primary nucleation at the bottom and secondary nucleation in the downstream direction (at the top)).
It can be observed that the growth of secondary nucleation strongly depletes the primary nucleation's microlayer in the downstream direction (for example, at t = 1.7 and 2.5 ms), which is not usually to be seen in a single bubble case. The liquid inertia imparted due to secondary nucleation's growth helps deplete the primary nucleation. After the growth-dominated phase of secondary nucleation, the hydrodynamic interaction of two bubbles led to the depletion of the microlayer of the secondary nucleation (for example, at t = 3.3 and 4.1 ms). Moreover, due to hydrodynamic interaction with primary nucleation, the secondary nucleation's microlayer also depletes first in the direction of primary nucleation asymmetrically (unlike the single nucleation case). These results indicate the importance of bubbles’ hydrodynamic interaction in the microlayer depletion.
Furthermore, even when the bubbles are far apart and interact hydrodynamically, the microlayer characteristics are different from a single nucleation case. To show such an interaction, a two-bubble interaction case is described from the perspective of microlayer dynamics to appreciate the coupled growth dynamics of bubbles. The primary nucleation occurred in the downstream direction (on the top), followed by secondary nucleation in the upstream direction (bottom) in the selected case (figure 8). From the side view, the two nucleation sites are apparently far apart (the distance between the nucleation sites is 1.7 mm). The microlayer outer radii of the two bubbles (rm 1 and rm 2) have been obtained from the thin-film interferograms along the axis (the line connecting the two bubbles), as indicated in figure 8(a), to analyse this phenomenon in detail. Moreover, the apparent bubble base radii of the two bubbles (rb 1 and rb 2) have been obtained from the side-view photographs to understand their relationship with microlayer radii.

Figure 8. (a) Temporal evolution of bubble base radius (rb 1 and rb 2) and microlayer radius (rm 1 and rm 2); (b) bubble(s) image (from side view) and microlayer fringe pattern (from bottom) at 0.7 ms and microlayer thickness; and (c) 3-D reconstructed profiles indicating microlayer spreads and thicknesses at t = 0.7 and 0.9 ms.
In the absence of the second bubble, the first bubble's rm 1 and rb 1 are proportional to each other; this evolution is similar to that of the single nucleation case described in § 3.1. This phase is indicated as symmetric growth in figure 8(a), as both microlayer and bubble base radii are proportional. However, after the second nucleation (t =0.5 ms), with time, the proportionality between the microlayer spread (rm 1) and bubble base radius (rb 1) is disrupted (noticeably after 0.7 ms), and this phase is indicated in the figure as asymmetric growth. During the asymmetric growth phase, the depletion of the microlayer radius (rm 1) is much faster than the depletion of the upstream bubble radius (rb 1) (figure 8a). Consequently, this faster depletion of the microlayer will also reduce its contribution towards bubble growth. It is important to note that it is not possible to accurately quantify the exact percentage of depletion in evaporation from TFI due to the lack of information related to flow within the microlayer. Nevertheless, the reduction in microlayer spread, even from distant interaction, is quite an interesting phenomenon and warrants consideration in further modelling efforts. Such a reduction in the microlayer spread of the primary nucleation is shown in figures 8(b) and 8(c). The three-dimensional (3-D) reconstructed thin-film interferogram (figure 8c) clearly indicates the decrease in microlayer spread and thickness of primary nucleation due to secondary nucleation at t = 0.7 and 0.9 ms. Furthermore, as the bubbles are far apart, the impact of the second nucleation on the first nucleation is delayed slightly. The role of the distance between the nucleations will be elaborated on in § 3.4.
To show the importance of depletion caused by the growth of a secondary bubble, even when it is far apart, the evolution of microlayer radii in different directions is studied. For this purpose, the non-dimensional microlayer radius, defined as the ratio of instantaneous microlayer radius to maximum microlayer radius in that direction, i.e. rm/rm ,max, is plotted in the directions of interest. Particularly in directions I, II and III, shown in figure 9(a), the depletion of the microlayer is quite prominent, with slightly faster depletion in direction II as the second bubble is nucleating on the right bottom. In direction V, where the influence of the second bubble (through hydrodynamic interaction) is not significant and the depletion is very slow even in the presence of cross-flow. This result clearly indicates the accelerated depletion of the microlayer along the direction of secondary nucleation.

Figure 9. (a) Evolution of microlayer radii ratio in different directions of the primary nucleation (top nucleation) and the dashed line in the figure indicates the appearance of secondary nucleation; (b) time scales associated with the depletion of microlayer of the primary nucleation in various directions (depletion time = 0 represents the time of initiation of secondary nucleation).
In addition, time scales associated with microlayer depletion are also plotted in figure 9(b). Unfortunately, as one cannot obtain the bubble growth rate or bubble equivalent diameter accurately in multiple nucleation cases from just a single side-view photograph, it is not possible to obtain such time scales with those parameters reported by Sinha et al. (Reference Sinha, Narayan and Srivastava2022). In the interest of microlayer depletion, a different time scale based on the upstream bubble base radius is used. The upstream bubble base is strongly correlated with the microlayer radius. The decrease in bubble base radius from its maximum in the upstream direction (max(Rb,up) − Rb,up) is divided by the microlayer depletion rate in a specific direction to get the associated time scales for microlayer depletion in that direction. Moreover, to assess the influence of bulk liquid flow, the bulk liquid velocity at the bubble centroid height (Vl) is used in place of the microlayer depletion rate to get the associated time scale. Figure 9(b) shows all the time scales associated with the depletion of the microlayer of the primary nucleation in various directions. As the secondary bubble is nucleating on the right bottom (as shown in the image), the time scale associated with microlayer depletion is less along the direction of secondary nucleation. As the secondary nucleation does not influence the left side of the bubble, its associated time scale is also large. Moreover, the time scale associated with bulk velocity is also large compared to time scales associated with depletion rates, indicating its effect is secondary.
Furthermore, to elucidate on the relative importance of interactions of the adjacently nucleated vapour bubbles vis-à-vis depletion of the microlayer through its evaporation during the course of bubble growth phase in the absence of any cross-flow, we conducted similar experiments under the nucleate pool boiling regime with two adjacently nucleated (and growing) vapour bubbles. Such a configuration eliminated the influence of cross-flow and hence allowed us to assess the relative importance of the other two phenomena, namely bubbles interaction and microlayer evaporation, towards the net depletion of the microlayer. Observations made through the set of these repeated experiments (conducted under similar conditions) highlighted the role(s) of bubbles interaction and microlayer evaporation even under quiescent bulk liquid conditions (see Appendix A). Overall, these results emphasise that strong depletion of the microlayer (of primary nucleation) occurs due to secondary nucleation even when the bubbles are apparently far apart. The dependency of microlayer depletion (of the primary bubble) on the location of secondary nucleation is discussed in § 3.4.
3.4. Impact of secondary nucleation location and growth rate on microlayer depletion
In the previous sections, it has been established through experimental analysis that the secondary nucleation impacts the first bubble's motion, shape and, ultimately, its microlayer spread and thickness. In the case of single-bubble nucleation, the microlayer depletion first occurred from the upstream direction, as discussed in § 3.1. However, in multiple nucleation cases, the depletion can occur from any side, depending on the location(s) of the other nucleation(s). First, two cases are analysed to clearly understand the difference between upstream and downstream secondary nucleation impact. In the two cases, the distance between the two nucleations is 1.35 mm; while the nucleation sequence is different. In the first case, the first nucleation occurred on the bottom side (upstream side) and the second nucleation on the top side (downstream side) (figure 10a); in the second case, the relative positioning of the two nucleation sites is kept reversed (figure 10b).

Figure 10. Temporal evolution of the microlayer outer radius along the axis of the interaction of the two bubbles for two cases: (a) case with initial nucleation (N1) at the bottom (upstream); (b) case with initial nucleation (N1) at the top (downstream). Symbols rm 1 and rm 2 correspond to the radii of the first (N1) and second (N2) nucleation, respectively.
Microlayer outer radii of the two bubbles along the axis connecting the two bubbles are shown for both the cases in figure 10 to understand the difference between upstream and downstream secondary nucleations. Figure 10 also shows the original thin-film interferograms before and after the second nucleation, along with three-dimensional reconstructed contours indicating both the spread and thicknesses of the respective microlayers. In figure 10(a) (initial nucleation: upstream), the second nucleation occurs in the downstream direction. The liquid inertia due to the growth of the second bubble results in a shape change of the first bubble in the direction opposite to the flow. As a consequence, the microlayer of the first bubble depletes from the downstream side. This case is quite interesting as the bubble depletes from the bottom (upstream direction) due to the coupled effects of capillary forces and bulk fluid motion and from the top due to secondary nucleation. Hence, downstream second nucleation effectively reduces the microlayer spread significantly compared to single nucleation or figure 10(b), as the depletion of the microlayer occurs from both upstream and downstream directions. While in figure 10(b), the depletion of the microlayer from the upstream direction occurs due to coupled effects of secondary nucleation's growth, bulk fluid and capillary forces. Although the two nucleation cases discussed in this section are not vertically on the same plane, even under such conditions, depletion of the microlayer is dominant due to secondary nucleation. Furthermore, the microlayer depletion rate depends on the growth rate and the distance between the two nucleation sites.
At high heat flux levels, secondary nucleations can occur in close proximity to the primary nucleation. For instance, in the experiments reported, when the applied heat flux was approximately 100 kW m−2, many secondary nucleations were observed right next to the primary nucleation. Usually, bubbles are considered to have an area of influence in heat flux partitioning modelling (Del Valle & Kenning Reference Del Valle and Kenning1985); the most widely used value is four times the area of the bubble (2 × original bubble base (if the bubble is considered as hemispherical)). In the area of influence, usually, no secondary nucleations are considered while modelling. However, our experiments revealed secondary nucleations in the area of influence. Such nucleations led to immediate coalescence within 0.1 ms (for example, Case I in figure 11). The coalescence's signature differs from the bubbles’ hydrodynamic interaction (Case II and Case III in figure 11), as indicated by the thin-film interferogram in figure 11 (Case I; tdepletion). At the same heat flux level, the depletion of the microlayer of the primary bubble got delayed when the distance between the nucleating bubbles increased (Case II in comparison with Case I).

Figure 11. Schematic representation of three possible two-bubble interactions and representative thin-film interferograms for each case.
To emphasise the delay in depletion in the investigated cycles, the minimum time observed between the first appearance of secondary nucleation and sharp depletion of the primary nucleation's microlayer (Δtmin‐dep) (in the direction of the secondary nucleation) was estimated. For instance, in figure 10, a sharp decrease in microlayer radius in the direction of the second bubble was observed in the fourth frame after the appearance of the second bubble's microlayer. Hence, the minimum time of depletion for that cycle was considered to be 0.3 ms (as the images were recorded at 10 000 fps using HSC1).
Moreover, in hydrodynamic interaction, as noted earlier in § 3.3, the microlayer of the primary nucleation depletes due to secondary nucleation even when the bubbles are far apart. It has been observed that the microlayer depletion rate of the primary nucleation is proportional to the growth rate of the secondary bubble's microlayer. When the supplied heat flux is approximately 60 kW m−2, for the cases shown in figure 10, Δtmin‐dep is 0.3 ms. However, with an increase in the supplied heat flux, Δtmin‐dep decreases due to an increase in the growth rate. For example, the distance between the nucleation sites is the same for Case II shown in figure 11 and for the cases discussed in figure 10. However, due to high heat flux levels (100 kW m−2) associated with the cases included in figure 11, the value of Δtmin‐dep is lower (0.2 ms). Thus, with an increase in heat flux, the Δtmin‐dep decreases, and with the increase in the distance between nucleations, the Δtmin‐dep increases. These observations clearly establish the fact that the depletion rate of the primary nucleation's microlayer  $({\dot{r}_{m1}})$ is a strong function of the growth rate of the secondary nucleation $({\dot{r}_{m2}})$ and distance between nucleations (d).
Further, a three-nucleation case has been considered in this analysis to show the importance of bubble nucleation location. In the investigated sequence, one bubble nucleated at the bottom (upstream), and after 0.7 ms, the second bubble nucleated in the downstream direction. This was followed by the nucleation of a third bubble, after approximately 1.5 ms of the initial nucleation, in the downstream direction right next to the second bubble. Figure 12 shows thin-film interferograms at different time instances. The first nucleation's microlayer has been observed to deplete from the top side due to the second nucleation (figure 12; t = 1.3 ms). The second nucleation's microlayer has been observed to deplete from the left side due to the third nucleation (figure 12; t = 2 ms). The fact that the third nucleation is very close to the second nucleation compared to the first leads to a complete depletion of the microlayer of the second nucleation from the left side (figure 12; t = 2.6 ms). This result emphasises the importance of the location of the subsequent nucleation.

Figure 12. Time evolution of microlayer fringe patterns in the case of three interacting bubbles.
Findings reported in the present work highlight the importance of the mutual interaction of bubbles and their impact on the ultimate depletion of microlayers. Through carefully conducted experiments, it has been established that the microlayers involved in multiple nucleation cases are not the same as in single nucleation cases. The present findings are very relevant and important to be considered in a wide range of modelling approaches, from component scale modelling of boiling flows to focused modelling efforts dedicated to multiple interacting bubbles using interface tracking. The aspect of hydrodynamic interaction leading to microlayer depletion, as emphasised through the present work, was not acknowledged in the current state-of-the-art of modelling. In view of current findings, the authors believe that this aspect has to be considered in future modelling. As shown through the present work, parameters such as the distance and growth rate of bubbles are both important to account for the proper depletion of the microlayer. Hence, correction factors to account for the depletion of microlayers can be considered to model such interactions and should be a function of relative bubble growth as well as the distance between the two nucleation sites. Thus, this science of bubble interactions and their influence on microlayer depletions should be considered in future modelling, particularly for boiling, to avoid overestimation of the contribution of the microlayer towards the bubble growth and overall boiling heat transfer.
4. Conclusion
Flow boiling experiments were conducted to investigate the interaction of bubbles and the influence of such interaction on their associated microlayers. The main findings of the experiments are as follows.
1. In multiple nucleation cases, secondary nucleation in the vicinity of the first nucleation can alter the movement of the first bubble.
2. It has been found that the secondary nucleation could also help the bubble lift-off process by depleting the microlayer.
3. The microlayer depletion in the case of two vapour bubble nucleation is different from the case of single vapour bubble nucleation. The liquid inertia imparted due to the secondary nucleation helps deplete the primary nucleation's microlayer. Mainly, our experimental results also demonstrated that the secondary nucleation could deplete the microlayer of the first bubble hydrodynamically even when the bubbles are far apart.
4. Furthermore, it has been found that the bubble interaction and microlayer depletion rate depend on the growth rate of secondary nucleations and the distance between the nucleations.
5. Additionally, an investigation of a three-bubble nucleation case revealed that the site locations and sequence of nucleations played a vital role in microlayers’ depletions.
Overall, this experimental study emphasises the need to consider the interaction of bubbles while modelling boiling flows not to overestimate the contribution of microlayer evaporation.
Funding
This work was partially supported by Science and Engineering Research Board (SERB), India through the Grant ID RD/0119-DST0000-007. The authors acknowledge the support received from the Science and Engineering Research Board (SERB), India. M.M. was supported by Prime Ministers Research Fellowship (PMRF) scheme funded by the Ministry of Education, India. The support received is gratefully acknowledged.
Declaration of interests
The authors report no conflict of interest.
Appendix A
A.1. Bubbles interaction and microlayer depletion in pool boiling configuration
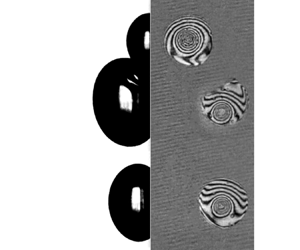
Experiments have been carried out in saturated pool boiling conditions to establish that hydrodynamic interaction of bubbles and depletion of microlayer(s) occur even in the quiescent liquid state of boiling phenomena. The details of the setup and heater section for pool boiling geometry are not provided here to avoid any repeatability. These details are provided by Suryanarayan & Srivastava (Reference Suryanarayan and Srivastava2021). The microlayer interferograms reported in the present discussion were recorded at 4000 fps. Figure 13 shows the interaction of two bubbles in the case of nucleate pool boiling conditions. As the secondary nucleation (bubble, referred to as ‘Second nucleation’ in the figure) starts growing, the microlayer of the primary nucleation (‘First nucleation’ in the figure) in that particular direction decreases relatively much faster as compared to the other regions of the microlayer that are slightly offset with respect to the line of direct interaction (for example, at t = 5.1 ms).

Figure 13. Microlayer dynamics associated with interacting bubbles in pool boiling.
To emphasise the importance of microlayer depletion caused by the growth of a secondary bubble, we have plotted the evolution of microlayer radii in different directions. Similar to § 3.3 of the main manuscript, we tracked non-dimensional microlayer radii in different directions (as shown in figure 14). Particularly, in directions I, II and III indicated in figure 14, the depletion of the microlayer is quite prominent, with slightly faster rate of depletion in direction II as the secondary bubble is nucleating on the top left. The interference fringes deplete relatively faster along direction II, while the portions of such fringes that fall along directions I and III can still be seen, thus indicating relatively slower depletion along directions I and III (compared to that in direction II). Direction IV is the one along which the influence of the secondary bubble is not at all significant; hence, the depletion of the microlayer is very slow. These observations clearly indicate the accelerated depletion of the microlayer along the direction of secondary nucleation. These results have clearly indicated that, in addition to bulk fluid (cross-flow effects) (under nucleate flow boiling conditions), such interactions and depletion of microlayers are extremely important, irrespective of the conditions.

Figure 14. Evolution of microlayer radii ratio along different directions of the primary nucleation (bottom nucleation).