


Introduction
Bhutan is a small country in the Eastern Himalayas, at 150 to > 7,000 m altitude. Almost 200 mammal species are known to occur there, including 27 globally threatened species, such as the tiger Panthera tigris tigris, the snow leopard P. uncia, and Bhutan's national animal, the takin Budorcas taxicolor whitei (Ministry of Agriculture and Forests, 2014). There are also > 760 bird species, of which 18 are globally threatened. Bhutan holds almost half the global population of the white-bellied heron Ardea insignis (Wangdi et al., Reference Wangdi, Dhendup and Tshering2017). The country also has > 5,600 flowering plant species, including nearly 300 that are used as medicines (Banerjee & Bandopadhyay, Reference Banerjee and Bandopadhyay2016). Population estimates for most species remain rudimentary, and many areas (including some protected areas) have not yet been surveyed thoroughly.
Bhutan's conservation management is backed by strong government regulations and policies. The constitution mandates that at least 60% of the country should remain under forest (Bruggeman et al., Reference Bruggeman, Meyfroidt and Lambin2016), the government has committed to remaining carbon neutral (Tobgay, Reference Tobgay2016), and > 50% of the country is within the protected area network (DoFPS, 2015a).
Species conservation has until now relied mainly on the country's isolation and on the Buddhist philosophy of care towards other species (Wangchuk, Reference Wangchuk2007); however, neither may be strong enough alone to maintain effective conservation in the future. Bhutan faces increasing pressures from illegal wildlife trade and climate change (Dorji, Reference Dorji2016), tourism (Gurung & Seeland, Reference Gurung and Seeland2008), and the impacts of road improvements, transmission lines (Wangchuk, Reference Wangchuk2007), and large-scale hydroelectric power development (Uddin et al., Reference Uddin, Taplin and Yu2007), all of which will have major implications for protected areas. Crop raiding and predation of livestock are also problematic in many areas (Sangay & Vernes, Reference Sangay and Vernes2008; Katel et al., Reference Katel, Pradhan and Schmidt-Vogt2014).
Here we describe the process of adapting the Management Effectiveness Tracking Tool (METT) for protected areas (Stolton et al., Reference Stolton, Hockings, Dudley, MacKinnon, Whitten and Leverington2007) to the needs of a particular country, which could be applied in many other situations. We also report on the outcomes of assessing protected area management effectiveness in Bhutan, and use these results as a basis for recommendations about future management priorities. Despite over half the country being under protection, mounting pressures from development and illegal use mean that the challenges of managing protected areas are likely to increase in the future.
Study area
The protected area system in Bhutan was established in the 1960s in the country's first national development plan. Originally designated as wildlife sanctuaries, early protected areas were converted into national parks from the 1980s, conferring greater levels of conservation (Wangchuk, Reference Wangchuk2007; Ministry of Agriculture and Forests, 2014). Implementation of this ambitious and extensive protected area system has taken several decades to accomplish, largely because of financial and capacity constraints. Today, Bhutan's conservation network comprises 10 protected areas, one botanical park (together covering 16,443.5 km2) and eight biological corridors (Wangchuk, Reference Wangchuk2007), which in all cover 51.44% of the country (DoFPS, 2015a; Fig. 1). The botanical park, although it contains an arboretum of native species, is mainly a natural ecosystem and is included in this study. The biological corridors (covering 3,307.14 km2, or almost 17% of the protected area system) have not yet been demarcated in practice or undergone management planning (Brodie et al., Reference Brodie, Paxton, Nagulendran, Balamurugan, Clements and Reynolds2016), and therefore were not included in the survey.
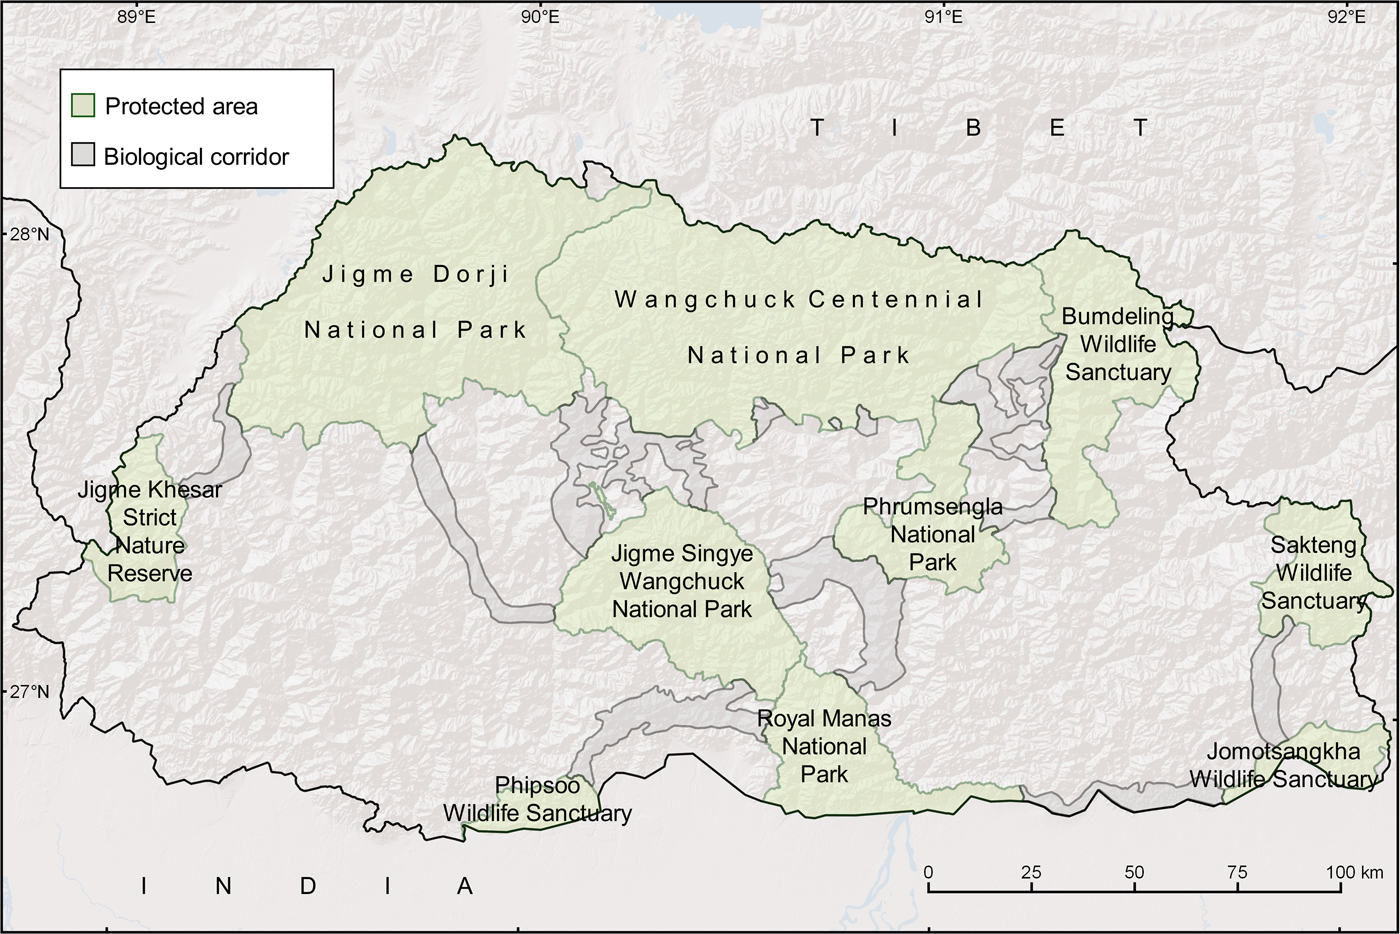
Fig. 1 Bhutan's protected area network and biological corridors.
With a population of c. 757,000 people (RGoB, 2015), Bhutan is one of the least densely populated countries in Asia. Only c. 8% of the land is suitable for agriculture (LUPP, 1995), and therefore people are highly dependent on natural resource use, including grazing, timber, and non-timber forest products (Wangchuk, Reference Wangchuk2002, Reference Wangchuk2007). Protected areas support sustainable management of biological resources, notably the legal collection (since 2004) of the Chinese caterpillar fungus Cordyceps sinensis and other medicinal herbs (Wangchuk & Tobgay, Reference Wangchuk and Tobgay2015; Wangchuk & Wangdi, Reference Wangchuk and Wangdi2015), along with the conservation of threatened species and protection of habitat (Reddy et al., Reference Reddy, Satish, Jha, Diwakar, Krishna Murthy and Dadhwal2016).
Although management plans have been prepared and revised for most protected areas, these have often not been implemented because of a lack of clear priorities, coupled with limited financial and human resources. Consequently, in 2014 the Wildlife Conservation Division of the Department of Forest and Parks Services initiated a project to develop and implement a management effectiveness assessment system, to identify successes and failures of management and to develop response strategies.
Methods
Protected area management effectiveness is a process to help protected area managers and others understand management quality, assess gaps in funding or activities, understand capacity, training and infrastructure needs, and develop future management priorities. It provides an opportunity to focus on management, develop new ideas and perspectives, and engage with local stakeholders or experts (Hockings et al., Reference Hockings, Stolton, Leverington, Dudley and Courrau2006). Protected area management effectiveness assessment began during the 1980s and 1990s (Coad et al., Reference Coad, Leverington, Knights, Geldmann, Eassom and Kapos2015). In 1992 IUCN's World Parks Congress asked the World Commission on Protected Areas to coordinate approaches to assessment. The first best practice guidelines were completed in 2000 and updated in 2006, reflecting a framework of three management themes and six elements of assessment (Fig. 2; Hockings et al., Reference Hockings, Stolton, Leverington, Dudley and Courrau2006).
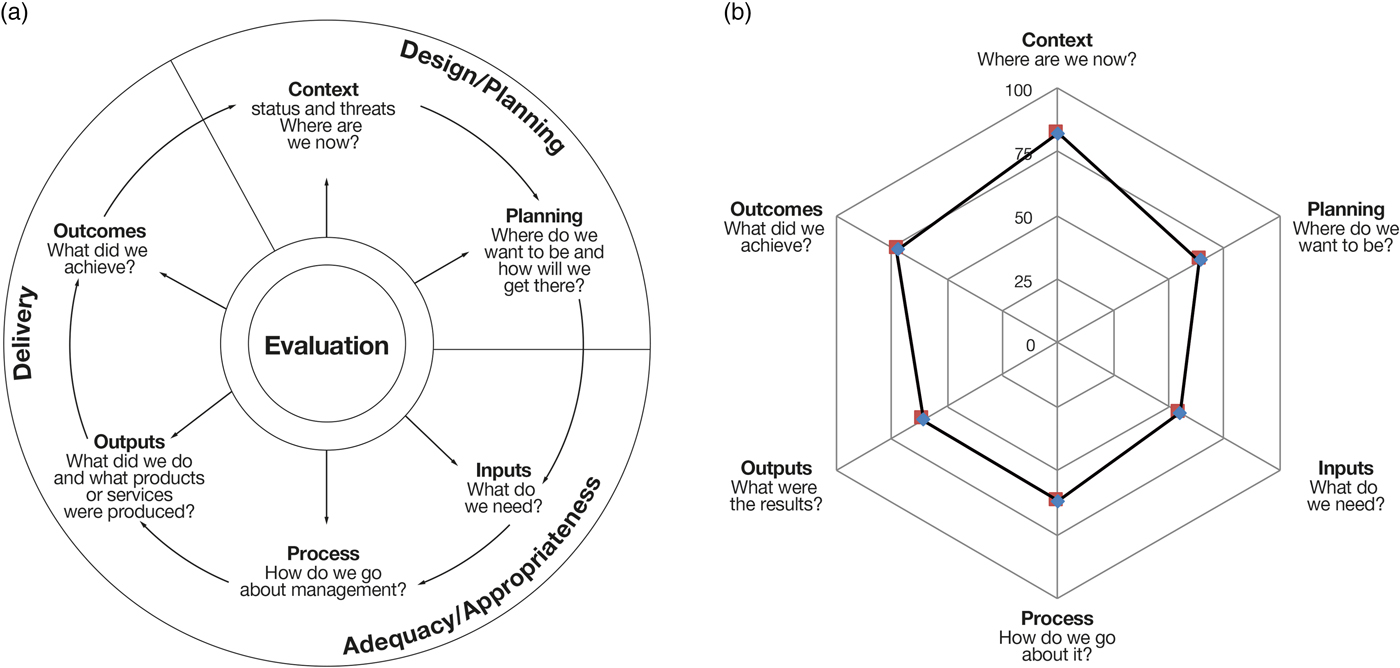
Fig. 2 (a) The IUCN World Commission on Protected Areas protected area management effectiveness framework (Hockings et al., Reference Hockings, Stolton, Leverington, Dudley and Courrau2006), and (b) a summary of the Bhutan METT + results presented as a percentage of each element of the framework.
The METT is one of a series of assessment tools built around the World Commission on Protected Areas framework. It is a simple system, consisting of a data sheet and multiple-choice questions. It is one of the most widely implemented tools for assessing protected area management effectiveness; by 2016 it had been applied in at least 2,500 protected areas covering > 4.2 million km2 in 127 countries (Stolton et al., Reference Stolton, Hockings, Dudley, MacKinnon, Whitten and Leverington2007; Stolton & Dudley, Reference Stolton and Dudley2016).
The Wildlife Conservation Division of the Department of Forest and Parks Services decided to use the METT as the basis of their assessment system, but with two important adaptations: (1) the inclusion of additional questions to create a more detailed assessment tool and (2) provision of guidance to the generic questions of the METT, to facilitate use by protected area staff in Bhutan. This aimed to ensure equivalence across the protected area network and consistency of approach in subsequent assessments. The Bhutan Management Effectiveness Tracking Tool Plus (Bhutan METT +) was developed primarily at a national training workshop in 2015, with representatives from the Wildlife Conservation Division, managers and staff from half the country's protected areas, and external consultants. Further modifications were suggested at a second national workshop, in 2016, which involved staff from all the protected areas (Dudley et al, Reference Dudley, Lham, Stolton and Wangchuk2016).
The Bhutan METT + (Supplementary Material 1) includes six elements: (1) Data Sheet 1 records details of the assessment and some basic information about the protected area; (2) Assessment Sheet 1 provides a list of current and potential threats that assessors rank and score in terms of their impact on the protected area (an annex provides guidance on interpreting threat categories in the Bhutanese context), based on an early iteration of the unified classifications of threats developed by the Conservation Measures Partnership (Salafsky et al, Reference Salafsky, Salzer, Stattersfield, Hilton-Taylor, Neugarten and Butchart2008); (3) Assessment Sheet 2, designed for the Bhutan METT +, facilitates a more detailed assessment of threats considered to be of medium or high significance (current or potential) in Assessment Sheet 1; (4) Assessment Sheet 3 asks assessors to identify the two most important management activities from a generic list, thus highlighting trends in management priorities and activities; (5) Assessment Sheet 4, the main assessment, is structured around 35 multiple-choice questions, with scores ranging from 0 (poor effectiveness) to 3 (excellent effectiveness); (6) Assessment Sheet 5 lists baseline data on species, habitats and other matters, for each protected area (Dudley et al, Reference Dudley, Lham, Stolton and Wangchuk2016), facilitating the development and monitoring of a list of core indicators in repeat assessments.
The Bhutan METT + was completed for all protected areas in Bhutan: initially for five sites in 2015, using the draft version, and then for all sites in 2016, using the final version. Field verification took place for three of the protected areas (Royal Manas, Wangchuck Centennial and Jigme Singye Wangchuck National Parks), including interviews with local stakeholders conducted by the external specialists (WCD & Equilibrium Research, 2016). All assessments were refined by site staff and through review and validation by the Wildlife Conservation Division and consultants. More than 200 people were involved, including all protected area staff, representatives of local communities, national government, and NGO staff involved in management of protected areas. The assessment reviewed management of protected areas during July 2010–June 2015.
Overall threat and management effectiveness scores were used to compare the status of threats and management effectiveness at each protected area and across the network. Scores were supplemented by narrative explanations and identification of next steps. Justification for why a particular assessment was made included local staff knowledge, reference documentation, monitoring results or external studies and assessments. These data will be used as a reference point for repeat assessments. The next steps section provides an action list of management improvements, and repeat assessments can check if actions highlighted have been completed and have achieved the desired results.
The Bhutan METT + is being mainstreamed into the protected area management system through issuance of an executive order from the government that assessments should be conducted every 5 years.
Results
The Bhutan METT + includes a two-stage assessment of threat (Fig. 3), as outlined above. The results indicate that issues related to livestock farming and grazing (70% threat level), and impacts of wild animals on crops and livestock (67%) are current threats facing most protected areas. Potential threats have a wider spread and reflect many issues related to contemporary developments, which may impact protected area effectiveness in the future. Table 1 lists all cases in which the highest level of threat was assigned in the assessment, with the associated indicator. Many of these threats are being addressed through management activities (Fig 4).

Fig. 3 The most serious current (a) and potential (b) threats facing protected areas in Bhutan (Fig. 1), with threat scores expressed as a % of the total threat level.

Fig. 4 Main management activities carried out in protected areas in Bhutan (Fig. 1), identified from a list of generic activities, from which the two main management activities carried out at each site were recorded.
Table 1 Protected areas in Bhutan (Fig. 1) where the most common threats were assessed as being at the highest level, with indicators of these threats, standardized for the threat assessment across the country.

Figure 2 presents the overall protected area management effectiveness scores from Assessment Sheet 4 of the Bhutan METT + broken down into the elements of the World Commission on Protected Areas framework. Bhutan's protected areas are strong in terms of understanding the context of protection (82% effective). All protected areas are designated, management objectives are in place, threats are understood, and stakeholder relationships are well developed. The results for planning (at both system design and site planning levels) are more mixed, as is reflected in the overall effectiveness score of 64%. The network of protected areas is extensive and representative, and biological corridors have been designated to ensure connectivity across protected areas. Implementation, however, in particular of biological corridors, is lacking because of resource constraints. With the recent posting of management staff to Jomotshangkha Wildlife Sanctuary active management is now in place across all protected areas, and management plans are in development. Although budgets are stable, the level of inputs (e.g. resources, trained staff, equipment) is insufficient for effective management, given the size of the network, and challenges such as the demanding terrain; hence this element has the lowest score, at 55% effective. Many protected area staff were trained as foresters, and there are few opportunities for training in subject matters focused on protected area management in Bhutan. Staff training was assessed as being relatively limited, and building capacity is a priority. During the assessment, staff from each protected area pooled ideas on the most critical training needs, which they identified as wildlife survey and inventory (10 sites out of 11), geographical information systems (GIS) and remote sensing (nine sites), and Spatial Monitoring and Reporting Tool (SMART) patrolling (nine sites); other priorities included law enforcement and development of an intelligence network; computer training and data analysis, including camera-trap analysis (five sites); wildlife management (four sites); and technical report, scientific paper and proposal writing (four sites). The virtual unanimity of requests for training in wildlife surveying, GIS, and SMART patrolling means that these should be a priority when seeking support for training courses, refresher courses and online training.
The processes of management are reasonably effective (62% effective), although sometimes a lack of financial resources impedes implementation. More prioritization is needed. In terms of processes, most recurring activities (e.g. management of C. sinensis, budgeting, community engagement) are implemented but it is not clear that Bhutan has the capacity to withstand a likely increase in anthropogenic pressures. Plans and budgets tend to focus on the most urgent needs. Current priorities include roll-out of the SMART anti-poaching information system, an open-source software with which rangers can record and identify poaching hotspots, and gauge the success of anti-poaching activities and management interventions to reduce crop damage and livestock predation. Outcome data are limited. Survey work on flagship species such as tigers and snow leopards (DoFPS, 2015b, 2016) indicates protection is effective. Overall, however, research data tend not to be collated across the whole protected area system. Despite this the assessment concluded that at least for now the network of protected areas is effectively achieving the stated objectives of management (73% effective).
Consolidated results risk missing variation between individual protected areas; individual results are presented in Supplementary Fig. 1 and outlined in detail in a State of the Parks report (Ministry of Agriculture and Forests, 2016). All protected areas scored strongly and consistently on context and outcomes. There was considerable variation in quality of planning, which is partly explained by the various stages of development and the inclusion of new protected areas that are still building capacity. Adequacy of inputs also varied between sites. Processes and outputs showed relative consistency, with two protected areas in each case scoring noticeably lower than others. No consistent trends were identified with respect to location; protected areas on international borders identified cross-border poaching as an issue but this had no identifiable impact on their overall scores.
Discussion
The level of threats to nature conservation in Bhutan is low, with relatively little poaching, even though most protected areas have international boundaries. However, a lack of staff capacity and equipment hampers operations. Wild animals predate livestock and eat crops, although the evidence suggests that local people still generally support conservation. Livestock farming and grazing is the greatest threat across the protected area network (Wangchuk, Reference Wangchuk2002), causing degradation and forest loss (Ministry of Agriculture and Forests, 2014). Sustainable intensification of agriculture is a priority to reduce pressure on natural resources within the protected area system, along with the formation of Dairy Groups to ensure better marketing. In Phrumsengla National Park 60–70% of production is now based on improved pasture and livestock breeds, and use of stall feeders, thus reducing impact on the forest.
Low levels of threat can also be attributed to strong relationships with local people. Over 60% of site assessments reported open communication and trust between local people, other stakeholders/rightsholders and protected area managers. This is reflected in stakeholder meetings on site, although these depend on funding for travel and subsistence. Community intelligence networks are present in some protected areas. Integrated conservation and development projects associated with protected areas have helped to improve livelihoods.
Legislation allows collection of non-timber forest products for household consumption and some commercial purposes in protected areas. This is particularly important in the sustainable management of C. sinensis, one of the world's most valuable biological resources by weight (Shrestha & Bawa, Reference Shrestha and Bawa2015), to ensure that access stays within the local community. Successful C. sinensis management is probably a key factor in the positive relationship between communities and protected area staff.
Crop raiding and killing of livestock by wild animals are growing problems throughout Bhutan (Rostro-García et al., Reference Rostro-García, Tharchen, Abade, Astaras, Cushman and Macdonald2016), partly as a result of an increasing wild boar Sus scrofa population (probably a consequence of a decline in wild dogs Cuon alpinus and more people practising settled agriculture with cash crops). As a consequence, some retaliatory killing occurs in protected areas, although this is rare because of people's religious beliefs. Management is focused on mitigation actions and encouraging the establishment of community compensation schemes. At present 60% of the crop value is paid if guarded crops are damaged, and 30% for unguarded crops, with households paying insurance to raise the funds (WCD, 2013). However, sustainability of funding is an issue.
Traditions and cultural values in Bhutan are changing and traditional knowledge is being lost. Only three protected areas (Bumdeling and Phibsoo Wildlife Sanctuaries and Royal Botanical Park) assessed cultural values as being predominantly intact. Protected area managers encourage local communities to preserve cultural values, for example through the annual Nomad Festival, organized by Wangchuck Centennial National Park.
International tourist numbers are controlled by a quota system (Gurung & Seeland, Reference Gurung and Seeland2008) and most tourism is focused on cultural attractions, but many commonly visited monasteries are in or close to protected areas. Trekking routes exist in most protected areas but facilities are generally poor. Protected area managers have no control over the number of visitors and receive no revenue from tourists, and there is only limited cooperation with the tourism industry. Several protected areas identify tourist pressure as a problem. Better ecotourism facilities are needed, along with opportunities to sell local products to tourists, strict implementation of waste management guidelines, and the continued development of homestays. In the future, policy changes may be needed to align the needs of conservation, development and tourism in the protected area system.
Good management requires a strong base of information on which to make decisions. The Bhutan METT + highlighted the need to continue identifying critical habitat for species and associated ecological processes through research and survey, and for a countrywide overview of biodiversity status and trends, with more accurate population estimates for threatened or flagship species. Detailed surveys of plant distribution are needed to identify hotspots within protected areas that require the highest levels of protection, along with more information on lower plants, invertebrates, fish, amphibians and reptiles. Capacity building needs to be developed in various disciplines (e.g. ecological processes, freshwater ecosystems, climate change), monitoring strengthened (e.g. through greater use of camera traps), and database systems improved. One aim of the assessment was to set a baseline that, coupled with conservation targets, will provide the information needed to measure progress in the protected area system. This assumes that regular monitoring will take place and continue in the long term, which is dependent on both technical ability and, more importantly, the managers’ mindset to implement adaptive management in response to what monitoring reveals.
The lack of input is the weakest element of Bhutan's protected areas. It is axiomatic that protected area professionals always want more funds, but the Bhutan METT + analysis and field visits revealed real deficiencies in capacity (e.g. there are only three vehicles available across all three ranges, covering 1,057 km2, of Royal Manas National Park, one of the better equipped protected areas in Bhutan).
The current positive assessment of management effectiveness is in part attributable to the relative lack of threats, and the system may be stretched if pressures increase. The overall conclusion is that protected areas are just about managing, with enough core government or outside-funded support to address current levels of public service delivery, resource management, and wildlife monitoring. However, there is no long-term secured budget for training and capacity building, or to carry out necessary research. Lack of secure funding makes it difficult to keep up with technological developments in equipment, or to replace items that wear out or break.
Attempts are being made to address these challenges. A Project Finance for Permanence approach is being developed as a solution to lack of budget and capacity, to establish permanent, adequate funding of conservation areas. Under this scheme, money is pledged for conservation but funds are released only when an agreed set of conditions are in place (WWF, 2015). The Government of Bhutan is working with WWF to create such a funding mechanism for the protected area system, called Bhutan for Life. Fundraising is well advanced and the programme was launched in 2017. It aims to boost the annual budget from USD 3.6 million in 2017 by an additional USD 4 million per year and to increase staff from the current 399 to 721 by 2021 (WWF US, 2017).
Bhutan has a rare set of attributes for conserving nature, ecosystem services and local cultures. The most important management priority for protected areas is to retain these attributes in the face of rapid social and economic changes and both internal and external pressures on the environment.
Changes to the METT, as used in this assessment, are all additions, leaving the basic assessment framework in place, so that, if desired, the results can be fed into global databases. The approach seeks to find a balance between maintaining the advantages of a global, comparable system and the need for local adaptations and listening to individual stakeholders. This means that experience from Bhutan, including the process of revising the methodology, implementing the assessment and interpreting the results, can be replicated elsewhere.
Acknowledgements
We thank all the protected area staff who took part in the Bhutan METT + assessment, and Dr A.J.T. Johnsingh and Mr Sangay Wangchuk, Senior Specialist to the Wildlife Conservation Division, for their feedback. The Wildlife Conservation Division would like to thank the Bhutan Trust Fund for Environmental Conservation, the WWF Bhutan Programme, the WWF Tigers Alive Initiative, the Global Environment Facility and the World Bank for helping fund the assessment and development of the State of the Parks report. We thank two anonymous reviewers for insightful comments that helped to improve the clarity of this article. The authors are solely responsible for the content and functionality of the Bhutan METT + (Supplementary Material). Queries (other than regarding absence of the material) should be directed to the corresponding author.
Author contributions
All authors were involved in the workshops to develop the Bhutan METT + and in the associated field trips, and in the preparation of this article.
Biographical sketches
Dechen Lham is co-principal investigator for Bhutan's snow leopard survey. Sonam Wangchuk is the CITES Management authority for Bhutan. He was conferred the Fred M. Packard International Parks Merit Award for outstanding service to wildlife conservation and protected areas management at the IUCN World Conservation Congress in 2016. Sue Stolton's work focuses on protected areas, particularly with respect to international conventions, assessment of management effectiveness, planning and standards, and issues related to understanding the wider values and benefits that protected areas can provide. Nigel Dudley focuses primarily on issues relating to protected areas and broadscale approaches to conservation, particularly in forest ecosystems. He is chair of the IUCN World Commission on Protected Areas specialist group on Natural Solutions, addressing ecosystem services from protected areas.


