


1 Introduction
Dust plays a crucial role in the evolution of the interstellar medium (ISM) through multiple physical processes, including the absorption, scattering and reradiation of starlight, the heating and cooling of gas, the facilitation of chemical reactions, the polarization of starlight and the depletion of heavy elements from the gas. It is an important diffuse foreground emission component that needs to be understood and removed in all studies of cosmological background radiations, such as the cosmic infrared background[Reference Hauser and Dwek1] and studies of the anisotropy and polarization of the cosmic microwave radiation[Reference Bennett, Larson, Weiland, Jarosik, Hinshaw, Odegard, Smith, Hill, Gold, Halpern, Komatsu, Nolta, Page, Spergel, Wollack, Dunkley, Kogut, Limon, Meyer, Tucker and Wright2]. Accurate knowledge of the dust-size distribution is required for proper modeling of dust contributions to the diffuse sky emission, and is therefore crucial for deriving cosmological parameters from deep surveys of the universe.
Dust is formed in the violent ejecta of core collapse supernovae and in the quiescent winds of low-mass asymptotic giant branch stars and the more massive Wolf–Rayet stars[Reference Dwek and Cherchneff3]. Production rates of dust can be estimated from observations of resolved stellar populations in nearby galaxies such as the Magellanic Clouds (MCs)[Reference Temim, Dwek, Tchernyshyov, Boyer, Meixner, Gall and Roman-Duval4]. The dust destruction rates are, however, highly uncertain. Also available in the MCs is a complete inventory of all supernova remnants that are responsible for the current rate of dust destruction. It is believed that most of the dust is destroyed during the late evolution of the remnant, when it has slowed down to velocities
 ${<}100~\text{km}/\text{s}$
. Kinetic sputtering, caused by the relative dust–gas motion, is then the dominant process of grain destruction. At velocities below
${<}100~\text{km}/\text{s}$
. Kinetic sputtering, caused by the relative dust–gas motion, is then the dominant process of grain destruction. At velocities below
 ${\sim}30~\text{km}/\text{s}$
the energy of the ions (predominantly hydrogen) falls below the sputtering threshold, and grain destruction by evaporation and shattering in grain–grain (g–g) collisions becomes the dominant mechanism of dust destruction and processing. Most of the ISM volume is swept up during this phase of the remnant’s evolution. The outcome of these collisions, and the fraction of the dust mass that is evaporated or fragmented, however, are not well known. Previous estimates of the destruction efficiency are derived by scaling results from collisions between meter-sized rocks[Reference Borkowski and Dwek5] because no experimental work at the proper scales has been performed.
${\sim}30~\text{km}/\text{s}$
the energy of the ions (predominantly hydrogen) falls below the sputtering threshold, and grain destruction by evaporation and shattering in grain–grain (g–g) collisions becomes the dominant mechanism of dust destruction and processing. Most of the ISM volume is swept up during this phase of the remnant’s evolution. The outcome of these collisions, and the fraction of the dust mass that is evaporated or fragmented, however, are not well known. Previous estimates of the destruction efficiency are derived by scaling results from collisions between meter-sized rocks[Reference Borkowski and Dwek5] because no experimental work at the proper scales has been performed.
Experiments described here will directly measure g–g destruction efficiencies of micron-sized dust particles in the
 ${\sim}5{-}10~\unicode[STIX]{x03BC}\text{m}$
range using a double dust-layer target based on previously successful experiments by Hansen et al.
[Reference Hansen, van Breugel, Bringa, Eberly, Graham, Remington, Taylor and Tielens6]. Accurately measuring micron-sized projectiles moving at speeds of
${\sim}5{-}10~\unicode[STIX]{x03BC}\text{m}$
range using a double dust-layer target based on previously successful experiments by Hansen et al.
[Reference Hansen, van Breugel, Bringa, Eberly, Graham, Remington, Taylor and Tielens6]. Accurately measuring micron-sized projectiles moving at speeds of
 ${\gtrsim}$
10 km/s with micron resolution is achievable using the combination of capabilities from X-ray free-electron lasers (XFELs) and high-power drive beams. For the purposes of this design paper, present capabilities of the Matter in Extreme Conditions (MEC) instrument of the Linear Coherent Light Source (LCLS) will be used. However, other facilities with similar characteristics are under construction at SACLA in Japan and the High Energy Density instrument at the European XFEL in Germany.
${\gtrsim}$
10 km/s with micron resolution is achievable using the combination of capabilities from X-ray free-electron lasers (XFELs) and high-power drive beams. For the purposes of this design paper, present capabilities of the Matter in Extreme Conditions (MEC) instrument of the Linear Coherent Light Source (LCLS) will be used. However, other facilities with similar characteristics are under construction at SACLA in Japan and the High Energy Density instrument at the European XFEL in Germany.
These experiments aim to study astrophysical-shock processing of dust grains by measuring the evolution of large (
 ${\sim}5{-}10~\unicode[STIX]{x03BC}\text{m}$
) dust grains as they are impacted by small (
${\sim}5{-}10~\unicode[STIX]{x03BC}\text{m}$
) dust grains as they are impacted by small (
 ${\lesssim}1~\unicode[STIX]{x03BC}\text{m}$
) dust grains. Measurements made in these experiments will improve our understanding of astrophysical dust evolution and will significantly impact future models of ISM dust and their diffuse emission. These results will provide the first experimental data to characterize dust destruction efficiencies of micron-sized dust grains in an astrophysically relevant regime.
${\lesssim}1~\unicode[STIX]{x03BC}\text{m}$
) dust grains. Measurements made in these experiments will improve our understanding of astrophysical dust evolution and will significantly impact future models of ISM dust and their diffuse emission. These results will provide the first experimental data to characterize dust destruction efficiencies of micron-sized dust grains in an astrophysically relevant regime.
2 Experimental setup
2.1 Target design
The experiments will use long-pulse optical beams to produce a shock wave that propagates through a low-density
 $\text{SiO}_{2}$
foam containing the dust grains, as shown in Figure 1. Initial work will investigate the destruction of large diameter (
$\text{SiO}_{2}$
foam containing the dust grains, as shown in Figure 1. Initial work will investigate the destruction of large diameter (
 ${\sim}5{-}10~\unicode[STIX]{x03BC}\text{m}$
) dust grains through collisions with smaller grains (
${\sim}5{-}10~\unicode[STIX]{x03BC}\text{m}$
) dust grains through collisions with smaller grains (
 ${\lesssim}1~\unicode[STIX]{x03BC}\text{m}$
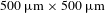
). The target consists of a Kapton washer with an inner diameter of
${\lesssim}1~\unicode[STIX]{x03BC}\text{m}$
). The target consists of a Kapton washer with an inner diameter of
 $500~\unicode[STIX]{x03BC}\text{m}$
within which the foams are formed. The double-layer targets are built in a multi-step process where the foams containing the different size dust grains are created separately. The ‘nondusty’ side is covered with a
$500~\unicode[STIX]{x03BC}\text{m}$
within which the foams are formed. The double-layer targets are built in a multi-step process where the foams containing the different size dust grains are created separately. The ‘nondusty’ side is covered with a
 ${\sim}$
13
${\sim}$
13
 $\unicode[STIX]{x03BC}\text{m}$
thick layer of Parylene C that will function as the ablator and the targets are finished with a flash-coating of 1000 Å (1 Å
$\unicode[STIX]{x03BC}\text{m}$
thick layer of Parylene C that will function as the ablator and the targets are finished with a flash-coating of 1000 Å (1 Å
 $=$
0.1 nm) of aluminum, as shown in Figure 1(a).
$=$
0.1 nm) of aluminum, as shown in Figure 1(a).

Figure 1. (a) Exploded view of the target layers. (b) Experimental schematic with drive parameters. Laser ablation drives a shock in the low-density foam. (c) When the shock passes the dust, small grains are accelerated to near the shock velocity and large grains to a fraction thereof, resulting in g–g collisions behind the shock.

Figure 2. Summary of 1D HYADES results for a nominal case of small (
 $1~\unicode[STIX]{x03BC}\text{m}$
diameter)
$1~\unicode[STIX]{x03BC}\text{m}$
diameter)
 $\text{SiO}_{2}$
grains impacting large carbon grains of (a)
$\text{SiO}_{2}$
grains impacting large carbon grains of (a)
 $5~\unicode[STIX]{x03BC}\text{m}$
and (b)
$5~\unicode[STIX]{x03BC}\text{m}$
and (b)
 $10~\unicode[STIX]{x03BC}\text{m}$
diameter. The mass-averaged position (solid) and velocity (dashed) are shown as a function of time. The vertical dotted line indicates the time (
$10~\unicode[STIX]{x03BC}\text{m}$
diameter. The mass-averaged position (solid) and velocity (dashed) are shown as a function of time. The vertical dotted line indicates the time (
 ${\gtrsim}$
5 ns) at which the small grains reach the large grains. The relative velocity between the grains in both cases is
${\gtrsim}$
5 ns) at which the small grains reach the large grains. The relative velocity between the grains in both cases is
 ${\sim}40~\unicode[STIX]{x03BC}\text{m}/\text{ns}$
. These simulations used a 25 mg/cc
${\sim}40~\unicode[STIX]{x03BC}\text{m}/\text{ns}$
. These simulations used a 25 mg/cc
 $\text{SiO}_{2}$
foam.
$\text{SiO}_{2}$
foam.
We modeled the laser–target interaction for many dust and foam parameters using HYADES[Reference Larsen and Lane7], a 1D radiation hydrodynamic code. In the nominal configuration, a laser-driven shock is produced by ablating
 $13~\unicode[STIX]{x03BC}\text{m}$
of Parylene C with a 5 ns pulse containing 14 J of energy with an intensity of
$13~\unicode[STIX]{x03BC}\text{m}$
of Parylene C with a 5 ns pulse containing 14 J of energy with an intensity of
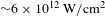 ${\sim}6\times 10^{12}~\text{W}/\text{cm}^{2}$
, assuming a
${\sim}6\times 10^{12}~\text{W}/\text{cm}^{2}$
, assuming a
 $250~\unicode[STIX]{x03BC}\text{m}$
spot diameter. At this modest intensity, the
$250~\unicode[STIX]{x03BC}\text{m}$
spot diameter. At this modest intensity, the
 $13~\unicode[STIX]{x03BC}\text{m}$
ablator is more than sufficient to prevent any burn-through, i.e., the laser does not deposit energy into the foam directly. Equation-of-state tablesFootnote
1
were used for all materials, and zones at interfaces between different materials were mass-matched for accurate shock propagation between materials of different densities. In 1D, dust grains are modeled as a single layer of material with the expectation that the velocity is an overestimate due to the 3D nature of the real dust grain. Figure 2 summarizes the 1D results of the nominal case using the mass-averaged grain velocity and position as the metrics of interest.
$13~\unicode[STIX]{x03BC}\text{m}$
ablator is more than sufficient to prevent any burn-through, i.e., the laser does not deposit energy into the foam directly. Equation-of-state tablesFootnote
1
were used for all materials, and zones at interfaces between different materials were mass-matched for accurate shock propagation between materials of different densities. In 1D, dust grains are modeled as a single layer of material with the expectation that the velocity is an overestimate due to the 3D nature of the real dust grain. Figure 2 summarizes the 1D results of the nominal case using the mass-averaged grain velocity and position as the metrics of interest.
These calculations indicate relative velocities between the small and large grain populations of
 ${\sim}38~\unicode[STIX]{x03BC}\text{m}/\text{ns}$
(5
${\sim}38~\unicode[STIX]{x03BC}\text{m}/\text{ns}$
(5
 $\unicode[STIX]{x03BC}\text{m}$
C) and
$\unicode[STIX]{x03BC}\text{m}$
C) and
 ${\sim}42~\unicode[STIX]{x03BC}\text{m}/\text{ns}$
(10
${\sim}42~\unicode[STIX]{x03BC}\text{m}/\text{ns}$
(10
 $\unicode[STIX]{x03BC}\text{m}$
C). The foam density and small grain size provide experimental controls to alter the g–g collision velocity. These calculations are an overestimate of the true velocity because the shock will slip past the 3D dust grain – causing a drag force – and there will be momentum and energy transport in the transverse direction. From previous experience with these 1D codes, we expect the true velocities to be about half of the 1D values. This reduces the estimated relative velocity between small and large grains to
$\unicode[STIX]{x03BC}\text{m}$
C). The foam density and small grain size provide experimental controls to alter the g–g collision velocity. These calculations are an overestimate of the true velocity because the shock will slip past the 3D dust grain – causing a drag force – and there will be momentum and energy transport in the transverse direction. From previous experience with these 1D codes, we expect the true velocities to be about half of the 1D values. This reduces the estimated relative velocity between small and large grains to
 ${\sim}20~\unicode[STIX]{x03BC}\text{m}/\text{ns}$
, still well within the
${\sim}20~\unicode[STIX]{x03BC}\text{m}/\text{ns}$
, still well within the
 $10{-}30~\unicode[STIX]{x03BC}\text{m}/\text{ns}$
needed for relevance to astrophysical g–g collisions.
$10{-}30~\unicode[STIX]{x03BC}\text{m}/\text{ns}$
needed for relevance to astrophysical g–g collisions.
Our targets are designed to maximize shock uniformity. We expect much of the micron-scale speckle in the laser spot created by the phase plates to be annealed as the shock propagates through the
 $13~\unicode[STIX]{x03BC}\text{m}$
ablator and
$13~\unicode[STIX]{x03BC}\text{m}$
ablator and
 ${\sim}150~\unicode[STIX]{x03BC}\text{m}$
of foam before reaching the small grains. The fine structure of the foam will create nonuniformities at the cell scale (a few 100 nm), but these modulations will be much smaller in amplitude and, therefore, tolerable for the experimental goals. After passing through the small grains, the shock will have another
${\sim}150~\unicode[STIX]{x03BC}\text{m}$
of foam before reaching the small grains. The fine structure of the foam will create nonuniformities at the cell scale (a few 100 nm), but these modulations will be much smaller in amplitude and, therefore, tolerable for the experimental goals. After passing through the small grains, the shock will have another
 ${\sim}50~\unicode[STIX]{x03BC}\text{m}$
to anneal before reaching the large grain population. The exact separation distance between the small and large grains should be at least
${\sim}50~\unicode[STIX]{x03BC}\text{m}$
to anneal before reaching the large grain population. The exact separation distance between the small and large grains should be at least
 $50~\unicode[STIX]{x03BC}\text{m}$
, but the experimental design can handle up to
$50~\unicode[STIX]{x03BC}\text{m}$
, but the experimental design can handle up to
 ${\sim}100~\unicode[STIX]{x03BC}\text{m}$
separation without significantly changing the physics.
${\sim}100~\unicode[STIX]{x03BC}\text{m}$
separation without significantly changing the physics.
2.2 Grain–grain collisions
The primary focus of these experiments is to experimentally observe dust destruction of a large grain population due to g–g collisions with a small grain population. Grains are shock-accelerated to high speeds as discussed in the previous section. After passage of the shock, these grains exist within a plasma formed by the ionized foam. In general, they can be thought of as having an electric potential equal to that of the floating potential
 $V_{f}\approx -T_{e}/(2e)\ln [m_{i}/(2\unicode[STIX]{x1D70B}m_{e})]$
, where
$V_{f}\approx -T_{e}/(2e)\ln [m_{i}/(2\unicode[STIX]{x1D70B}m_{e})]$
, where
 $m_{i}$
is the plasma-ion mass;
$m_{i}$
is the plasma-ion mass;
 $T_{e}$
,
$T_{e}$
,
 $e$
and
$e$
and
 $m_{e}$
are the electron temperature, charge and mass, respectively. For an
$m_{e}$
are the electron temperature, charge and mass, respectively. For an
 $\text{SiO}_{2}$
plasma at the few-eV level, the electric potential energy of these grains is
$\text{SiO}_{2}$
plasma at the few-eV level, the electric potential energy of these grains is
 ${\sim}$
10 s of eV. At these thermal energies we also note that sputtering of either grain population due to the plasma ions is negligible. The kinetic energy of a 1
${\sim}$
10 s of eV. At these thermal energies we also note that sputtering of either grain population due to the plasma ions is negligible. The kinetic energy of a 1
 $\unicode[STIX]{x03BC}\text{m}$
diameter
$\unicode[STIX]{x03BC}\text{m}$
diameter
 $\text{SiO}_{2}$
dust grain moving at a relative speed of
$\text{SiO}_{2}$
dust grain moving at a relative speed of
 ${\sim}20~\unicode[STIX]{x03BC}\text{m}/\text{ns}$
is
${\sim}20~\unicode[STIX]{x03BC}\text{m}/\text{ns}$
is
 ${\sim}2.6\times 10^{12}~\text{eV}$
. Due to the high kinetic energies involved and low plasma temperatures, g–g collisions are the dominant mechanism of dust destruction and can be simply thought of as occurring between ballistic projectiles where the number of collisions is set by the relative densities of the small and large grain populations.
${\sim}2.6\times 10^{12}~\text{eV}$
. Due to the high kinetic energies involved and low plasma temperatures, g–g collisions are the dominant mechanism of dust destruction and can be simply thought of as occurring between ballistic projectiles where the number of collisions is set by the relative densities of the small and large grain populations.
Table 1. Sample target parameters for dust destruction experiments.

When designing these targets, the dust mass is used as the metric since it is weighed out prior to being added to the foam solution. The number of large dust grains (
 $N_{L}$
) is estimated by the target size, dust size and diagnostic technique; for the experiments described herein, we find that the number of
$N_{L}$
) is estimated by the target size, dust size and diagnostic technique; for the experiments described herein, we find that the number of
 ${\lesssim}$
300 large grains is a good initial estimate. The number of small grains is determined by the required number of collisions to ‘destroy’ a large grain, which is estimated by setting the relative kinetic energy of the small grain (
${\lesssim}$
300 large grains is a good initial estimate. The number of small grains is determined by the required number of collisions to ‘destroy’ a large grain, which is estimated by setting the relative kinetic energy of the small grain (
 $E_{\text{KS}}$
) to the binding energy of the large grain
$E_{\text{KS}}$
) to the binding energy of the large grain
 $(E_{\text{BL}})$
. For example, the binding energy of vaporization per atom for graphite is
$(E_{\text{BL}})$
. For example, the binding energy of vaporization per atom for graphite is
 ${\sim}$
8 eV[Reference Serra Diaz-Cano and Jones8]. Hence, a 5
${\sim}$
8 eV[Reference Serra Diaz-Cano and Jones8]. Hence, a 5
 $\unicode[STIX]{x03BC}\text{m}$
C grain has
$\unicode[STIX]{x03BC}\text{m}$
C grain has
 ${\sim}60\times 10^{12}~\text{eV}$
of binding energy. For a 1
${\sim}60\times 10^{12}~\text{eV}$
of binding energy. For a 1
 $\unicode[STIX]{x03BC}\text{m}$
 $\text{SiO}_{2}$
grain carrying
$\text{SiO}_{2}$
grain carrying
 ${\sim}2.6\times 10^{12}~\text{eV}$
of kinetic energy, complete large grain destruction requires
${\sim}2.6\times 10^{12}~\text{eV}$
of kinetic energy, complete large grain destruction requires
 ${\sim}$
23 collisions. Since collisions are ballistic, this suggests that
${\sim}$
23 collisions. Since collisions are ballistic, this suggests that
 ${\gtrsim}$
23 small grains are needed within the hydrodynamic column of a single large grain. For a target diameter
${\gtrsim}$
23 small grains are needed within the hydrodynamic column of a single large grain. For a target diameter
 $D_{\text{targ}}$
and a large grain diameter
$D_{\text{targ}}$
and a large grain diameter
 $D_{L}$
, the total number of small grains (
$D_{L}$
, the total number of small grains (
 $N_{S}$
) can be estimated by
$N_{S}$
) can be estimated by
 $$\begin{eqnarray}N_{S}\approx \frac{D_{\text{targ}}^{2}}{D_{L}^{2}}\frac{E_{\text{BL}}}{E_{\text{KS}}}.\end{eqnarray}$$
The thickness of the small grain layer
 $\unicode[STIX]{x1D6E5}_{S}$
can be estimated after assuming a filling fractionFootnote
2
$\unicode[STIX]{x1D6E5}_{S}$
can be estimated after assuming a filling fractionFootnote
2
 $f_{S}\sim 2/3$
by
$f_{S}\sim 2/3$
by
 $$\begin{eqnarray}\unicode[STIX]{x1D6E5}_{S}\approx D_{S}\frac{D_{S}^{2}}{D_{L}^{2}}\frac{E_{\text{BL}}}{E_{\text{KS}}}.\end{eqnarray}$$
Estimated values of these target parameters are listed in Table 1, for the two target configurations discussed in Figure 2. The values for
 $\unicode[STIX]{x1D6E5}_{S}$
suggest that the targets containing 5
$\unicode[STIX]{x1D6E5}_{S}$
suggest that the targets containing 5
 $\unicode[STIX]{x03BC}\text{m}$
C grains require a near-monolayer of small dust grains, whereas the targets with 10
$\unicode[STIX]{x03BC}\text{m}$
C grains require a near-monolayer of small dust grains, whereas the targets with 10
 $\unicode[STIX]{x03BC}\text{m}$
C grains require essentially a double layer of 1
$\unicode[STIX]{x03BC}\text{m}$
C grains require essentially a double layer of 1
 $\unicode[STIX]{x03BC}\text{m}$
 $\text{SiO}_{2}$
grains. Thin layers can be achieved by allowing the dust to settle in the foam solution prior to the solvent exchange process. These values are estimates and assume that all grains in the hydrodynamic column efficiently vaporize part of the large dust grain. In reality, each small grain will not be moving at exactly
$\text{SiO}_{2}$
grains. Thin layers can be achieved by allowing the dust to settle in the foam solution prior to the solvent exchange process. These values are estimates and assume that all grains in the hydrodynamic column efficiently vaporize part of the large dust grain. In reality, each small grain will not be moving at exactly
 $20~\unicode[STIX]{x03BC}\text{m}/\text{ns}$
, nor is the exact binding energy of every atom in the grain exactly 8 eV. However, this methodology provides the framework to estimate the dust mass necessary to have a significant number of collisions for dust destruction experiments.
$20~\unicode[STIX]{x03BC}\text{m}/\text{ns}$
, nor is the exact binding energy of every atom in the grain exactly 8 eV. However, this methodology provides the framework to estimate the dust mass necessary to have a significant number of collisions for dust destruction experiments.

Figure 3. Top and axial views of the experimental geometry illustrating the targets and primary diagnostics.
Grain–grain collisions are the dominant destruction mechanism of the large population. The shocked foam is expected to be at the few-eV level and, in theory, does not provide enough kinetic energy for a single ion to sputter away material from the dust grains. The lateral motion of the large grains can cause g–g collisions between grains in the large population, though the relative speed is substantially reduced since the bulk motion is axial. The bilayer design of these targets allows us to study the effect of this destruction mechanism by testing targets without the small grain population. In this way, dust destruction caused by collisions between small and large grains may be studied directly through experiments.
2.3 Experimental configuration
The primary physics goals of these experiments require measuring the size distribution of the large dust grains after the interaction with the small grain population. Figure 3 illustrates the experimental geometry for the incoming beams and diagnostic directions. Breakout of the shock from the rear surface of the target is measured using a streaked optical imager (SOI) that is timed with the drive beams. For present capabilities at MEC, the X-ray beam is run at 8.2 keV for phase-contrast imaging (PCI)[Reference Nagler, Arnold, Bouchard, Boyce, Boyce, Callen, Campell, Curiel, Galtier, Garofoli, Granados, Hastings, Hays, Heimann, Lee, Milathianaki, Plummer, Schropp, Wallace, Welch, White, Xing, Yin, Young, Zastrau and Lee9] of the dust distribution and for measuring plasma conditions using an X-ray Thomson spectrometer (XRTS). The 1D velocity distribution of the dust grains is characterized using a separate optical probe beam and a cylindrical lens, as shown by the axial view of Figure 3. In this configuration, Mie-scattered light from the dust grains is measured on a gated camera using a particle imaging velocimetry technique[Reference Hansen, van Breugel, Bringa, Eberly, Graham, Remington, Taylor and Tielens6].
The size distribution of large dust grains is characterized by the PCI diagnostic utilizing the XFEL. Figure 4 illustrates the proposed PCI geometry using 8.2 keV X-rays. The beam is focused to a
 ${\sim}$
100 nm – full width at half maximum (FWHM) – spot[Reference Nagler, Arnold, Bouchard, Boyce, Boyce, Callen, Campell, Curiel, Galtier, Garofoli, Granados, Hastings, Hays, Heimann, Lee, Milathianaki, Plummer, Schropp, Wallace, Welch, White, Xing, Yin, Young, Zastrau and Lee9] using a series of
${\sim}$
100 nm – full width at half maximum (FWHM) – spot[Reference Nagler, Arnold, Bouchard, Boyce, Boyce, Callen, Campell, Curiel, Galtier, Garofoli, Granados, Hastings, Hays, Heimann, Lee, Milathianaki, Plummer, Schropp, Wallace, Welch, White, Xing, Yin, Young, Zastrau and Lee9] using a series of
 ${\sim}$
30 Be lenses for an effective focal length of 150 mm. Targets are placed 250 mm from the focal point so that the beam expands to the number of
${\sim}$
30 Be lenses for an effective focal length of 150 mm. Targets are placed 250 mm from the focal point so that the beam expands to the number of
 ${\sim}300~\unicode[STIX]{x03BC}\text{m}$
and the X-rays are detected on a Ce:YAG screen 1250 mm from the target. Optical emission from the screen is imaged onto a charge-coupled device (CCD) using a
${\sim}300~\unicode[STIX]{x03BC}\text{m}$
and the X-rays are detected on a Ce:YAG screen 1250 mm from the target. Optical emission from the screen is imaged onto a charge-coupled device (CCD) using a
 $10\times$
microscope providing
$10\times$
microscope providing
 ${\sim}1~\unicode[STIX]{x03BC}\text{m}$
(
${\sim}1~\unicode[STIX]{x03BC}\text{m}$
(
 ${\sim}$
170 nm) resolution with a
${\sim}$
170 nm) resolution with a
 ${\sim}$
3.7 mm (
${\sim}$
3.7 mm (
 ${\sim}620~\unicode[STIX]{x03BC}\text{m}$
) field of view at the screen (target). The large dust population is imaged with 50 fs X-ray pulses, which is shorter than the evolutionary time scale of the system, and the shock is effectively stationary over the probe time.
${\sim}620~\unicode[STIX]{x03BC}\text{m}$
) field of view at the screen (target). The large dust population is imaged with 50 fs X-ray pulses, which is shorter than the evolutionary time scale of the system, and the shock is effectively stationary over the probe time.

Figure 4. (a) Imaging geometry for the PCI diagnostic on MEC with an initial beam diameter
 $D=300~\unicode[STIX]{x03BC}\text{m}$
. A 500
$D=300~\unicode[STIX]{x03BC}\text{m}$
. A 500
 $\unicode[STIX]{x03BC}\text{m}$
square area in the detector plane of a simulated 8.2 keV phase-contrast image. The simulation implemented randomly distributed
$\unicode[STIX]{x03BC}\text{m}$
square area in the detector plane of a simulated 8.2 keV phase-contrast image. The simulation implemented randomly distributed
 $5{-}10~\unicode[STIX]{x03BC}\text{m}$
C grains, a finite source size (
$5{-}10~\unicode[STIX]{x03BC}\text{m}$
C grains, a finite source size (
 ${\sim}$
100 nm) and instrumental broadening. (b) Simulated diffraction patterns in X-ray intensity from carbon grains for this PCI setup normalized to the background X-ray intensity. (c) The
${\sim}$
100 nm) and instrumental broadening. (b) Simulated diffraction patterns in X-ray intensity from carbon grains for this PCI setup normalized to the background X-ray intensity. (c) The
 $S/B$
value is the measured peak-to-valley intensity relative to the background intensity and is shown for the different carbon grain sizes in (b). Abbreviation:
$S/B$
value is the measured peak-to-valley intensity relative to the background intensity and is shown for the different carbon grain sizes in (b). Abbreviation:
 $S/B$
, signal to background.
$S/B$
, signal to background.
We developed a simulator for the PCI diagnostic to examine the expected contrast levels in our experiments as demonstrated by the sample image in Figure 4. A summary of the expected phase contrast in the proposed geometry is given in Figure 4 for carbon grains of various sizes. The proposed setup produces Fresnel numbers (
 $N_{F}=a^{2}/\unicode[STIX]{x1D706}z$
, with grain size
$N_{F}=a^{2}/\unicode[STIX]{x1D706}z$
, with grain size
 $a$
, photon wavelength
$a$
, photon wavelength
 $\unicode[STIX]{x1D706}$
and effective propagation distance
$\unicode[STIX]{x1D706}$
and effective propagation distance
 $z$
)
$z$
)
 ${<}$
1, indicating that our measurements are made in the Fraunhofer diffraction limit. This can be seen by the simulated image shown in Figure 4 of randomly distributed
${<}$
1, indicating that our measurements are made in the Fraunhofer diffraction limit. This can be seen by the simulated image shown in Figure 4 of randomly distributed
 $5{-}10~\unicode[STIX]{x03BC}\text{m}$
C grains over a
$5{-}10~\unicode[STIX]{x03BC}\text{m}$
C grains over a
 $500~\unicode[STIX]{x03BC}\text{m}\times 500~\unicode[STIX]{x03BC}\text{m}$
region. These dust grains create small diffraction patterns where the central intensity variation and diameter correspond to the grain size. However, intensity variation is the more sensitive measurement in this experiment and the one-to-one correspondence with grain size is illustrated in Figure 4(c) for carbon dust. Therefore the ‘signal’ we measure is the peak-to-valley amplitude of the primary peak and first minimum in the diffraction pattern. However, it is the background-normalized amplitude, or signal-to-background (
$500~\unicode[STIX]{x03BC}\text{m}\times 500~\unicode[STIX]{x03BC}\text{m}$
region. These dust grains create small diffraction patterns where the central intensity variation and diameter correspond to the grain size. However, intensity variation is the more sensitive measurement in this experiment and the one-to-one correspondence with grain size is illustrated in Figure 4(c) for carbon dust. Therefore the ‘signal’ we measure is the peak-to-valley amplitude of the primary peak and first minimum in the diffraction pattern. However, it is the background-normalized amplitude, or signal-to-background (
 $S/B$
) measurement, that we care about. We expect unwanted amplitude modulations in our image due to the small grains and X-ray beam nonuniformities of the order of
$S/B$
) measurement, that we care about. We expect unwanted amplitude modulations in our image due to the small grains and X-ray beam nonuniformities of the order of
 $S/B\approx 0.04$
. This represents our ‘noise-to-background’ floor as shown in Figure 4(c). Grain sizes
$S/B\approx 0.04$
. This represents our ‘noise-to-background’ floor as shown in Figure 4(c). Grain sizes
 ${\gtrsim}2~\unicode[STIX]{x03BC}\text{m}$
will be resolvable with
${\gtrsim}2~\unicode[STIX]{x03BC}\text{m}$
will be resolvable with
 $\frac{\unicode[STIX]{x0394}a}{a}\approx \frac{3}{8}\frac{\unicode[STIX]{x0394}S/B}{S/B}$
, e.g., a measurement of
$\frac{\unicode[STIX]{x0394}a}{a}\approx \frac{3}{8}\frac{\unicode[STIX]{x0394}S/B}{S/B}$
, e.g., a measurement of
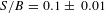 $S/B=0.1\pm ~0.01$
indicates a grain size of
$S/B=0.1\pm ~0.01$
indicates a grain size of
 $1.83\pm 0.07~\unicode[STIX]{x03BC}\text{m}$
. Grain-size distributions are measured directly from the diffraction patterns in PCI data, shock breakout is determined using the SOI diagnostic, and plasma conditions can be determined through XRTS by collecting scattered photons from the same beam used for PCI.
$1.83\pm 0.07~\unicode[STIX]{x03BC}\text{m}$
. Grain-size distributions are measured directly from the diffraction patterns in PCI data, shock breakout is determined using the SOI diagnostic, and plasma conditions can be determined through XRTS by collecting scattered photons from the same beam used for PCI.

Figure 5. (a) Simulated Thomson spectra for the proposed geometry using an 8.2 keV beam with an FWHM of 20 eV and the plasma parameters indicated. (b) Photonics calculations, where
 $S/N=\sqrt{N}$
, for the diffraction orders
$S/N=\sqrt{N}$
, for the diffraction orders
 $n=2$
, 4 and 6 using the
$n=2$
, 4 and 6 using the
 $100~\unicode[STIX]{x03BC}\text{m}$
HAPG crystal with an initial photon count of
$100~\unicode[STIX]{x03BC}\text{m}$
HAPG crystal with an initial photon count of
 $10^{12}$
and 10 eV energy bins at the detector. Abbreviation: HAPG, highly annealed pyrolytic graphite.
$10^{12}$
and 10 eV energy bins at the detector. Abbreviation: HAPG, highly annealed pyrolytic graphite.
High-resolution XRTS spectra are taken perpendicular to the flow, as indicated in Figure 3, to spatially resolve the plasma expansion. A 100
 $\unicode[STIX]{x03BC}\text{m}$
slit is aligned with the shock propagation direction to image the scattered spectrum and infer plasma properties of the shocked material and of the front itself. The same XFEL pulse used to image the grains is used for Thomson scattering and by changing the relative time between the drive pulse and X-ray beam, evolution of both the dust-size distribution and the plasma properties may be studied. Thomson scattering will occur in the noncollective regime (
$\unicode[STIX]{x03BC}\text{m}$
slit is aligned with the shock propagation direction to image the scattered spectrum and infer plasma properties of the shocked material and of the front itself. The same XFEL pulse used to image the grains is used for Thomson scattering and by changing the relative time between the drive pulse and X-ray beam, evolution of both the dust-size distribution and the plasma properties may be studied. Thomson scattering will occur in the noncollective regime (
 $\unicode[STIX]{x1D6FC}<1$
) in the proposed geometry for the expected densities (
$\unicode[STIX]{x1D6FC}<1$
) in the proposed geometry for the expected densities (
 ${\sim}10^{22}~\text{cm}^{-3}$
) and temperatures (
${\sim}10^{22}~\text{cm}^{-3}$
) and temperatures (
 ${\sim}$
2–5 eV) of the
${\sim}$
2–5 eV) of the
 $\text{SiO}_{2}$
plasma created by the foam, producing the simulated spectra shown in Figure 5(a). The
$\text{SiO}_{2}$
plasma created by the foam, producing the simulated spectra shown in Figure 5(a). The
 $100~\unicode[STIX]{x03BC}\text{m}$
highly annealed pyrolytic graphite (HAPG) crystal is selected to provide increased reflectivity while still providing excellent energy resolution;
$100~\unicode[STIX]{x03BC}\text{m}$
highly annealed pyrolytic graphite (HAPG) crystal is selected to provide increased reflectivity while still providing excellent energy resolution;
 $E/\unicode[STIX]{x0394}E\sim 1000$
(
$E/\unicode[STIX]{x0394}E\sim 1000$
(
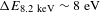 $\unicode[STIX]{x0394}E_{8.2~\text{keV}}\sim 8~\text{eV}$
) for a 100
$\unicode[STIX]{x0394}E_{8.2~\text{keV}}\sim 8~\text{eV}$
) for a 100
 $\unicode[STIX]{x03BC}\text{m}$
slit at diffraction orders
$\unicode[STIX]{x03BC}\text{m}$
slit at diffraction orders
 $n=2$
, 4 and 6[Reference Zastrau, Woldegeorgis, Förster, Loetzsch, Marschner and Uschmann10]. The scattered X-rays are detected on a PI-MTE CCD. Photonics calculations[Reference Glenzer and Redmer11] shown in Figure 5(b) indicate a high (
$n=2$
, 4 and 6[Reference Zastrau, Woldegeorgis, Förster, Loetzsch, Marschner and Uschmann10]. The scattered X-rays are detected on a PI-MTE CCD. Photonics calculations[Reference Glenzer and Redmer11] shown in Figure 5(b) indicate a high (
 ${>}$
10) signal-to-noise ratio (SNR) for electron densities
${>}$
10) signal-to-noise ratio (SNR) for electron densities
 ${\gtrsim}10^{21}~\text{cm}^{-3}$
using the proposed geometry and detector with 4 mm Be shielding. Data will be averaged over multiple shots with the same timing to improve the SNR and determine plasma properties near the shock.
${\gtrsim}10^{21}~\text{cm}^{-3}$
using the proposed geometry and detector with 4 mm Be shielding. Data will be averaged over multiple shots with the same timing to improve the SNR and determine plasma properties near the shock.
3 Summary
We have described experiments that will provide the first 2D images of shock-processed dust and experimentally measure destruction efficiencies of micron-sized grains under astrophysically relevant conditions. This work will provide valuable insight into an important, and unexplored phase of dust evolution in galaxies. By utilizing double dust-layer targets with small and large dust populations, we are focusing the investigation on g–g collisions and the resulting evaporation and fragmentation of dust particles at astrophysically relevant velocities of
 ${\sim}10{-}30~\unicode[STIX]{x03BC}\text{m}/\text{ns}$
. Null experiments with only a large dust population will also directly demonstrate the destruction efficiencies of strong shocks on dust grains with sizes of
${\sim}10{-}30~\unicode[STIX]{x03BC}\text{m}/\text{ns}$
. Null experiments with only a large dust population will also directly demonstrate the destruction efficiencies of strong shocks on dust grains with sizes of
 ${\sim}5{-}10~\unicode[STIX]{x03BC}\text{m}$
and self-consistently account for any ion sputtering that may occur due to the background plasma. As primary constituents of the ISM, carbon and silica particles are of the most interest and will be studied.
${\sim}5{-}10~\unicode[STIX]{x03BC}\text{m}$
and self-consistently account for any ion sputtering that may occur due to the background plasma. As primary constituents of the ISM, carbon and silica particles are of the most interest and will be studied.
4 Experimental procedure
Prior to each driven shot, a PCI will be taken of the target to characterize the initial large grain population. The timing of each shot is controlled by the temporal separation between the drive beams and the X-ray pulse. This timing will vary to study the evolution of the grain-size distribution and to infer the g–g destruction efficiencies under those conditions. It is expected that the size distribution will shift to smaller diameters at later times due to fragmentation and evaporation caused by g–g collisions. Our PCI calculations indicate that the foam density has no measurable effect on the contrast image and that the small grain population only slightly increases the noise floor to a few percentage of the background. The short shot cycle achievable at the MEC instrument at LCLS and other similar facilities provides the opportunity to study multiple grain materials under different shocked conditions with unprecedented diagnostic capabilities.
Acknowledgements
Special thanks are given to David Montgomery for help in simulating X-ray phase-contrast images and Bob Nagler for in-depth discussions of the capabilities of the MEC instrument of the LCLS at the SLAC National Accelerator Laboratory. This work was funded by the US Department of Energy, through the NNSA-DS and SC-OFES Joint Program in High-Energy-Density Laboratory Plasmas, grant number DE-NA0001840. Additional support for this work was provided by NASA through Einstein Postdoctoral Fellowship grant number PF3-140111 awarded by the Chandra X-ray Center, which is operated by the Astrophysical Observatory for NASA under contract NAS8-03060.


 Open access