Introduction
Global warming and stressors associated with climate change—in particular hypoxia, oceanic acidification, and hypercapnia—have raised concerns over the degradation and transformation of marine ecosystems. While ongoing global warming and its related effects are attributed to CO2 release from the combustion of fossil fuels, climate-related crises in the geologic past are commonly associated with the release of greenhouse gases during episodes of intense volcanism (e.g., Wignall et al. Reference Wignall, Newton and Little2005 and references therein). Oceanic acidification is a direct consequence of elevated CO2 through the absorption and dissolution of CO2 and SO2 in marine waters, reducing oceanic pH (Jenkyns Reference Jenkyns2010; Kelly and Hofmann Reference Kelly and Hofmann2013). Hypoxia is related to water-column stratification due to sluggish circulation and/or increased nutrient input and productivity associated with warming (e.g., Bijma et al. Reference Bijma, Pörtner, Yesson and Rogers2013; Breitburg et al. Reference Breitburg, Levine, Oschlies, Grégoire, Chavez, Conley, Garçon, Gilbert, Gutiérrez, Isensee, Jacinto, Limburg, Montes, Naqvi, Pitcher, Rabalais, Roman, Rose, Seibel, Telszewski, Yasuhara and Zhang2018). Yet the relative role of these factors is still uncertain in both present and past biotic crises.
One such crisis interval that has received increased attention is the early Toarcian oceanic anoxic event (T-OAE; ~183 Ma). It marks a global, second-order mass extinction that affected both benthic and nektonic marine species, as well as terrestrial species (e.g., Wignall and Bond Reference Wignall and Bond2008; Morten and Twitchett Reference Morten and Twitchett2009; Mattioli et al. Reference Mattioli, Pittet, Petitpierre and Mailliot2009; Martindale and Aberhan Reference Martindale and Aberhan2017). Most likely the ultimate cause of the biotic crisis was intense volcanic activity during the placement of the Karoo-Ferrar Large Igneous Province (Pálfy and Smith Reference Pálfy and Smith2000), possibly coupled with warming- related methane release to the atmosphere from the ocean (Hesselbo et al. Reference Hesselbo, Gröcke, Jenkyns, Bjerrum, Farrimond, Morgans Bell and Green2000) and from terrestrial sources (Them et al. Reference Them, Gill, Caruthers, Gröcke, Tulsky, Martindale, Poulton and Smith2017). However, the proximate killing mechanisms are still poorly understood. Extinctions are mostly attributed to widespread anoxia (Jenkyns Reference Jenkyns1988, Reference Jenkyns2010; Hallam and Wignall Reference Hallam and Wignall1997; Aberhan and Baumiller Reference Aberhan and Baumiller2003; Wignall and Bond Reference Wignall and Bond2008; Danise et al. Reference Danise, Twitchett and Little2015), but the roles of ocean acidification (Trecalli et al. Reference Trecalli, Spangenberg, Adatte, Föllmi and Parente2012), rising temperature (e.g., Suan et al. Reference Suan, Mattioli, Pittet, Lécuyer, Suchéras-Marx, Duarte, Philippe, Reggiani and Martineau2010; Gómez and Goy Reference Gómez and Goy2011; Danise et al. Reference Danise, Twitchett and Little2015), and the potentially synergistic and geographically variable effects of multiple drivers are less clear.
In this study we focus on changes in the body size of benthic marine organisms before the T-OAE. There is evidence of environmental perturbations and temperature fluctuations related to a long-term shift from icehouse to greenhouse conditions starting during the late Pliensbachian, and these factors may have begun to affect organisms before the main warming episode of the T-OAE (Suan et al. Reference Suan, Mattioli, Pittet, Lécuyer, Suchéras-Marx, Duarte, Philippe, Reggiani and Martineau2010; see “Discussion” for more details). Body size is a key parameter related to many aspects of an organism's ecology, behavior, and biology (e.g., growth, metabolism, feeding, and fecundity) and can be strongly affected by environmental stress (e.g., Daufresne et al. Reference Daufresne, Lengfellner and Sommer2009). Identifying the direction, magnitude, timing, and biotic selectivity of body-size change can provide insights on the relative importance of different stressors at times of faunal crisis. Size reduction related to climate change has been observed in living and fossil taxa, both terrestrial and marine (e.g., He et al. Reference He, Shi, Feng, Campi, Gu, Bu, Peng and Meng2007, Reference He, Shi, Xiao, Zhang, Yang, Wu, Zhang, Chen, Yue, Shen, Wang, Yang and Wu2017; Gardner et al. Reference Gardner, Peters, Kearney, Joseph and Heinsohn2011; Ohlberger Reference Ohlberger2013; O'Gorman et al. Reference O'Gorman, Zhao, Pichler, Adams, Friberg, Rall, Seeney, Zhang, Reuman and Woodward2017). It has been suggested that body-size change could be a third universal response to warming along with changes in the geographic distribution of species and changes in phenological events (Gienapp et al. Reference Gienapp, Teplitsky, Alho, Mills and Merilä2008; Daufresne et al. Reference Daufresne, Lengfellner and Sommer2009; Gardner et al. Reference Gardner, Peters, Kearney, Joseph and Heinsohn2011). Studies on variations in body size related to extinction episodes usually have focused on the aftermath of a crisis (e.g., Lockwood Reference Lockwood2005; Morten and Twitchett Reference Morten and Twitchett2009; Huang et al. Reference Huang, Harper, Zhan and Rong2010). Yet few studies have focused on changes in body size during precrisis times (e.g., He et al. Reference He, Shi, Feng, Campi, Gu, Bu, Peng and Meng2007, Reference He, Twitchett, Zhang, Shi, Feng, Yu, Wu and Peng2010; Zhang et al. Reference Zhang, Shi, He, Wu, Lei, Zhang, Du, Yang, Yue and Xiao2016; García Joral et al. Reference García Joral, Baeza-Carratalá and Goy2018; Kiessling et al. Reference Kiessling, Schobben, Ghaderi, Hairapetian, Leda and Korn2018).
Here, we briefly review current knowledge of the physiological responses of marine ectotherms to environmental stress, particularly regarding growth and body size. We use this physiological information to state three specific hypotheses about changes in body size as a response to environmental stress before the onset of the T-OAE. Subsequently, we test these hypotheses by analyzing quantitative field-based occurrence data of macrobenthic marine communities in the Lusitanian Basin of western Portugal.
Physiological Response to Environmental Stress and Expected Effects on Body Size
Body-size reduction is one common organismic response to temperature-induced stress and hypoxia and can be explained by the “thermal window” concept. Thermal windows define the temperature range upon which proper functioning of an organism depends, and within such a range, there is an optimum temperature for biological functions such as growth. Thermal windows differ between species and can shift or narrow as an adaptation to stress (Pörtner Reference Pörtner2008; Pörtner and Farrell Reference Pörtner and Farrell2008; Day et al. Reference Day, Stuart-Smith, Edgar and Bates2018). With warming, oxygen supply cannot match the increased demand and consumption, such that the aerobic scope is reduced until passive tolerance (metabolic depression) ensures temporary survival by reducing biological functions, including growth (Pörtner and Farrell Reference Pörtner and Farrell2008; Breitburg et al. Reference Breitburg, Levine, Oschlies, Grégoire, Chavez, Conley, Garçon, Gilbert, Gutiérrez, Isensee, Jacinto, Limburg, Montes, Naqvi, Pitcher, Rabalais, Roman, Rose, Seibel, Telszewski, Yasuhara and Zhang2018). Warming beyond critical threshold temperatures finally leads to a collapse of physiological functions with lethal effects (Pörtner and Farrell Reference Pörtner and Farrell2008).
Tolerance to warming and hypoxia may also be reduced by increasing CO2 levels in the water, resulting in ocean acidification and hypercapnia leading to metabolic depression and the interruption of growth (Pörtner et al. Reference Pörtner, Langenbuch and Michaelidis2005; Widdicombe and Spicer Reference Widdicombe and Spicer2008; Fabry et al. Reference Fabry, Seibel, Feely and Orr2008; Bijma et al. Reference Bijma, Pörtner, Yesson and Rogers2013). Acidification affects calcification, but the exact response of growth processes, and hence body size, is difficult to predict, because growth is not constant but varies with temperature, food supply, and predation pressure (Gazeau et al. Reference Gazeau, Parker, Comeau, Gattuso, O'Connor, Martin, Pörtner and Ross2013). The effects of lowered pH for calcifying invertebrates also depend on the organisms’ ability to regulate pH at the site of calcification, the extent of organic-layer coverage of the external shell, and biomineral solubility (Ries et al. Reference Ries, Cohen and McCorkle2009; Parker et al. Reference Parker, Ross, O'Connor, Pörtner, Scanes and Wright2013).
The physiological effects of warming, hypoxia, hypercapnia, and acidification are related to one another and may be exacerbated if these stressors act in synergy (Pörtner et al. Reference Pörtner, Langenbuch and Michaelidis2005; Byrne and Przeslawski Reference Byrne and Przeslawski2013; Kelly and Hofmann Reference Kelly and Hofmann2013), although their combined effects are still poorly understood. Notwithstanding, reductions in body size have been observed with increased temperature (Daufresne et al. Reference Daufresne, Lengfellner and Sommer2009), reduced oxygen concentrations (Diaz and Rosenberg Reference Diaz and Rosenberg2008), and ocean acidification (Widdicombe and Spicer Reference Widdicombe and Spicer2008; Parker et al. Reference Parker, Ross, O'Connor, Pörtner, Scanes and Wright2013). Everything else being equal, large-sized species are expected to be more strongly affected by growth restrictions than smaller-sized species because of their higher metabolic demands, which would be selected against under stressful conditions (He et al. Reference He, Shi, Feng, Campi, Gu, Bu, Peng and Meng2007; Daufresne et al. Reference Daufresne, Lengfellner and Sommer2009; Genner et al. Reference Genner, Sims, Southward, Budd, Masterson, McHugh, Rendle, Southall, Wearmouth and Hawkins2009; O'Gorman et al. Reference O'Gorman, Zhao, Pichler, Adams, Friberg, Rall, Seeney, Zhang, Reuman and Woodward2017). Consequently, we expect a decrease in body size as a response to increasing environmental stress, with more pronounced patterns in large-sized species.
Assuming that physiological principles play out on both the short-term and geologic timescales (see “Discussion”), we test the following hypotheses: (1) The body size of species and communities decreased before the early Toarcian extinction event; (2) large-sized species are more affected than small ones; and (3) reduction in body size occurred earlier than diversity loss and changes in faunal composition. We find support for each of these three hypotheses and discuss to what extent change in shell size before the main phase of faunal loss and extinction may have been caused by the same factor(s).
Studied Sections and Depositional Environments
Fieldwork was performed near Coimbra, Portugal, at the composite sections of Fonte Coberta (40°03′36.5″N, 8°27′33.4″W) and Rabaçal/Maria Pares (40°03′08.0″N, 8°27′30.5″W), located ca. 1 km apart from each other. These sections are representative of the Early Jurassic succession in the Lusitanian Basin, are highly fossiliferous, and have a well-defined biozonation based on ammonites (e.g., Mouterde et al. Reference Mouterde, Ruget and Moitinho de Almeida1964–1965; Comas-Rengifo et al. Reference Comas-Rengifo, Duarte, García Joral and Goy2013), nannofossils (Ferreira et al. Reference Ferreira, Mattioli, Pittet, Cachão and Spanbenberg2015), and dinoflagellate cysts (Correia et al. Reference Correia, Riding, Duarte, Fernandes and Pereira2018).
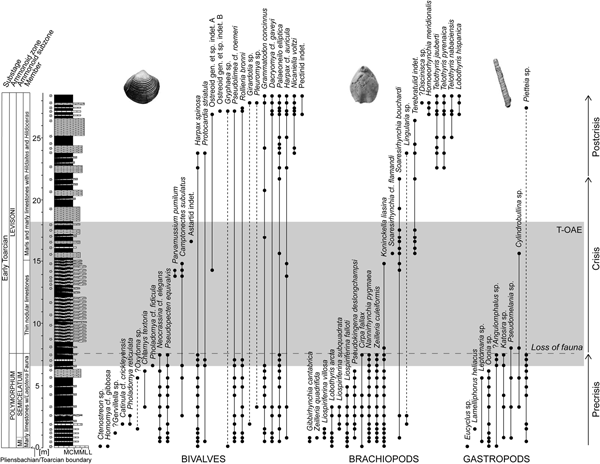
The ca. 28-m-thick studied succession (Fig. 1) spans the interval from the Pliensbachian/Toarcian boundary (base of the Polymorphum Zone = Tenuicostatum Zone of the Submediterranean Province) to the middle of the Levisoni Zone (= Serpentinum Zone). Lithostratigraphically, the studied succession is included in the São Gião Formation, which can be divided into three members (e.g., Duarte and Soares Reference Duarte and Soares2002):
1. Marly limestones with Leptaena Fauna (hereafter referred to as the first member): an alternation of decimeter-thick grayish marlstones and marly mud- to wackestones rich in benthic macroinvertebrates representing the Polymorphum Zone, which comprises the Mirabile Subzone and the Semicelatum Subzone (Fig. 1).
2. Thin nodular limestones (TNL member): gray to brownish, thin-bedded micritic carbonates and subordinate marlstones representing the lower Levisoni Zone. The transition from the first member to the TNL is marked by a color change from grayish to brownish (Miguez-Salas et al. Reference Miguez-Salas, Rodríguez-Tovar and Duarte2017) and represents a facies change in the studied section and elsewhere in the Early Jurassic of the Lusitanian Basin (Duarte Reference Duarte1997; Duarte et al. Reference Duarte, Oliveira and Rodrigues2007; Pittet et al. Reference Pittet, Suan, Lenoir, Duarte and Mattioli2014). Body fossils are extremely rare in the lower part of this member, but become more common up-section. Bioturbation, mainly represented by horizontal networks of Thalassinoides and ferruginous nonbranching tubular burrows, is pervasive (Miguez-Salas et al. Reference Miguez-Salas, Rodríguez-Tovar and Duarte2017; Rodríguez-Tovar et al. Reference Rodríguez-Tovar, Miguez-Salas and Duarte2017).
3. Marls and marly limestones with Hildaites and Hildoceras: a decimeter- to meter-thick alternation of marls and marly limestones with moderately diverse nektonic and benthic fauna. This member corresponds to the interval from the middle Levisoni Zone up to the middle part of the upper Bifrons Zone.
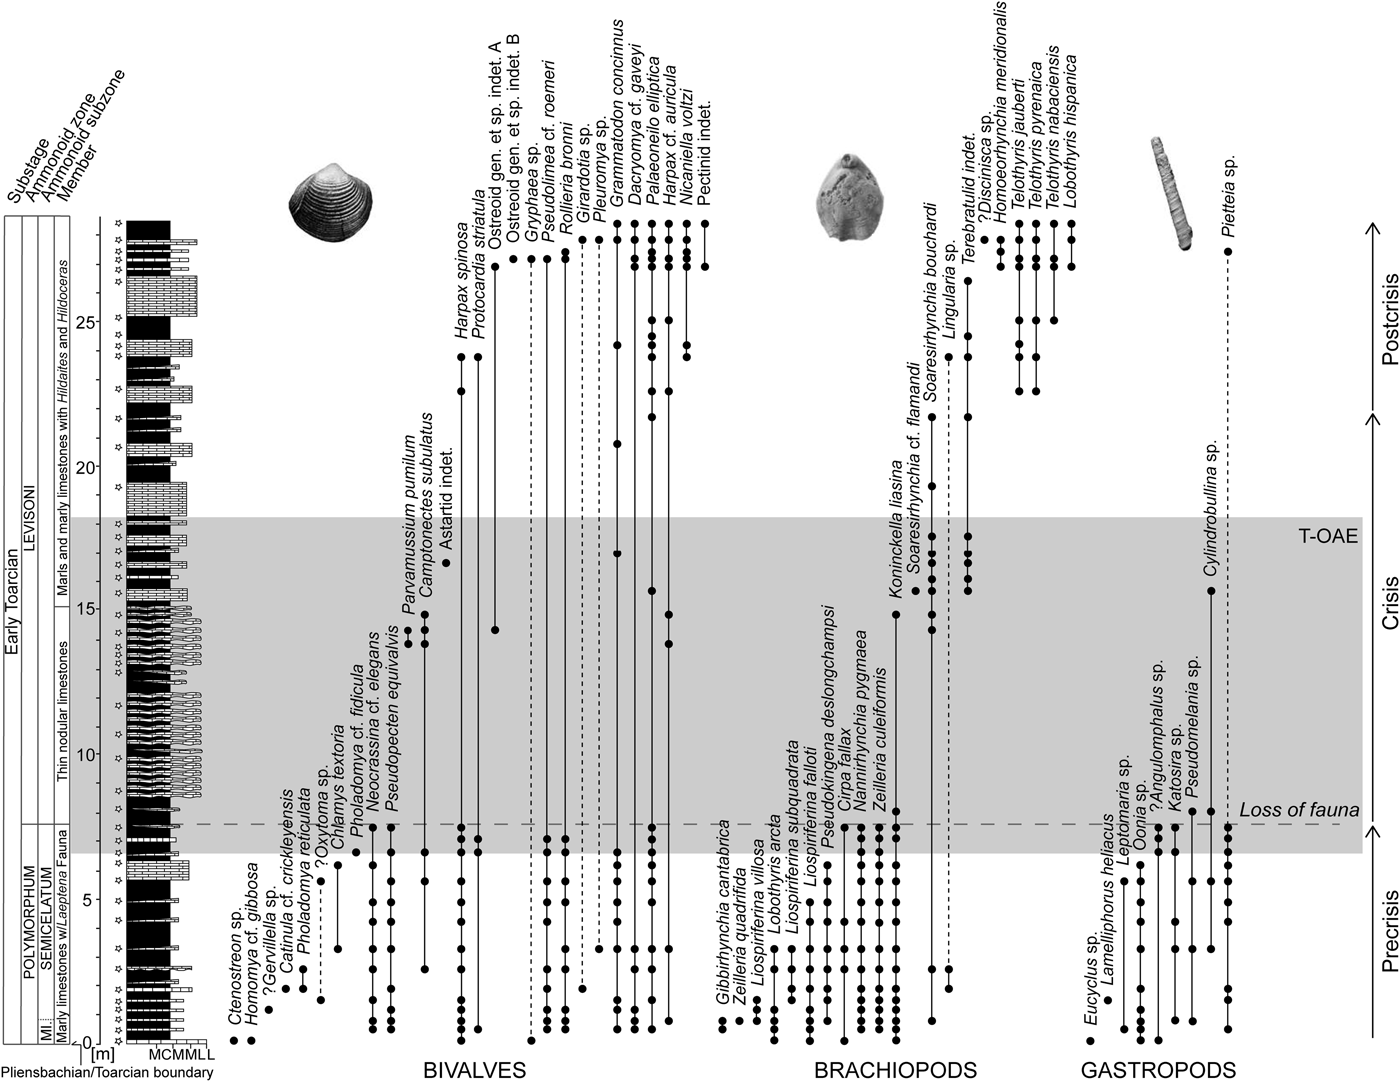
Figure 1. Stratigraphic log of the early Toarcian succession of the composite sections at Fonte Coberta and Rabaçal near Coimbra, Portugal, with the lithostratigraphic and biostratigraphic zonations of Mouterde et al. (Reference Mouterde, Ruget and Moitinho de Almeida1964–1965), Duarte and Soares (Reference Duarte and Soares2002), and Comas-Rengifo et al. (Reference Comas-Rengifo, Duarte, García Joral and Goy2013). Stratigraphic ranges of species are based on recorded occurrences (black dots) ordered by last appearances and separately for bivalves, brachiopods, and gastropods. The shaded area marks the extent of the Toarcian oceanic anoxic event (T-OAE) as defined by carbon isotope data. The dashed horizontal line represents the level where faunal loss is severe in terms of both species richness and fossil abundance. Dashed lines within the stratigraphic ranges are used when the extent of the range is uncertain. The star-shaped symbols indicate sampling levels. Abbreviations for lithology: M, marlstone; CM, calcareous marlstone; ML, marly limestone; L, limestone.
This hemipelagic Pliensbachian–Toarcian succession was deposited in a low-energy environment on a middle to distal homoclinal ramp dipping toward the northeast (Duarte Reference Duarte1997, Reference Duarte and Rocha2007; Duarte et al. Reference Duarte, Oliveira and Rodrigues2007). In particular, the monotonous succession of micritic limestones and marlstones of the interval studied herein in detail (see below) suggests that the depositional environment remained below storm-wave base without any obvious changes in water depth. Thus, while a decrease in shell size with depth has been reported, for example, in modern terebratulid brachiopods (Peck and Harper Reference Peck and Harper2010), any such size changes in our material could not be explained by variations in water depth. Moreover, the shells are evenly distributed within the sedimentary rocks. Lack of size sorting, absence of preferential orientations of shells, and lack of faunal amalgamation suggest that shell transport was insignificant and that the distribution of shell size within samples was not biased by physical agents such as currents and waves.
Unlike well-studied early Toarcian successions elsewhere, such as those in England (e.g., Wignall and Bond Reference Wignall and Bond2008; Danise et al. Reference Danise, Twitchett and Little2015) and Germany (e.g., Röhl et al. Reference Röhl, Schmidt-Röhl, Oschmann, Frimmel and Schwark2001), the black shales typical for the T-OAE are not developed. The interval corresponding to the T-OAE is mostly represented by the micritic carbonates and marlstones of the TNL member (Fig. 1). The position of the T-OAE in our section is defined by the globally recorded negative carbon isotope excursion (e.g., Hesselbo et al. Reference Hesselbo, Jenkyns, Duarte and Oliveira2007; Jenkyns Reference Jenkyns2010), because black shales are absent and the total organic carbon content is low (Duarte et al. Reference Duarte, Rodrigues, Oliveira and Silva2005). The T-OAE starts when the isotopic values begin to decrease and terminates when the values have returned to background level and thus, in our section, spans the uppermost Polymorphum Zone and the lower part of the Levisoni Zone (Fig. 1). The T-OAE has been estimated to last between 300 kyr to 900 kyr using geochronology, astronomical calibrations, and biostratigraphy (Suan et al. Reference Suan, Pittet, Bour, Mattioli, Duarte and Mailliot2008, Reference Suan, van de Schootbrugge, Adatte, Fiebig and Oschmann2015; Boulila et al. Reference Boulila, Galbrun, Huret, Hinnov, Rouget, Gardin and Bartolini2014; Sell et al. Reference Sell, Ovtcharova, Guex, Bartolini, Jourdan, Spangenberg, Vicente and Schaltegger2014). Using the timescale provided in Suan et al. (Reference Suan, van de Schootbrugge, Adatte, Fiebig and Oschmann2015: Fig. 5), we estimated the Polymorphum Zone, which is the time interval focused on in our study, to last ~900 kyr.
Materials and Methods
This study uses two types of data: (1) quantitative field data with abundance counts of specimens are used for analyzing trends in shell size and diversity; and (2) occurrence data from the Paleobiology Database (www.paleobiodb.org) and the literature are applied to reconstruct the paleolatitudinal distribution of species.
In the field, we sampled the limestone beds of the succession at the sampling levels indicated in Figure 1. Sampling intensity was standardized by collecting the same amount of bulk rock, ca. 15 kg per sample, from one spot. Through quantitative bed-by-bed sampling of the three stratigraphic members, we recorded a total of 1321 specimens belonging to 58 taxa of brachiopods, bivalves, and gastropods (Fig. 1). While our study focuses on benthic macroinvertebrates, we also recorded occurrences of ammonoids, belemnites, ichnofossils, and wood fragments. As far as permitted by preservation, the benthic fauna was identified to the species level using the relevant literature (e.g., Alméras Reference Alméras1994; Gahr Reference Gahr2002; Baeza-Carratalá Reference Baeza-Carratalá2013; Comas-Rengifo et al. Reference Comas-Rengifo, Duarte, García Joral and Goy2013).
Overall, preservation quality of the benthic fauna is moderate. Bivalves are commonly preserved as internal molds, more rarely as external molds, and occasionally with parts of the shell. As an exception, the calcitic shells of the plicatulid Harpax spinosa and those of oysters are preserved as complete single valves or articulated specimens. Different groups of brachiopods are variably preserved: terebratulids and rhynchonellids exhibit recrystallized shells, while spiriferinids generally preserve a thin shell layer and are filled with sediment. Preservation is poorest in gastropods, which consist of incomplete internal molds. Because gastropods are rare and fragmented, we excluded them from all quantitative analyses, which thus examine only the bivalve–brachiopod community.
Shell size was measured with calipers to the nearest 0.1 mm. Measurements were inferred when only a small fraction of the shell was missing, while incomplete specimens were disregarded. The size of a specimen was calculated as the log2 of the geometric mean of shell length (L) and height (H) in bivalves and shell width (W) and length (L) in brachiopods (LogGeoMean), which is a good proxy for body size (Kosnik et al. Reference Kosnik, Jablonski, Lockwood and Novack-Gottshall2006). For calculation of the geometric mean (in millimeters), the following equations were applied:
To test our hypotheses, we focused on the precrisis interval (see “Results”), which covers the lowermost 7.5 m of the section. Three samples are from the Mirabile Subzone, and 12 samples are from the Semicelatum Subzone (Fig. 1). For this precrisis interval we recorded 942 occurrences of 35 taxa of bivalves and brachiopods, of which 588 were measured (400 brachiopods and 188 bivalves; see Supplementary Material). This data set was used to construct size–frequency histograms and to analyze size trends in individual species/genera (discussed later). All other analyses of shell size were performed on an extended database in which a shell size value was assigned to each occurrence. For individuals lacking measurements, the mean shell size of the respective species in the sample was allocated. In cases in which no size measurements were available for a species in a sample, we used the mean size of this species in the sample directly below and above or, when this option was not feasible, the mean size of the species in all samples of the first member. After deletion from the data set of a few taxa that had insufficient size data, the extended data set consists of 830 records of shell size (571 brachiopods and 259 bivalves; see Supplementary Material), that is, 71% of the size data are from actual measurements of specimens and 29% are inferred following the procedure described above.
Shell-size analyses were performed at the community level (i.e., all individuals of brachiopods and bivalves of a faunal sample), separately for all brachiopods pooled and for all bivalves pooled, and for individual taxa. Changes in community-level shell size through time were investigated using the mean of all individuals of a sample irrespective of taxonomic identity. We consider this measure as the average shell size of the time-averaged relics of ancient bivalve–brachiopod communities. We also calculated this measure separately for brachiopods and bivalves. Ideally, tests for temporal changes in shell size were performed for each species separately. In the majority of cases this was hampered by low numbers of samples and/or specimens per species. Therefore, we illustrate the time series of mean size and maximum size of five taxa for which sample sizes were deemed sufficient, that is, a taxon was present in at least 10 samples with at least 30 specimens.
Bivalves and brachiopods are double-valved organisms. To determine the number of individuals from counts of specimens, we initially recorded left, right, and articulated valves for bivalves, and dorsal and ventral valves and double-valved specimens in brachiopods separately. For the final analyses, however, each specimen was counted as one individual. This approach is justified, because single valves of the same species in any of the samples did not match in shell size and therefore must represent different individuals.
To address our second hypothesis, that is, large species are more strongly affected by environmental stress than small species, each species was categorized as “smaller-sized” or “larger-sized.” To this end, we determined the mean shell size of each species in the pooled samples of the precrisis interval and used the median of these values to separate larger-sized species from smaller-sized species. For each of the two such defined subsets, the change in shell size over time was analyzed in the same way as described earlier. In addition, the abundance of individuals of larger-sized species per sample, expressed as their percentage relative to all individuals of a sample, was tracked over time. Both steps were performed for the bivalve–brachiopod communities as a whole and separately for brachiopods and bivalves.
To illustrate the direction of a trend in shell size, if any, we applied weighted LOESS smoothing. To statistically test for the existence of a trend in shell size, we fit several models of trait evolution, using the R package ‘paleoTS’ (Hunt Reference Hunt2006, Reference Hunt2015), to the time series of mean geometric mean at each level for the whole bivalve–brachiopod community, for brachiopods and bivalves separately, and for larger-sized and smaller-sized brachiopods and bivalves. The three models tested were stasis, random walk (URW), and directional trend (GRW). For each model and each time series, we report the corrected Akaike information criteria (AICc), the difference between the AICc and the minimum AICc (ΔAICc), and the Akaike weights. Following Burnham and Anderson (Reference Burnham and Anderson2003), we used a rule of thumb of ΔAICc < 2 to consider models that are not significantly less plausible than the best-fit model. Finally, to assess the adequacy of each model, package ‘adePEM’ (Voje Reference Voje2018) was used to test the models (for autocorrelation, length of runs, fixed variance over time, and in the case of the stasis model, net evolution) by running a large number (here 10,000) of simulated time series using the parameters of the fitted models and checking whether they are likely to belong to the same distribution (here, the null hypothesis, with p > 0.05 being the qualifying significance). In addition, we applied Spearman's rank correlation, as all these time series showed no autocorrelation, having passed the Box-Pierce test of autocorrelation (Box and Pierce Reference Box and Pierce1970) as implemented in base R by function Box.test, and thus their values can be considered to be independent. All the results of the statistical tests are shown in Tables 1–3.
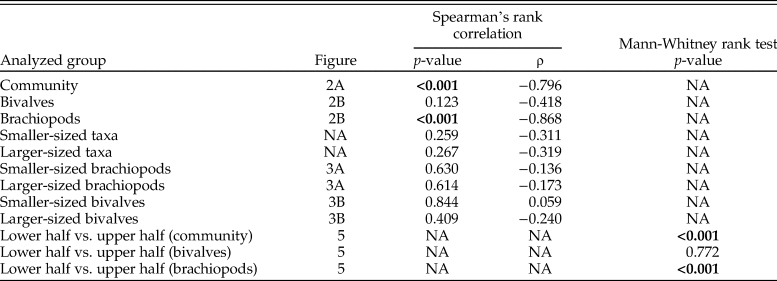
Table 1. Results of the statistical test for autocorrelation (Box-Pierce test) and of the relative Hunt's (Reference Hunt2015) model fit estimates of the analyzed time series. Significant p-values from the Box-Pierce test and estimates of the best model(s) are marked in bold. For the autocorrelation test, p-values < 0.05 would mean that samples are autocorrelated. AICc, Akaike information criteria; ΔAICc, the difference between the AICc and the minimum AICc.
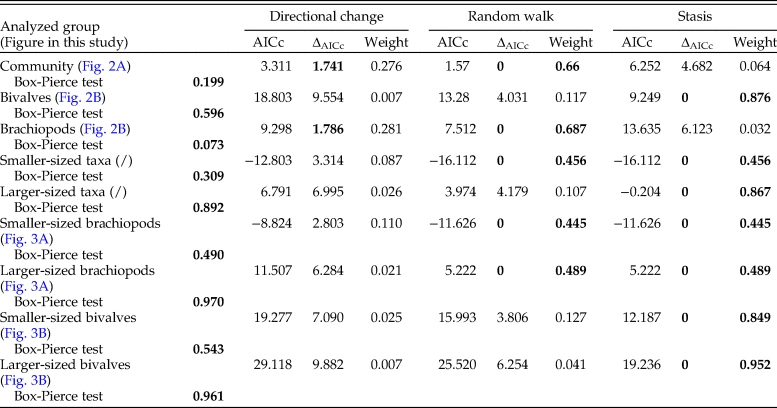
Table 2. Results of the adequacy tests for the three analyzed models of change in shell size (directional change, random walk, and stasis). The p-values are provided for each test; p-values marked in bold indicate a test was passed, otherwise a test has failed. The p-values of the adequacy tests represent the portion, divided by 0.5, of the simulated test statistics that is larger/smaller than the test statistics calculated on the actual data. A test is passed if the value of the test statistic falls within the distribution range provided by simulated test statistics (Voje Reference Voje2018).
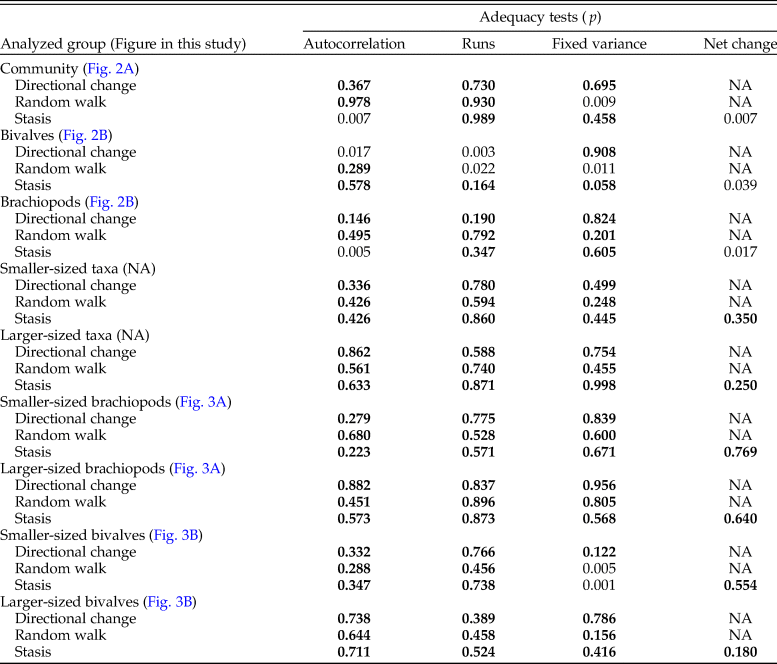
Table 3. Results of statistical tests of the correlation of shell size with time (sampling level) for different faunal groupings. Significant p-values are marked in bold. Tests on the larger- and smaller-sized groups of taxa were performed on the mean of the species means.
As a final step of our shell-size analyses, we constructed separate size–frequency histograms for the lower and upper parts of the precrisis interval, spurred by the observation that shell size decreased over this time interval. The boundary between the two parts was set at the level where the abundance of larger-sized species started to decrease. We applied the nonparametric Mann-Whitney rank test (Mann and Whitney Reference Mann and Whitney1947) to assess whether shells in the upper part are significantly smaller than in the lower part.
To compare the timing of potential changes in shell size relative with changes in biodiversity, we applied Alroy's shareholder quorum subsampling (SQS), which calculates the number of species using a defined “coverage” or quorum (Alroy Reference Alroy2010). The quorum for the SQS of bivalve–brachiopod communities was fixed at 0.8. SQS-based diversity was also obtained for bivalves and brachiopods separately using a quorum of 0.6. SQS diversity was calculated for samples that had at least 35 occurrences of brachiopods and bivalves. A few successive samples in the crisis and postcrisis interval that individually did not reach this number were pooled for this purpose.
The second type of data, occurrence data from the Paleobiology Database and the literature, was used to assess the role of temperature as a stressor and potential driver of change in shell size. Using these data sources, we reconstructed the paleolatitudinal ranges of each bivalve and brachiopod species recorded from our study site during the Pliensbachian–early Toarcian interval. Assuming that the latitudinal range of a species reflects its realized thermal niche (Day et al. Reference Day, Stuart-Smith, Edgar and Bates2018), we expect that heat stress will most strongly affect growth in narrowly distributed, stenothermal species or in those taxa for which Portugal represents the warm edge of their latitudinal ranges. When just the modern location of an occurrence was known, paleocoordinates were obtained using A Paleolatitude Calculator for Paleoclimate Studies (van Hinsbergen et al. Reference van Hinsbergen, de Groot, van Schaik, Spakman, Bijl, Sluijs, Langereis and Brinkhuis2015). We focused on records from the European epicontinental seas and the western Tethys and excluded data from distant regions (e.g., Japan, South America, western Canada) to avoid mixing of regions with possibly differing latitudinal temperature gradients. We assigned each species to one of four categories—eurythermal, warm adapted, cool adapted, or stenothermal—that were then pooled into two categories—warming tolerant (eurythermal and warm adapted) and warming sensitive (cool adapted and stenothermal). The latitudinal ranges of species were thus interpreted in terms of thermal affinities relative to the geographic position of our study site, and we tested whether the taxa that are sensitive to warming are those that as a group show a significant decrease in shell size.
All analyses were conducted with the R software (v. 3.5.1; R Core Team 2017).
Results
Size data of specimens along with the position of the respective samples in the studied section are given in the Supplementary Material for all measured brachiopod and bivalve specimens and for the extended data set.
Stratigraphic Distribution of Species
Occurrence-based stratigraphic ranges provide an overview of the communities before, across, and after the T-OAE (Fig. 1). Based on faunal changes we subdivided the section into precrisis, crisis, and postcrisis intervals. The precrisis interval corresponds to the entire Polymorphum Zone. The benthic fauna is generally small and moderately diverse, with brachiopods being most abundant. The crisis interval, spanning the lower part of the Levisoni Zone, sets in at the level where faunal loss of bivalves, brachiopods, and gastropods is severe. Brachiopods in particular experienced an almost complete faunal turnover across the T-OAE. The lower part of the crisis interval is devoid of benthic shelly fossils. The upper part is characterized by high abundances of a single species, the brachiopod Soaresirhynchia bouchardi, which has been interpreted as a disaster taxon (Gahr Reference Gahr2002; Baeza-Carratalá Reference Baeza-Carratalá2013). A few other species associated with S. bouchardi remain very rare. The last occurrence of the athyridid species Koninckella liasina in this part of the section apparently represents a late survivor before its final demise. These faunal assemblages, although low in taxonomic richness and in evenness, indicate the early phase of the recovery of the benthic fauna. Herein, we consider the crisis interval to terminate with the last occurrence of the brachiopod S. bouchardi. The beginning of the postcrisis interval is defined by the first appearances of the so-called Spanish brachiopod fauna, which is characterized by species of the brachiopod genera Telothyris, Lobothyris, and Homoeorhynchia (Alméras Reference Alméras1994; Comas-Rengifo et al. Reference Comas-Rengifo, Duarte, García Joral and Goy2013), in the middle Levisoni Zone. Benthic taxa in the postcrisis interval are generally less abundant but larger than in the precrisis interval. Bivalve species present in the precrisis interval commonly reappear in the postcrisis interval (Fig. 1).
Patterns and Trends in Shell Size
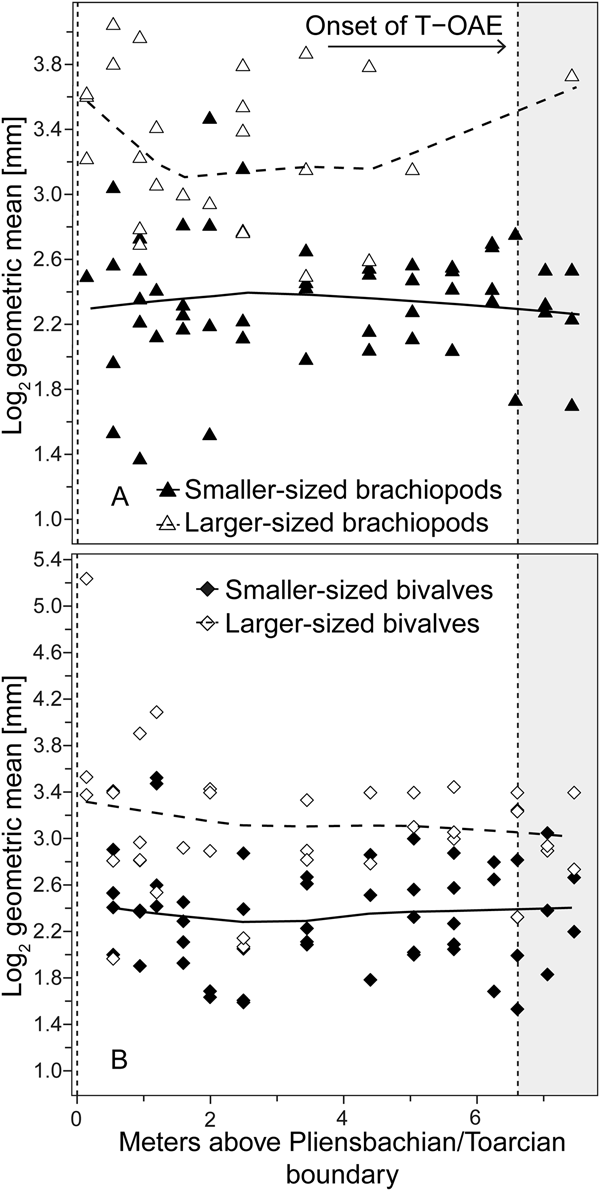
Analyzing for temporal trends in shell size at the community level we find that the best-fitting model is the random walk (URW). Still, the directional model (GRW) cannot be rejected because of a low (<2) ΔAICc (Table 1). When the adequacy of both models is tested (Table 2), the GRW passes all tests, while the URW fails one adequacy test for the heteroscedasticity of the residuals, making the GRW the better model of the two. This is consistent with the result of the Spearman's rank correlation test, which indicates a significant decrease in the mean size of bivalve–brachiopod communities during the precrisis interval (Fig. 2A, Table 3). Similarly, a GRW cannot be excluded in brachiopods (for which all adequacy tests were fulfilled for both GRW and URW), while for bivalves the stasis model is clearly the best fit, despite failing one of its adequacy tests (p-value of ~0.04 when it needed to be >0.05) (Fig. 2B, Table 2). A significant decrease in the shell size of the brachiopod fauna is also confirmed by Spearman's rank correlation test, while the trend in bivalves is not significant (Table 3).
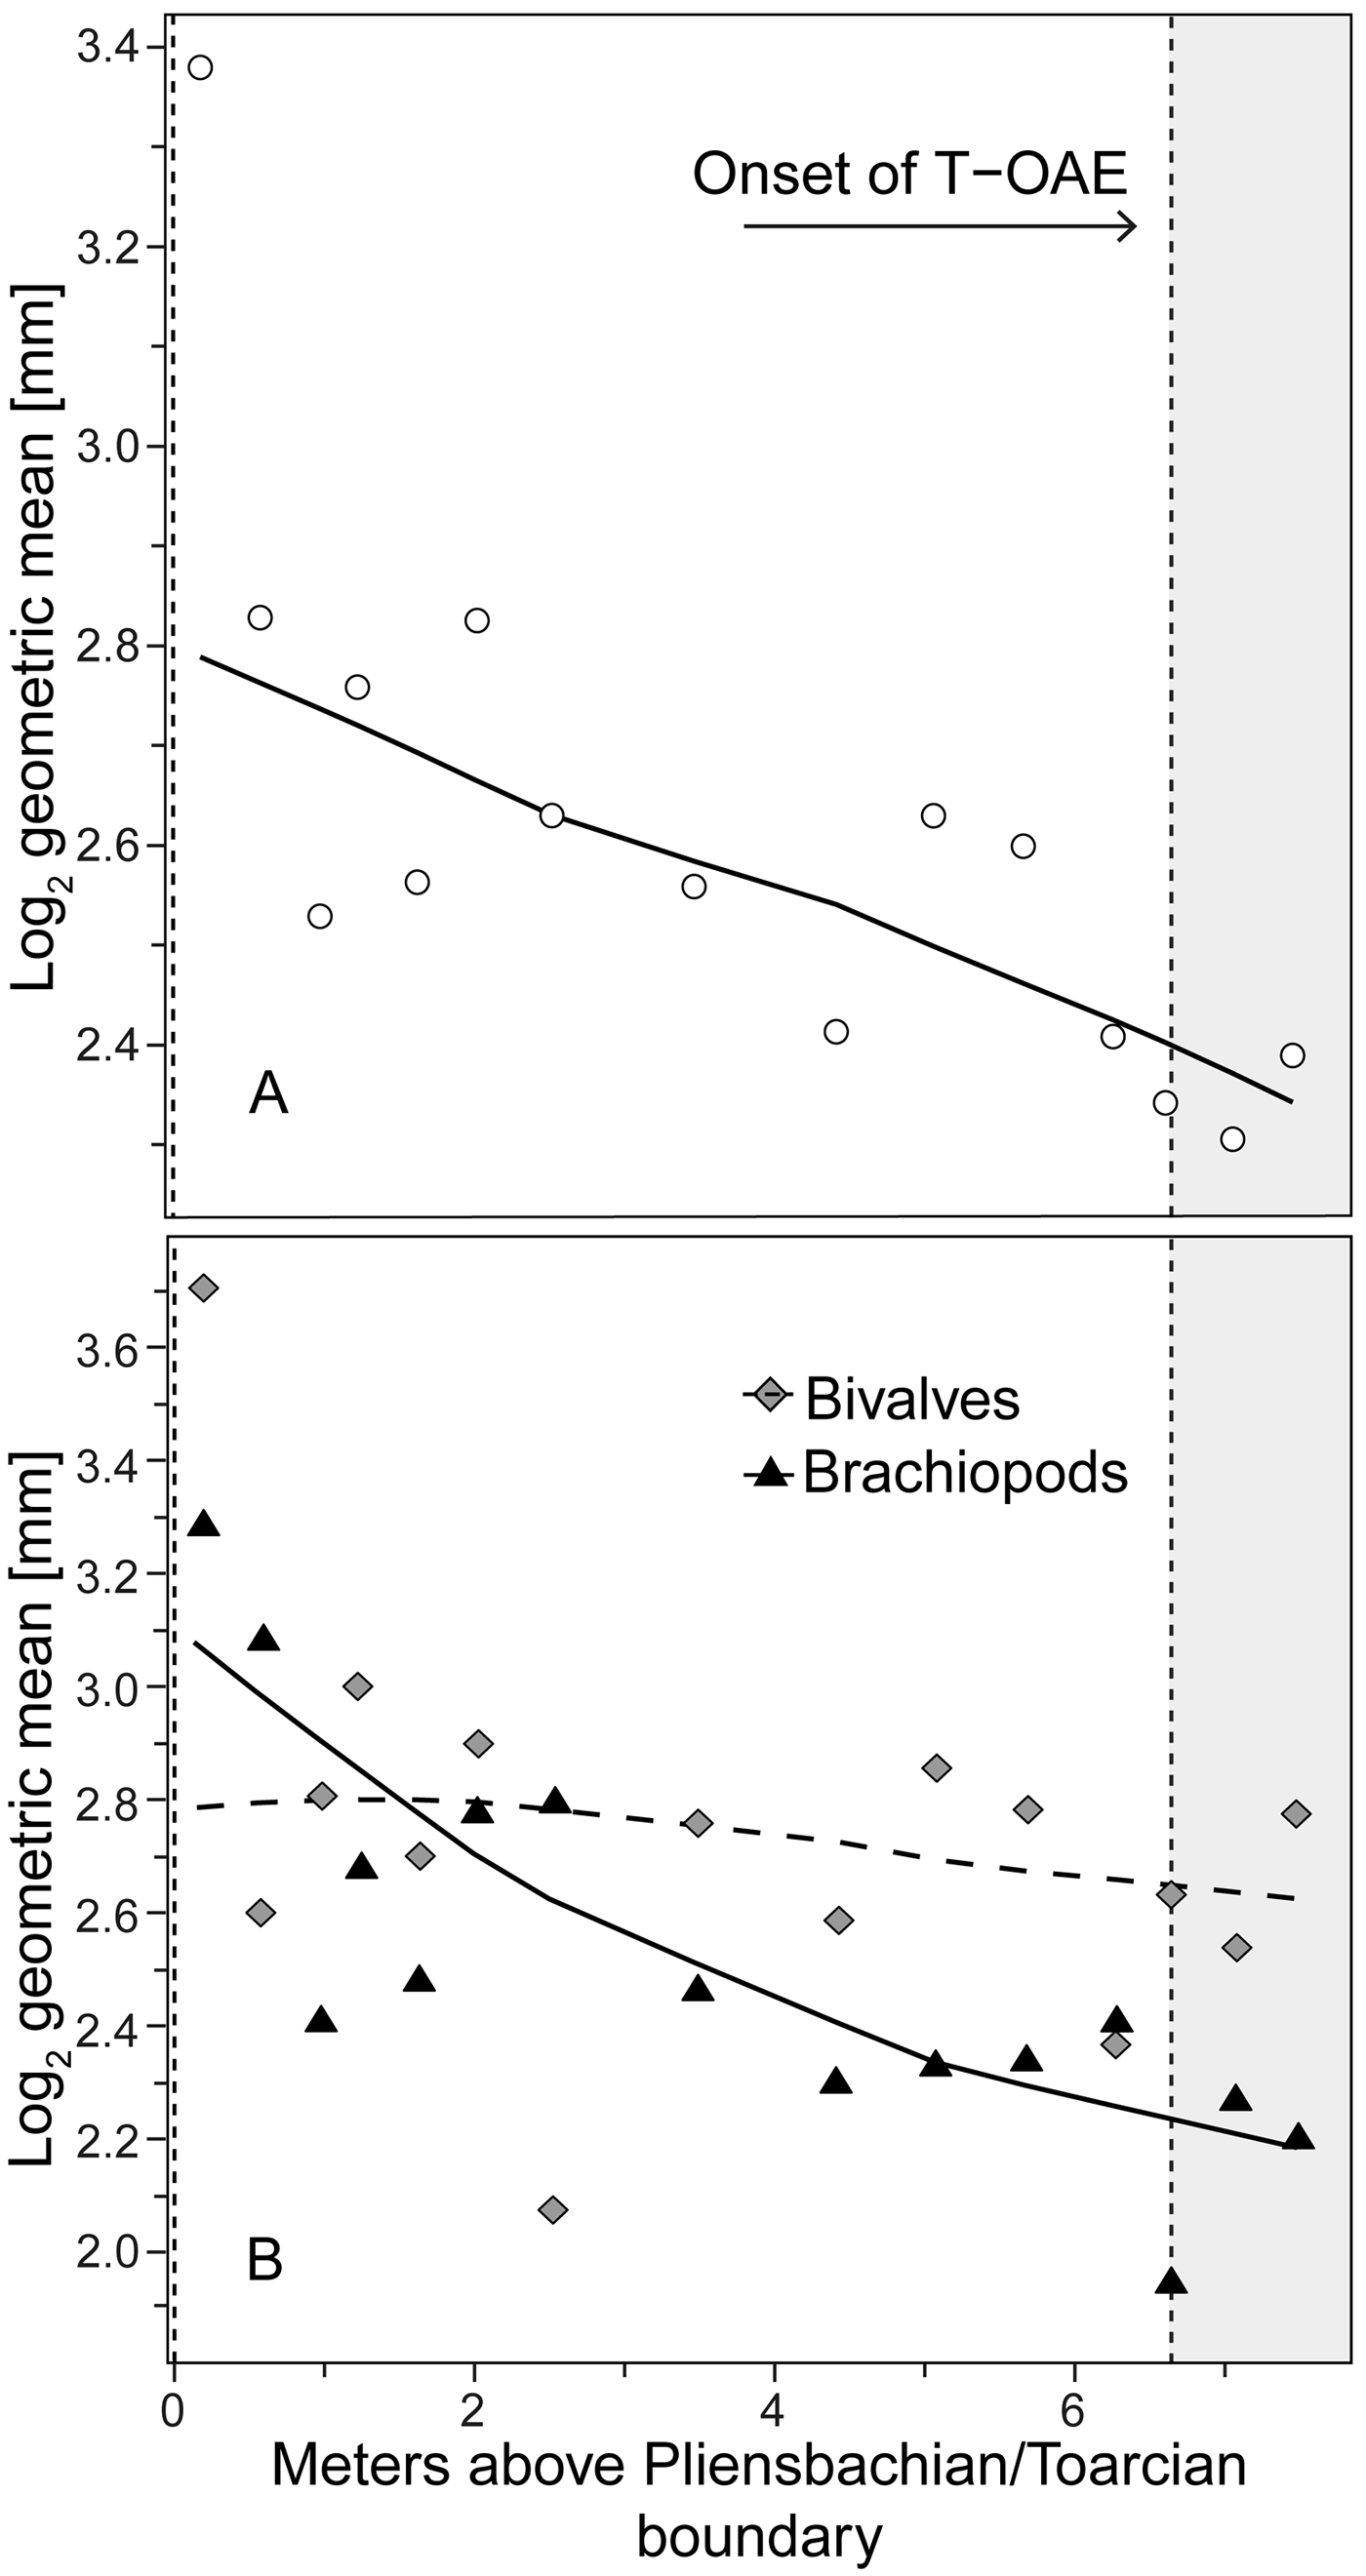
Figure 2. Trends in shell size in the precrisis interval. Shell size is expressed as the mean of the log2 geometric mean of shell length and height in bivalves and shell width and length in brachiopods. A, Mean shell size of the whole bivalve–brachiopod community per sample. B, Mean shell size per sample shown separately for bivalves and for brachiopods. Trend lines are based on weighted LOESS smoothing. The onset of the T-OAE (shaded area) is marked by the vertical dashed line on the right. The vertical dashed line on the left marks the Pliensbachian/Toarcian boundary.
Analysis of the shell size of smaller- and larger-sized species separately, without differentiating between bivalves and brachiopods, shows that stasis is the best fit for the group of larger-sized species (Table 1). For the group of smaller-sized species, stasis and random walk receive equal support. Both models fulfill all the adequacy tests (Table 2), so neither of the two can be preferred on this basis, but a directional trend can be rejected. Also, the related statistical tests using Spearman's rank correlation show no significant trend in either group (Table 3). When bivalves and brachiopods are considered separately (Fig. 3A,B), stasis is the best fit in both smaller- and larger-sized bivalves (Table 1). In smaller-sized and larger-sized brachiopods, both random walk and stasis can be applied, and both models pass all their adequacy tests, while a directional trend can be rejected (Table 2). Spearman's rank correlation tests again show that a significant trend is absent in all these subgroupings (Table 3). Yet, larger-sized species become relatively less abundant over time (Fig. 4A), a pattern prominent in brachiopods (Fig. 4B) but not in bivalves (Fig. 4C). Thus, the significant decrease in shell size across the precrisis interval can primarily be related to the larger-sized brachiopod taxa becoming less abundant with time.

Figure 3. Per sample shell size of larger- and smaller-sized species of brachiopods (A), and bivalves (B). Each symbol in a given sample represents a different species. For further explanations, see Fig. 2. The weighted LOESS smoothing was applied to the mean of the species means.
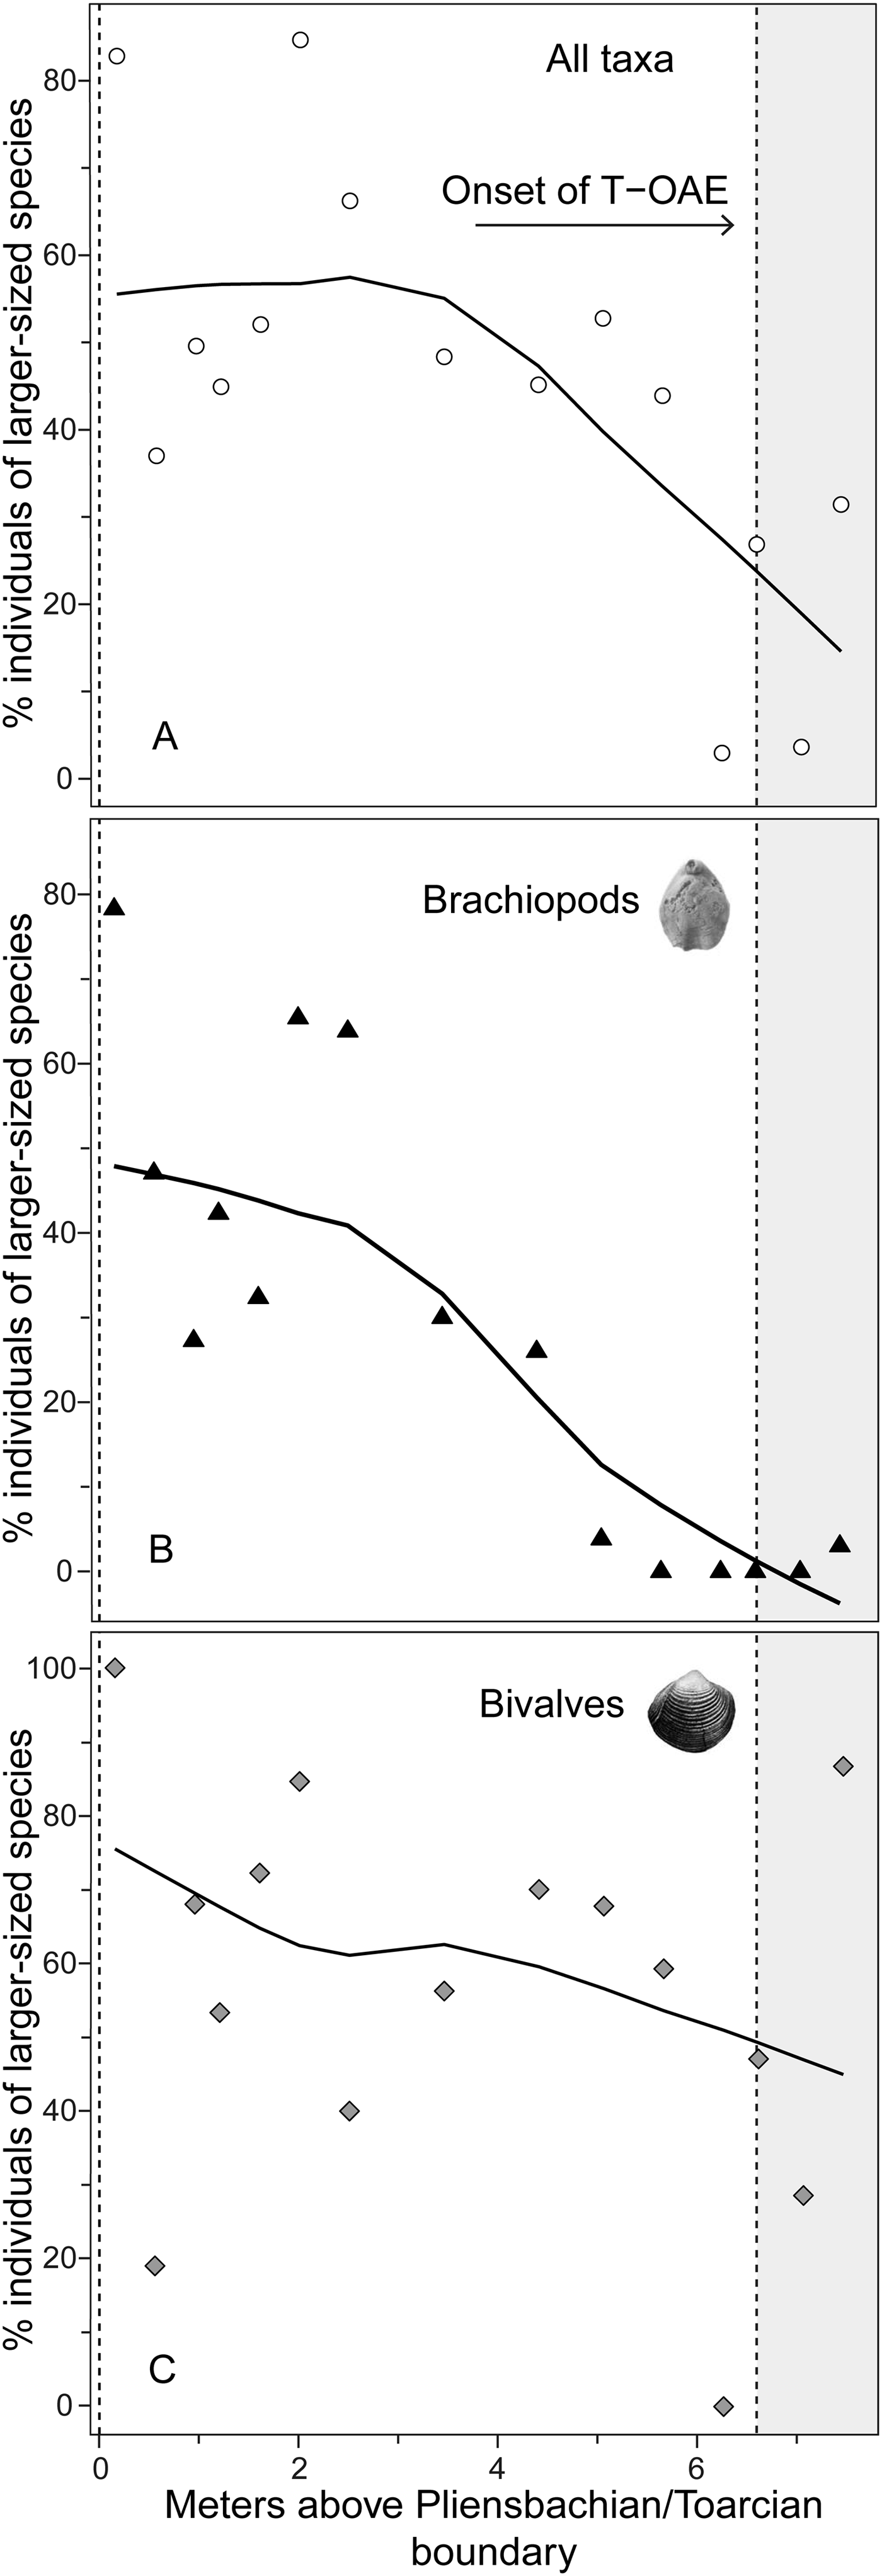
Figure 4. Relative abundance of individuals of larger-sized species in each sample expressed as the percentage of all individuals for the whole bivalve–brachiopod community (A) and for brachiopods (B) and bivalves (C). For further explanations, see Fig. 2.
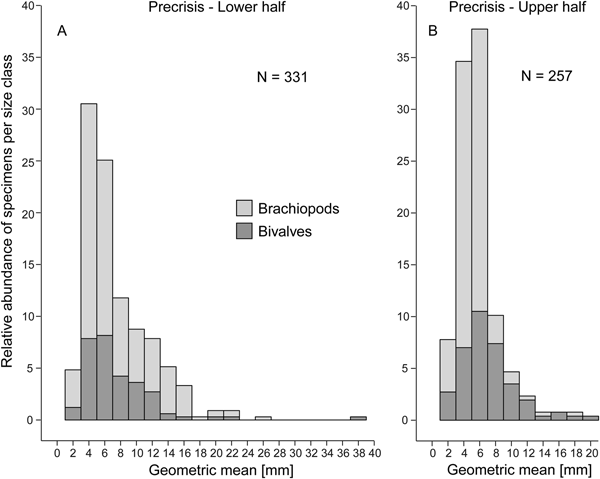
Comparing the size–frequency distributions of the lower and the upper part of the precrisis interval reveals the size classes in which the overall reduction in shell size occurs (Fig. 5). The histograms are right-skewed, with the most common size classes ranging from 3.0 to 7.0 mm. The size classes larger than 21 mm are lost up-section. In brachiopods, larger-sized shells (7.0 to 19 mm) become less common, and shells larger than 19 mm disappear altogether. In bivalves, the few specimens larger than 21 mm disappear, but the other size classes are equally well represented throughout. Statistical comparison of shell sizes in the lower part with those in the upper part of the precrisis interval confirms that brachiopods are smaller in the upper part, whereas no significant difference is evident in bivalves (Table 3).
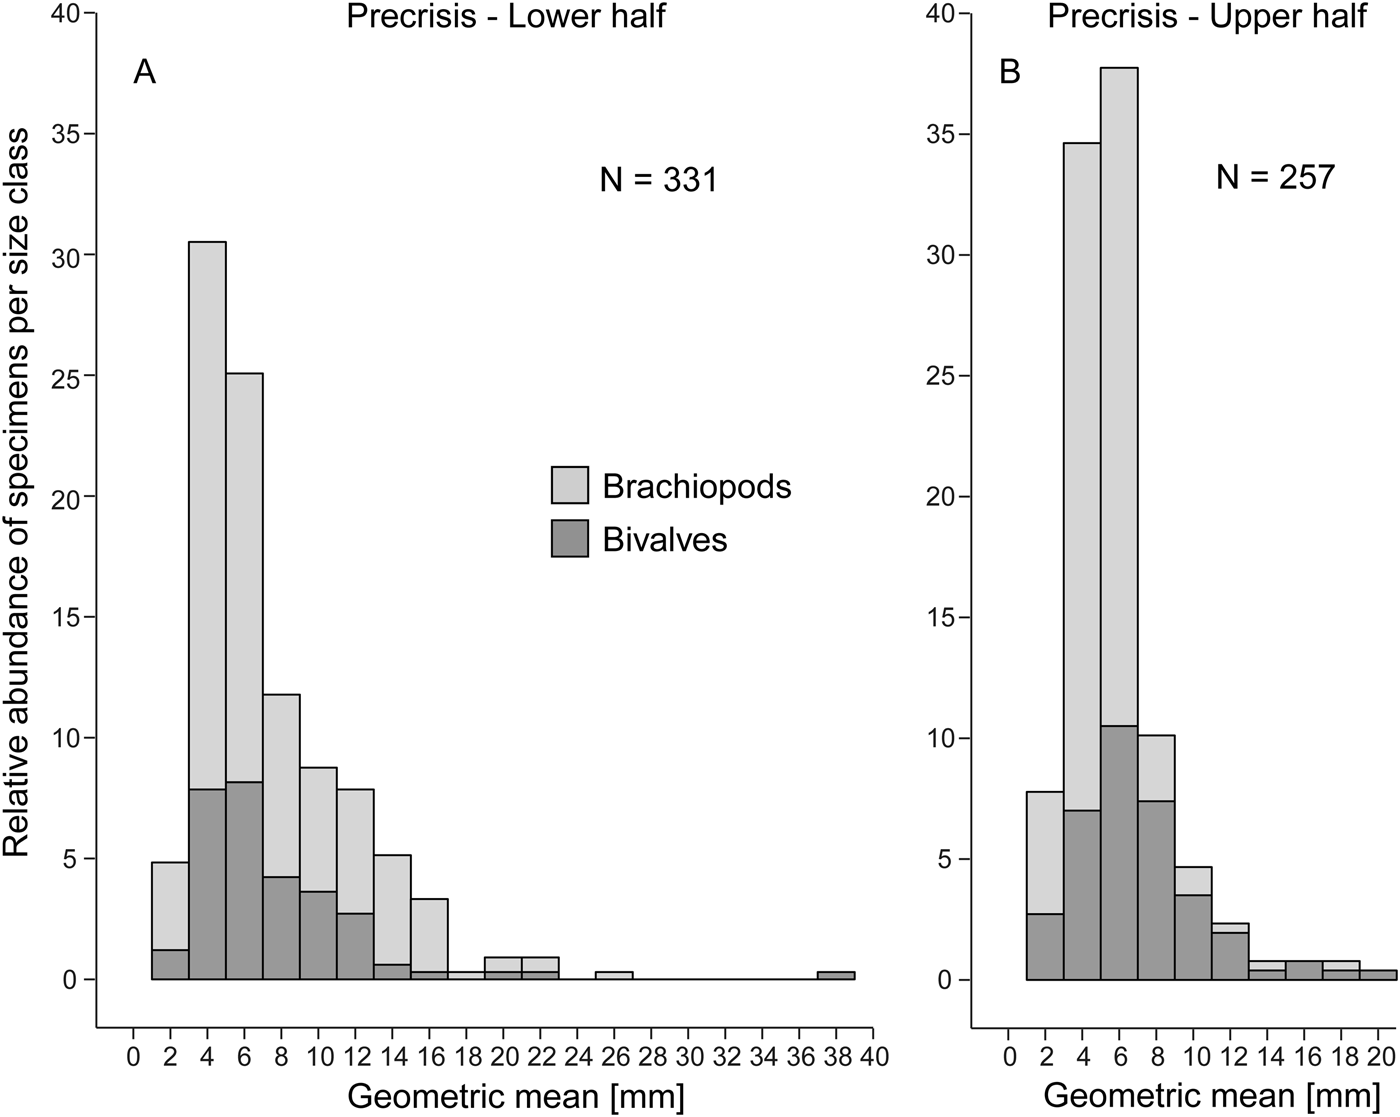
Figure 5. Size–frequency distribution histograms (expressed as percentage) for the lower (A) and upper parts (B) of the precrisis interval. The proportion of bivalves and brachiopods are shown separately as stacked histograms. N = number of measured bivalve and brachiopod specimens.
The size patterns of those few species/genera that are quantitatively best represented in our data are illustrated in Figure 6. In bivalves, H. spinosa shows a fairly uniform trend line of mean and maximum size, with somewhat lower size values in the uppermost part, but this may be caused by low numbers of specimens in some samples. Little net change is also evident in the brachiopods K. liasina and Nannirhynchia pygmaea, with the latter having a slight increase in maximum size across the studied interval. The shells of the terebratulid Zeilleria culeiformis tend to get smaller in the lower part of the section but are again close to their initial sizes at the end of the precrisis interval. The mean size of specimens of Liospiriferina becomes smaller up-section, but maximum size first increases until the trend is reversed before the taxon disappears from our samples.

Figure 6. Trends in shell size in the precrisis interval for selected species. Shell size is expressed as maximum and mean log2 geometric mean (as defined in Fig. 2). For the two species Koninckella liasina and Nannirhynchia pygmaea, the maximum shell length from García Joral et al. (Reference García Joral, Baeza-Carratalá and Goy2018) is plotted as a comparison. Trend lines fit to our data are based on weighted LOESS smoothing. N = number of measured bivalve and brachiopod specimens.
Diversity
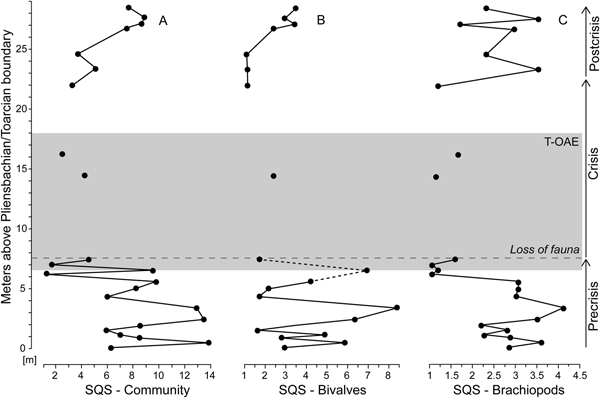
Bivalve–brachiopod communities are moderately diverse throughout the precrisis interval (Fig. 7A). Biodiversity fluctuated in the lower part of the interval and reached its lowest values approximately 1.3 m below the onset of the crisis interval. This diversity minimum interval corresponds to samples strongly dominated by N. pygmaea. Comparing the SQS-based diversity of bivalves and brachiopods (Fig. 7B,C), no distinct trend is observed in bivalves, while brachiopods experience a decline in the upper half of the precrisis interval. Precrisis diversity values are again reached after the crisis in the uppermost 1.8 m of the studied section.
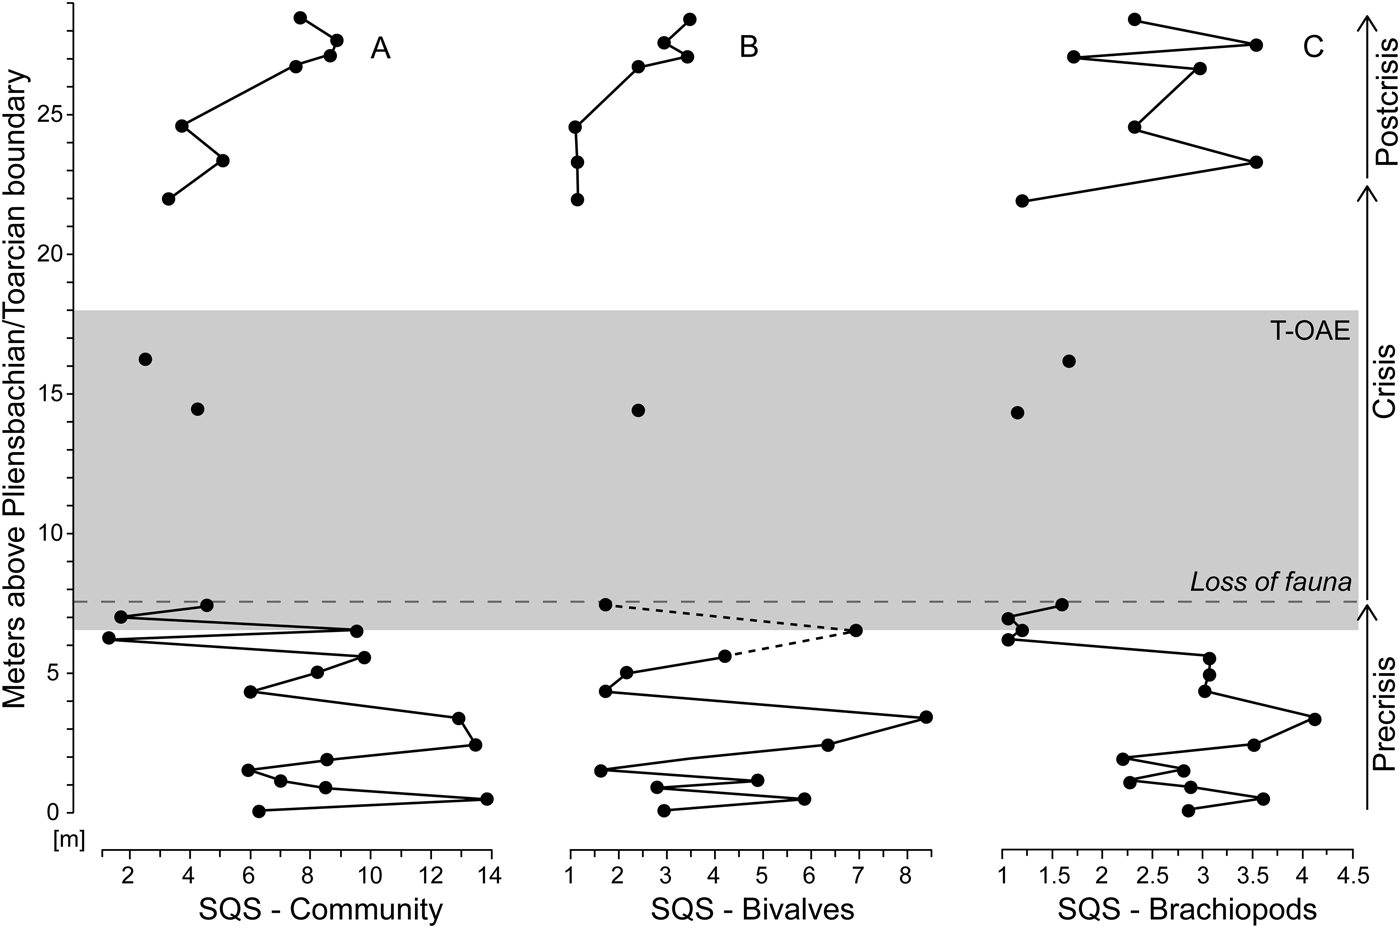
Figure 7. Standardized species richness of faunal samples using the shareholder quorum subsampling (SQS) of Alroy (Reference Alroy2010). Time series of the SQS metric are shown for the whole bivalve–brachiopod community (A) and separately for bivalves (B) and brachiopods (C). For further explanations, see Fig. 1.
Paleolatitudinal Ranges and Thermal Niches
When the thermal affinities of bivalve and brachiopod species are compared (Fig. 8), bivalves present a larger variety of thermal affinities than brachiopods (all four categories are represented) and can be grouped into seven warming-tolerant and nine warming-sensitive species. Brachiopods were assigned to just two categories, being either eurythermal (six species) or stenothermal (three species). If heat stress were the cause of the decline in the proportion of larger-sized brachiopods, the species assigned to this group should be sensitive to temperature rise. However, only one of the four larger-sized brachiopod species is categorized as being sensitive to warming. These results do not corroborate warming as the main driver toward smaller community-level shell size.
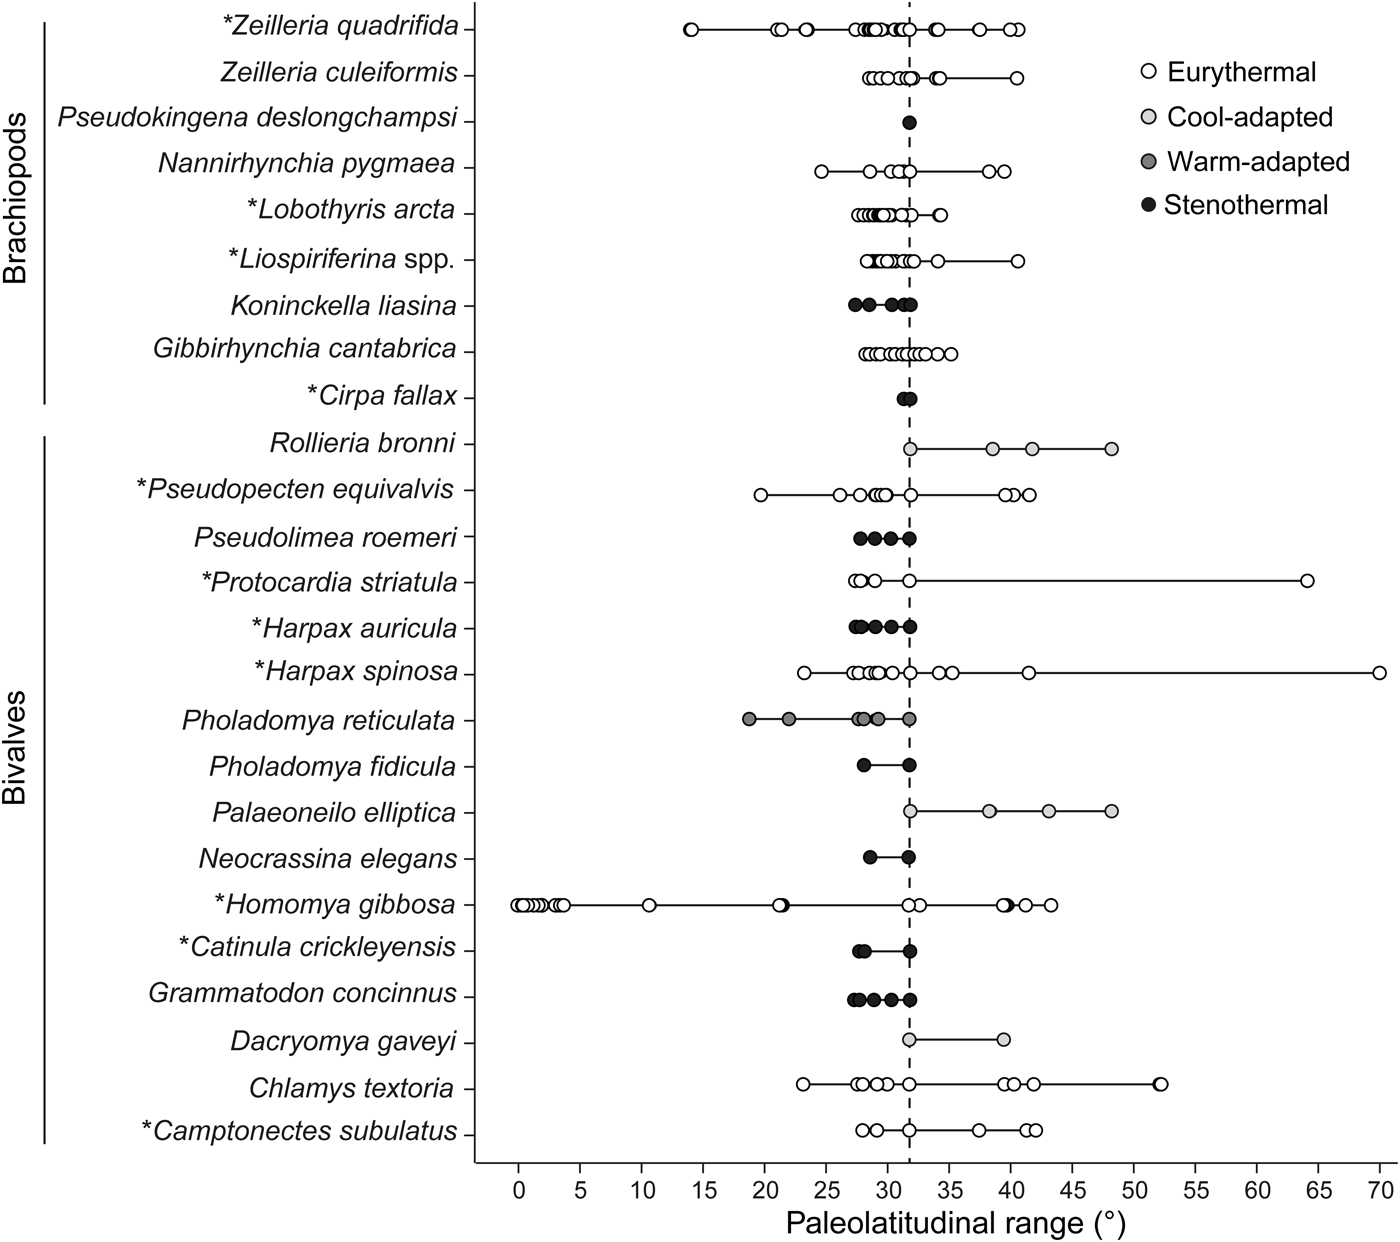
Figure 8. Raw paleolatitudinal distribution of each species recorded from the precrisis interval. Data represent the Pliensbachian–early Toarcian time interval, apart from the bivalve species Homomya gibbosa, for which all Jurassic occurrences were used to circumvent lack of data. The larger-sized species in both bivalves and brachiopods are marked with an asterisk (*). Assuming that latitudinal ranges reflect thermal affinities, species were grouped into four categories relative to the geographic position of our study site. The taxon Liospiriferina spp. includes all species belonging to this genus as recorded in the studied section. For the purpose of this analysis, species identified with reservation (i.e., with the identifier “cf.”) in the Paleobiology Database and the literature were considered as true representatives of the respective species. The vertical dashed line marks the paleolatitude of the Fonte Coberta section.
Discussion
Selective Faunal Response of Brachiopods
We find that brachiopods are more strongly affected before and at the T-OAE than bivalves. Most species belonging to the brachiopod fauna of the Polymorphum Zone went extinct in their distribution area, that is, the northwest European basins and the Mediterranean Province (García Joral et al. Reference García Joral, Gómez and Goy2011, Reference García Joral, Baeza-Carratalá and Goy2018; Baeza-Carratalá Reference Baeza-Carratalá2013; Comas-Rengifo et al. Reference Comas-Rengifo, Duarte, García Joral and Goy2013, Reference Comas-Rengifo, Duarte, Félix, García Joral, Goy and Rocha2015). This selectivity against brachiopods is evident in a drop in brachiopod diversity (Fig. 7) followed by an almost complete faunal turnover across the T-OAE (Fig. 1), as well as significant reductions in mean shell size of brachiopods. Thus, our first hypothesis—that body size declined before the T-OAE—is supported by our results, albeit only selectively for brachiopods. Abundance declines and extirpations of larger-sized taxa before the event are the underlying mechanism of this size reduction in the brachiopod fauna. By contrast, single species and subgroupings of species, such as the group of larger-sized brachiopod species, do not show significant declines in shell size. Thus, our second hypothesis—that larger-sized species were more affected than smaller-sized ones—is only supported in the sense that larger-sized brachiopod taxa became less common over time. It is also apparent that shell size decreased fairly continuously during the precrisis interval (Fig. 2), while diversity only declined in the uppermost part of the precrisis interval (Fig. 7).
Assuming constant sedimentation rates and a duration of the precrisis interval of ~900 kyr, the offset between the abundance decline of larger-sized brachiopod species between 3 and 4 m above the Pliensbachian/Toarcian boundary (Fig. 4) and the drop in species richness at 6 m above the boundary (Fig. 7) would correspond to ~300 kyr. However, this is likely to be an overestimation, because the reduced thickness of the Mirabile Subzone at Fonte Coberta and comparison with the Polymorphum Zone at Peniche (Rita et al. Reference Rita, Reolid and Duarte2016) suggest that the lower part of the Polymorphum Zone is condensed. Notwithstanding this, a temporal decoupling remains, supporting the third hypothesis—that reductions in body size occurred earlier than diversity loss. So-called early warning signals have been hypothesized to predict sudden changes in species composition and ecological structure in present-day ecosystems (Biggs et al. Reference Biggs, Blenckner, Folke, Gordon, Norström, Nyström, Peterson, Hastings and Gross2012; Gsell et al. Reference Gsell, Scharfenberger, Özkundakci, Walters, Hansson, Janssen, Nõges, Reid, Schindler, Van Donk, Dakos and Adrian2016). In analogy, a decline in body size may serve as a precursor of imminent turnover at the community level at geologic timescales.
A recent comparative study of brachiopod shell size during the late Pliensbachian–early Toarcian interval among basins surrounding the Iberian Massif found decreases in shell size as the depositional environments generally became deeper, more turbid, and less oxygenated from the Iberian basins in Spain to the Lusitanian Basin in Portugal (García Joral et al. Reference García Joral, Baeza-Carratalá and Goy2018). Rather than being attributable to miniaturization of species, this trend was caused by a change in taxonomic composition, with small-sized species being more common in the Lusitanian Basin. García Joral et al. (Reference García Joral, Baeza-Carratalá and Goy2018) also investigated within-basin and within-section size changes through time. For the Lusitanian Basin as a whole, they reported smaller maximum and mean shell sizes of N. pygmaea in the Mirabile Subzone than in the Semicelatum Subzone (García Joral et al. Reference García Joral, Baeza-Carratalá and Goy2018: Figs. 3, 4), and thus inferred an increase in shell size over time. Similarly, when plotting maximum shell size of N. pygmaea and of K. liasina in several beds of the Fonte Coberta section (García Joral et al. Reference García Joral, Baeza-Carratalá and Goy2018: Fig. 5), that is, the same section studied here, they found the largest specimens of these small-sized species in the upper part of the Semicelatum Subzone. We contrast the Fonte Coberta size data of García Joral et al. (Reference García Joral, Baeza-Carratalá and Goy2018) with our own data for these two brachiopod species (Fig. 6). The maximum sizes of shells measured by García Joral et al. (Reference García Joral, Baeza-Carratalá and Goy2018) are distinctly larger than those of our specimens. This is likely caused by differing sampling procedures, as we confined our analyses to specimens from the standardized sample size of 15 kg of rock described earlier. Even though our time series of measurements are more complete, the slight increase in the maximum size of N. pygmaea is inferred in both studies. In contrast to our study, García Joral et al. (Reference García Joral, Baeza-Carratalá and Goy2018) also report an increase in maximum shell length for K. liasina, but this interpretation relies on just one data point and should be considered with caution (see Fig. 6). In any case, our main conclusion—that size decrease in the brachiopod fauna was caused by larger-sized species becoming less common or disappearing from the record entirely rather than individual species becoming smaller—is not affected by the interpretations of García Joral et al. (Reference García Joral, Baeza-Carratalá and Goy2018), who did not examine this aspect.
Causes of Biotic Responses
The early Toarcian mass extinction was global in extent and involved the worldwide demise of the brachiopod orders Spiriferinida and Athyridida (Vörös Reference Vörös2002; García Joral et al. Reference García Joral, Gómez and Goy2011; Vörös et al. Reference Vörös, Kocsis and Pálfy2016). The ultimate cause(s) of this event must therefore be global in nature, while the proximate killing mechanisms might still vary depending on the environmental context. Although the factors causing faunal turnover and extinction need not necessarily be the same factors that caused previous change in body size, the shared selectivity against brachiopods makes a common-cause scenario plausible.
A particular threat for marine organisms today is the stress that arises from the coupling of global warming, ocean acidification, and ocean deoxygenation, collectively termed the “deadly trio” (Bijma et al. Reference Bijma, Pörtner, Yesson and Rogers2013). Episodes of mass extinction in the geologic past commonly involve these three stressors (Jenkyns Reference Jenkyns2010), and they also have been considered as a cause for the early Toarcian extinction event (see “Introduction”). Changes in nutrient cycling and productivity may be added as a fourth warming-related stressor, thus adding up to a “deadly quartet.” Because sustained warming promotes ocean stratification, nutrients may be transferred to and trapped in deeper waters, thus reducing global productivity (Moore et al. Reference Moore, Fu, Primeau, Britten, Lindsay, Long, Doney, Mahowald, Hoffman and Randerson2018). Alternatively, an accelerated hydrological cycle could increase regional continental weathering rates and nutrient input into the sea, resulting in eutrophication, expansion of oxygen minimum zones onto the shelf, and toxic algal blooms. Below, we evaluate each of these four main stressors with regard to our own findings.
Identifying the abiotic causes of faunal change in the geologic past often involves facies analysis and evaluation of geochemical proxy data. Integrating multiple biological disciplines by using fossil ecological data, modern ecological data, and physiological data is a relatively new approach in Earth system science to improve understanding of past mass extinctions and current biosphere change and to predict ecological consequences of climate change in the near future (e.g., Knoll et al. Reference Knoll, Bambach, Payne, Pruss and Fischer2007; Calosi et al. Reference Calosi, Putnam, Twitchett and Vermandele2019). Biological concepts such as the concept of oxygen- and capacity-limited thermal tolerance can successfully bridge between physiology and ecology (Pörtner et al. Reference Pörtner, Bock and Mark2017), albeit quantitative links between physiological processes and ecosystem-level processes are still limited. It is less clear to what extent results from physiological experiments can be applied to explain paleoecological patterns. Although physiological experiments can investigate the short-term metabolic costs of environmental stress and thus go beyond merely reporting survival or failure, temporal scaling represents an important difference. While the time-averaged nature of paleoecological data hampers forecasting the near future, physiological experiments with animals last much shorter than even geologically abrupt events of warming or the time necessary for evolutionary adaptation. Physiological limits will still be important at longer timescales, but other processes not captured by experiments will come into play (Peck et al. Reference Peck, Clark, Morley, Massey and Rossetti2009). The following discussion of potential causes of the identified paleoecological patterns includes physiological facets and assumes that the physiological tolerances of species explored in organismic-scale lab experiments can provide information about the sensitivity of taxa to climate-related stressors in the geologic past.
Hypoxia
There is no evidence of low-oxygen conditions in the benthic environments of the Rabaçal section. Total organic carbon levels are generally low (Duarte et al. Reference Duarte, Rodrigues, Oliveira and Silva2005), black shales are lacking (see also Duarte Reference Duarte1997; Duarte et al. Reference Duarte, Oliveira and Rodrigues2007), and bioturbation during both the precrisis and the crisis intervals indicates oxygenated bottom conditions throughout. In particular, the interval corresponding to the T-OAE elsewhere is intensely bioturbated, as indicated by pervasive networks of Thalassinoides burrows, which were produced by crustaceans (see also Miguez-Salas et al. Reference Miguez-Salas, Rodríguez-Tovar and Duarte2017; Rodríguez-Tovar et al. Reference Rodríguez-Tovar, Miguez-Salas and Duarte2017). Crustaceans are sensitive to hypoxia (Vaquer-Sunyer and Duarte Reference Vaquer-Sunyer and Duarte2008), and their apparent former abundance is therefore additional evidence against low-oxygen conditions on and within the seafloor. Limited oxygen availability may have played a role in the deeper parts of the Lusitanian Basin, as represented by the sedimentary record at Peniche (e.g., Hesselbo et al. Reference Hesselbo, Jenkyns, Duarte and Oliveira2007), but apparently not in the mid-ramp setting investigated here.
Ocean Acidification
Bivalves appear to be generally negatively affected by acidification, although some species exhibit neutral or even positive effects (Parker et al. Reference Parker, Ross, O'Connor, Pörtner, Scanes and Wright2013). In the early Toarcian fauna studied herein, bivalves as a group are less affected by size reduction and diversity decline than brachiopods. Their low-magnesium calcite shell makes rhynchonelliform brachiopods more resistant to acidification than organisms with aragonitic or high-magnesium calcite shells (Ries et al. Reference Ries, Cohen and McCorkle2009). Because organisms with aragonitic shells are represented in the precrisis interval (e.g., nuculoid bivalves), we expect that we would have observed any selective pattern against aragonitic species, if present. In previous studies, rhynchonelliform brachiopods had been considered to have minimal physiological buffering capacities of the calcification process, making them sensitive to CO2 stress (e.g., Knoll et al. Reference Knoll, Bambach, Payne, Pruss and Fischer2007). Conversely, recent work on living brachiopods and on material from museum collections from the last 120 years shows little effect of lowered pH conditions on shell growth (Cross et al. Reference Cross, Peck and Harper2015, Reference Cross, Peck, Lamare and Harper2016, Reference Cross, Harper and Peck2018). Selectivity against brachiopods in the reduction of shell size and loss of species at Rabaçal do not conform with the inferred physiological pH tolerance of bivalves and brachiopods; thus, any clear support for acidification from faunal patterns is missing.
Productivity Decline
Unlike mollusks, the brachiopods, and rhynchonellids in particular, can fare relatively well in low-nutrient environments, as they are capable of feeding on both dissolved and particulate organic matter (Steele-Petrović Reference Steele-Petrović1976) and have very low metabolic rates (Peck and Harper Reference Peck and Harper2010). Carbon isotope and nannofossil abundance data indicate mesotrophic to eutrophic, albeit unstable, conditions throughout the early Toarcian in the Lusitanian Basin (Mattioli et al. Reference Mattioli, Pittet, Petitpierre and Mailliot2009; Ferreira et al. Reference Ferreira, Mattioli, Pittet, Cachão and Spanbenberg2015), while high productivity and upwelling are suggested for the anoxic settings in northern and central Europe (e.g., Jenkyns Reference Jenkyns1988, Reference Jenkyns2010). Adding our finding that brachiopods are preferentially affected by environmental perturbations at Rabaçal, a low-productivity scenario is unlikely.
Warming
The temperature increase at the T-OAE was not globally homogeneous. Estimates range from +2°C to +3.5°C in subtropical areas (Dera and Donnadieu Reference Dera and Donnadieu2012), and between +6°C and +8°C at higher latitudes (Dera et al. Reference Dera, Pucéat, Pellenard, Neige, Delsate, Joachimski, Reisberg and Martinez2009; Gómez and Goy Reference Gómez and Goy2011). Reliable oxygen isotope data from the Polymorphum Zone of the studied section are lacking due to the poor preservation of brachiopod shells. However, oxygen isotopes from brachiopods elsewhere in the Lusitanian Basin reveal a first short-lived warming episode in the lowermost Polymorphum Zone, followed by a cooling phase, before a marked warming phase started in the mid-Polymorphum Zone that culminated during the T-OAE in the lowermost Levisoni Zone (Suan et al. Reference Suan, Mattioli, Pittet, Lécuyer, Suchéras-Marx, Duarte, Philippe, Reggiani and Martineau2010). Warming has been suggested as the main cause of brachiopod faunal turnover and diversity decrease in the oxygenated environments of western Europe (e.g., Vörös Reference Vörös2002; García Joral et al. Reference García Joral, Gómez and Goy2011, Reference García Joral, Baeza-Carratalá and Goy2018; Gómez and Goy Reference Gómez and Goy2011; Miguez-Salas et al. Reference Miguez-Salas, Rodríguez-Tovar and Duarte2017). Indeed, the loss of fauna is recorded shortly after the onset of the T-OAE at Rabaçal, suggesting a role of warming in brachiopod extinctions. Evidence that warming was also a main driver of the decrease in mean community-level shell size is equivocal. The thermal affinities inferred for brachiopods from their latitudinal distributions do not hint at temperature stress as the main cause of the size patterns recorded from Rabaçal. On the other hand, modern bivalves are among the organisms with highest upper thermal limits and are therefore one of the most thermally tolerant groups (Song et al. Reference Song, Wignall, Chu, Tong, Sun, Song, He and Tian2014), which would match the pattern of stasis in bivalves. Predictions using physiological responses of brachiopods are made difficult by the scarcity of data regarding their thermal tolerances. An exception is the Antarctic rhynchonellid Liothyrella uva, which exhibits lower thermal tolerance to rapid warming than two simultaneously studied Antarctic bivalve species (Clark et al. Reference Clark, Sommer, Sihra, Thorne, Morley, King, Viant and Peck2017), but results from a single species need not be universally valid for brachiopods as a whole. Clearly, more experimental work on the physiological tolerances of modern brachiopods in the face of multiple stressors is needed to improve our understanding of selective biotic responses to environmental stress.
Conclusions
Long-term decrease on the order of a few hundred thousand years in the mean body size of early Toarcian marine invertebrate communities from the Lusitanian Basin, well before the main phase of local extirpations and biodiversity decrease occurred, suggests that reductions in body size may be one of the first ecological responses to abiotic stressors. Environmental stress acted selectively against specific size classes and taxonomic groups, that is, larger-sized brachiopod species, which became less abundant over time. Future research has to show to which degree the patterns of decreasing shell sizes observed at Rabaçal can be transferred to other ecosystems and thus are general predictors of forthcoming climate-related community turnover in ancient ecosystems.
In contrast to many other regions, geologic and paleontological evidence from Rabaçal is against a role of hypoxic conditions as a driver of both body-size decrease and faunal loss. Similarly, a reduced oceanic pH alone seems incompatible with the observed faunal trends, although a definitive conclusion is hampered by the scarcity of comparative experimental data from bivalves and brachiopods under elevated CO2 conditions. Heat stress is a plausible main cause of diversity decline and elevated early Toarcian extinction intensity in aerated environments. The rising paleo-temperatures from the mid-Polymorphum Zone to the earliest Levisoni Zone, as inferred from oxygen isotopes, are also compatible with heat stress as a driver of the precrisis decrease in shell size. However, biotic evidence is equivocal at present, because the selective size decline of early Toarcian brachiopods is not matched by their thermal affinities as inferred from their latitudinal distributions, and the physiological response of brachiopods to warming has hardly been studied experimentally. Rising temperature and increasing pCO2 may have operated additively or synergistically in our study system with different combined effects than when acting individually. Examination of more specific physiology-based hypotheses on biotic change, combined with analysis of multiple proxy data on changing environmental conditions, will likely improve our understanding of the interactions between abiotic stressors and biotic responses in the studied early Toarcian succession and beyond. Yet, identifying the exact role of individual players in the “deadly quartet” of warming, ocean acidification, ocean deoxygenation, and productivity change will remain a big challenge in the analysis of ancient ecosystems.
Acknowledgments
This work was funded by the Deutsche Forschungsgemeinschaft grant DFG AB 09/10-1 and is part of the Research Unit TERSANE (FOR 2332: Temperature-related Stressors as a Unifying Principle in Ancient Extinctions). This research is also a contribution to the IGCP-655 (IUGS-UNESCO: Toarcian Oceanic Anoxic Event: Impact on Marine Carbon Cycle and Ecosystems). We are grateful to W. Foster (Museum für Naturkunde) and S. Schneider (Cambridge Arctic Shelf Programme) for commenting on earlier versions of the article. T. Klein and F. Lucassen (Center for Marine Environmental Sciences, University of Bremen) and S. Schneider (Cambridge Arctic Shelf Programme) are warmly thanked for the joint fieldwork in Portugal. Comments from L. Harper (University of Cambridge) and an anonymous reviewer substantially improved an earlier version of this article.


