


Higher intakes of whole grains are associated with lower risk of CVD in several large prospective cohort studies(Reference Aune, Keum and Giovannucci1–Reference Wu, Flint and Qi3), and whole grain intake is now widely encouraged within national dietary guidelines, including the UK Eatwell Guide(4). The association may manifest through several pathways, as whole grain intake has been linked to the management of various CVD mediators, including glycaemic control(Reference Marventano, Vetrani and Vitale5), plasma lipids(Reference Esmaillzadeh, Mirmiran and Azizi6) and inflammation(Reference Qi, van Dam and Liu7).
The specific components of whole grains that may be responsible are unclear. Whole grains are a rich source of dietary fibre, and cereal fibre specifically has been found to be particularly protective against CVD(Reference Threapleton, Greenwood and Evans8–Reference Kim and Je10). In addition, whole grains contain constituents such as vitamin E, magnesium, folate and polyphenols, all of which may contribute to their benefits(Reference Slavin11). In fact, it is thought that their cardiovascular benefit may be a result of interactions that occur when these nutrients are consumed together within the whole grain, and the consumption of these nutrients individually (e.g., cereal fibre added to non-whole grain products) may not yield the same benefits(Reference Jacobs, Pereira and Meyer12).
Previous studies attempting to explore this question are limited by considerable inconsistency in the methods used to define whole grains and estimate intakes(Reference Newby, Maras and Bakun13,Reference Huang, Xu and Lee14) . Many studies defined whole grain to include added bran and germ(Reference Newby, Maras and Bakun13,Reference Huang, Xu and Lee14) and classified whole foods as either entirely whole grain or refined grain(Reference Newby, Maras and Bakun13), rather than determining the whole grain content of foods on a grams-per-100 g basis. These methods have the potential to misestimate true whole grain intake, which confounds results and makes it difficult to accurately determine if findings can be attributed specifically to whole grains. We recently reviewed existing observational studies exploring whole grains, bran and cereal fibre and the risk of CVD and CVD-related outcomes(Reference Barrett, Batterham and Ray15). We found that when studies defined whole grains as including the germ, endosperm and bran in their natural proportions, results were stronger and less likely to be attenuated after adjusting for individual whole grain components such as cereal fibre intake, potentially due to poorer-quality non-whole grain foods weakening any associations.
The aim of the current study was to examine and directly compare associations between intakes of whole grain and cereal fibre and CVD risk factors among adult participants of the UK National Diet and Nutrition Survey (NDNS) Rolling Programme (RP) 2008–2014. Whole grain and cereal fibre intakes were estimated using the nutrient composition data for all foods reported within the surveys, contained within the UK NDNS Nutrient Databank(16). Whole grain and cereal fibre content of all foods was estimated using accepted definitions and as grams-per-100 g of the food item, ensuring all whole grain and cereal fibre intake was captured, including from food items contributing small amounts. The current study also aimed to explore the composition of diets containing varied amounts of whole grain and cereal fibre, particularly those diets that may be high in whole grain but low in cereal fibre, or high in cereal fibre but low in whole grain.
Methods
Study population
The current study was a secondary analysis of data from the NDNS RP 2008–2014, collected between February 2008 and August 2014 and archived within the UK Data Service(16). NDNS RP is a continuous, cross-sectional survey designed to collect information on dietary intake and nutritional status of privately dwelling people within the UK aged ≥18 months, covering a nationally representative sample of approximately 1000 people (minimum of 500 adults and 500 children) per year. Detailed methodology of the NDNS RP survey has been described elsewhere(17). The survey is carried out under approval from the National Research Ethics Service (NRES) Research Ethics Committee (REC). All participants or legal guardians of participants provided informed consent.
A total of 9374 participants were included in NDNS RP 2008–2014. For the purpose of our analysis, we excluded participants who were under 18 years (n 4427). Additionally, we excluded under-reporters of energy intake (n 1956) using the Goldberg cut-off method(Reference Goldberg, Black and Jebb18). As body weight was needed for this method, participants who did not have a valid body weight recorded were also excluded (n 302). After exclusions, 2689 participants remained in the analysis. However, among these participants, there was further missing data for particular risk factors included in our analyses. Thus, the available sample size varied somewhat between risk factors as follows: BMI (n 2658), waist–hip ratio (n 2107), systolic blood pressure (n 1673), total cholesterol and HDL-cholesterol (n 1481), LDL-cholesterol (n 1465), TAG (n 1477), fasting glucose (n 1416), HbA1c (n 1445), C-reactive protein (CRP; n 1481) and homocysteine (n 1250). CVD relative risk score, determined using the Systematic Coronary Risk Evaluation (SCORE) charts(19) developed by the European Society of Cardiology (ESC), was also included as a risk factor in analyses, conducted with smokers included (n 1182) and without smokers included (n 1023).
Dietary intake assessment
Dietary intake data were collected via a 4-d estimated food diary, completed by the participants on consecutive days with the assistance of survey interviewers. Participant nutrient intakes were estimated from the diaries using food composition data from the UK NDNS Nutrient Databank(16). The Nutrient Databank includes approximately 5900 food codes. Nutrient values were generated based on a nutrient analysis (analytical and indirect analyses) of foods. Values were regularly updated based on manufacturers’ data and food label data. Further details on dietary collection and analysis process have been published elsewhere(Reference Lennox, Whitton and Roberts20).
Estimation of whole grain and cereal fibre content/intakes
Whole grain and cereal fibre content of each food item reported by the participants were estimated using the Nutrient Databank and the Food Standards Agency Standard Recipes Database(21). The Recipes Database consists of approximately 9200 foods, of which 7044 are recipes reported in UK national nutrition surveys, including the NDNS. It provides information on the gram amount of each ingredient in 100 g of each recipe (i.e., proportion of ingredients). It is compatible with the Nutrient Databank, as they both use the same food identification codes.
For the current study, whole grain and cereal fibre databases were built from the Recipe Database. In order to do this, each elementary ingredient (i.e., ingredients within the database that are not broken down further) was assessed by a researcher (EMB) to identify if it was a whole grain and/or a source of cereal fibre. To be considered a whole grain, an ingredient was required to be a grain containing the endosperm, germ and bran components, whether in intact, ground, flaked or otherwise processed form. This matches the recently released definition of a whole grain food ingredient by the International Whole Grain Initiative (WGI)(22). The use of this classification meant that bran ingredients (e.g., oat bran) were not considered a whole grain. Examples of whole grain ingredients included rolled oats, brown rice, 100 % wholemeal flour and popcorn with no added fat or sugar. Cereal fibre was interpreted as all fibre that is derived from a cereal grain source, whether whole grain or refined. Therefore, all cereal grain-sourced ingredients, including items such as 100 % wholemeal flour, cornflour, oat bran and white rice, were cereal fibre-containing ingredients. Two pseudo-cereal grains, buckwheat and quinoa, were also contained within the database as ingredients. Both pseudo-cereal grains were considered a whole grain ingredient and a source of cereal fibre in the current analysis due to their similar nutritional composition, preparation and use to cereal grains(Reference van der Kamp, Poutanen and Seal23), which is also consistent with the WGI definition(22).
If the ingredient was determined as a whole grain, for example, 100 % wholemeal flour, it would be assigned a whole grain value equal to its dry weight per 100 g (100 g water content/100 g). Similarly, if an ingredient was determined as a source of cereal fibre, for example, cornflour, it would be assigned a cereal fibre value (g/100 g), equal to its total dietary fibre content (g/100 g) reported within the database. If the ingredient was a non-grain food, such as red apple, it would be assigned a cereal fibre value of 0 g/100 g and a whole grain value of 0 g/100 g.
An automated background calculation, a feature of the database, then generated a gram value for whole grain and cereal fibre per 100 g of all recipes (foods with multiple ingredients) based on the proportion of ingredients. For example, for a cereal bar containing 20 % raw oatmeal and no other cereal-based ingredients, if the whole grain content of oatmeal was 90 g/100 g, the gram whole grain content of the cereal bar was calculated using equation (1):
 $$20\,{\rm{\% \;oats}} \times {\rm}90\,{\rm{g\;whole\;grain\;in\;}}100\,{\rm{g\;of\;oats\;}} \\= 18\,{\rm{g\;whole\;grain\;in\;}}100\,{\rm{g\;of\;cereal\;bar}}.$$
This step enabled the Recipes Database to be populated with whole grain and cereal fibre values of all foods, including ingredients (e.g., 100 % wholemeal flour) and complex foods (e.g., cereal bar). Each value was examined and compared with previously developed estimations(Reference Jones, Mann and Kuznesof24), and issues were resolved by manual correction using product labels and manufacturer information. After manual examination and corrections, final whole grain values estimated within the Recipe Database were applied to all food data within the Nutrient Databank.
Final cereal fibre values were determined using the same method as described above, with an additional step. To account for a slight variation in nutrient composition recorded for each mixed recipe within the Nutrient Databank compared with disaggregated nutrient composition within the Recipe database, the cereal fibre values of each food calculated from the Recipe database were applied as a proportion of total dietary fibre recorded within the Recipe database. This ratio was then applied to the total dietary fibre as recorded within the Nutrient Databank to determine the final cereal fibre values (equation (2)).
Dietary fibre values of foods recorded within 6 years of the Nutrient Databank varied slightly across years due to various reasons, such as product reformulation. Therefore, we applied the above approach separately and retrospectively for all survey years, dating back to NDNS Year 1 (2008/2009).
 $$\begin{array}{l}
\frac{{{\rm{Recipe database cereal fibre content}}\,\left( {\frac{8}{{100\,{\rm{g}}}}} \right)}}{{{\rm{Recipe database total fibre content}}\,\left( {\frac{8}{{100\,{\rm{g}}}}} \right)}}\\
\,\,\,\,\, \times \,{\rm{Nutrient Databank total fibre content}}\,\left( {\frac{8}{{100\,{\rm{g}}}}} \right)\\
\,\,\,\,\, = {\rm{final cereal fibre content}}\,\left( {\frac{8}{{100\,{\rm{g}}}}} \right)
\end{array}$$
$$\begin{array}{l}
\frac{{{\rm{Recipe database cereal fibre content}}\,\left( {\frac{8}{{100\,{\rm{g}}}}} \right)}}{{{\rm{Recipe database total fibre content}}\,\left( {\frac{8}{{100\,{\rm{g}}}}} \right)}}\\
\,\,\,\,\, \times \,{\rm{Nutrient Databank total fibre content}}\,\left( {\frac{8}{{100\,{\rm{g}}}}} \right)\\
\,\,\,\,\, = {\rm{final cereal fibre content}}\,\left( {\frac{8}{{100\,{\rm{g}}}}} \right)
\end{array}$$The final estimated values of whole grain and cereal fibre content of each food and the total amount of foods consumed by each participant were used to estimate total whole grain and cereal fibre intake of each participant. Intake of respondents for each day of the survey (days 1–4) was calculated by multiplying the percentage whole grain or cereal fibre content of each consumed food (g/100 g) by the total amount of that food consumed that day (g).
The multiple source method (MSM)(Reference Harttig, Haubrock and Knuppel25) was used to establish the usual intake of whole grain and cereal fibre based on all 4 d of data from food diaries. The method employs a three-step formula using two separate regression models that considers the probability of consumption, usual intake on consumption days and usual intake on all days. Age and sex were included in the regression models as covariates assumed predictive of consumption. Further details of the process have been described elsewhere(26). MSM was also applied to all dietary data included within the analyses as descriptive data or covariates.
Outcome assessment
Height (cm) and weight (kg) of the participants were measured using stadiometer and digital scales, respectively, and BMI was calculated from these measurements. Waist and hip circumference (cm) were measured by a nurse during the follow-up visit using an insertion tape, from which the waist–hip ratio was calculated.
Blood pressure was measured using an automated blood pressure monitor (Omron HEM 907) three times at 1-min intervals. If at least one of the three readings were not valid, the participant’s blood pressure measurements were excluded. LDL-cholesterol, TAG and fasting glucose results were only included where fasted blood samples were taken. All risk factors analysed within the current study were collected from the participants of all 6 years of NDNS RP, except for homocysteine, which was not collected in the sixth year. More information on the collection and analysis of blood samples has been published previously(Reference Nicholson, Young and Winship27).
Current recommendations for the prevention of CVD emphasise the need to assess the individual’s total burden of risk rather than singular risk factors(28). CVD relative risk was determined for the participants using the ESC SCORE risk chart(19). The chart was derived using combined data from twelve European cohort studies comprising over 200 000 persons representing 2·7 million person-years of follow-up with 7934 cardiovascular deaths recorded(Reference Conroy, Pyörälä and Fitzgerald29). The chart predicts the relative risk of fatal cardiovascular events by age and sex using predictors such as smoking status, systolic blood pressure and total cholesterol. To explore the significance that the potential confounder smoking status had on the overall risk score, we performed the analysis both including and excluding current smokers. Further details of the SCORE chart have been published previously(Reference Conroy, Pyörälä and Fitzgerald29). Unlike all other outcomes analysed, which were measured and collected by the NDNS personnel at the time of the survey, CVD relative risk score was calculated by the authors prior to analyses.
Lifestyle factors and demographic assessment
Participants completed a face-to-face computer-assisted person interview (CAPI) to record information on ethnicity, employment status, educational background, household income, smoking and alcohol intake. Participants were also asked about current medications, including prescription and/or use of lipid-lowering or blood pressure-lowering medications.
As there was considerable missing data on physical activity, it was not included as a variable in the analysis of the total dataset. Instead, physical activity as recorded using the Recent Physical Activity Questionnaire (RPAQ) within the NDNS years 2–6 (year 1 used a bespoke method) was included in a post hoc sensitivity analysis of available data. RPAQ is a validated self-completion questionnaire designed to capture physical activity undertaken at home, at work, while commuting and during leisure activities(Reference Golubic, May and Benjaminsen Borch30). For each reported activity, metabolic equivalent of task (MET) scores(Reference Ainsworth, Haskell and Whitt31) were assigned. The time (h/d) that participants reported performing moderate to vigorous activity (MET ≥ 3·0) was used to indicate physical activity levels.
Statistical analysis
Statistical analyses were conducted using Stata software, version 14.0 (StataCorp LP). Weighting was applied to all data to adjust for sampling and non-response error. Full details of the weighting process have been published previously(Reference Tipping32). For the purpose of analyses, participants were divided into quartiles of energy-adjusted (g/10 MJ per d) whole grain and cereal fibre intake to be analysed separately. Energy-adjusted intakes were used in the analyses to better reflect whole grain/cereal fibre density of the diet. For both dietary variables, lowest energy-adjusted intakes were categorised in quartile 1 (Q1) and highest intakes were categorised in quartile 4 (Q4).
The characteristics and dietary intakes of participants within each quartile of whole grain and cereal fibre intake were examined. Associations across quartiles with continuous variables (e.g., age) were tested with linear regression analysis and a test for trend, whereas associations with categorical variables (e.g., sex) were tested with a chi-square analysis. Separate linear regression models were then used to determine associations between whole grain and cereal fibre and each risk factor examined. CVD risk factors that were not normally distributed (TAG and homocysteine levels) were log-transformed prior to analyses. Tobit regression was used for the analysis of CRP, as the data were left censored. Adjusted mean values of each CVD risk factor were predicted for each quartile of whole grain and cereal fibre intake, and a test for linear trend was then used to examine the significance of associations. Statistical significance for all tests was set at P < 0·05.
In the simple models, adjustments were made for age and sex. The multivariate models were adjusted for relevant covariates, specific to each CVD risk factor. Dietary covariates included intake of total energy, saturated fat, trans fat, Na and non-milk extrinsic sugars (sugars not contained within the cellular structure of a food, except lactose in milk and milk products(33)). Ethnicity, smoking status and alcohol intake were also included as covariates within the multivariate models. Beyond the multivariate model, adjustments for BMI and blood pressure or cholesterol-lowering medication were also made where relevant, and whole grain associations were further adjusted for cereal fibre intake.
High whole grain/low cereal fibre and low whole grain/high cereal fibre diets
The diets of participants in the lowest quartile of whole grain intake (Q1) and the highest quartile of cereal fibre intake (Q4) (low whole grain/high cereal fibre) and that of participants in the highest quartile of whole grain intake (Q4) and the lowest quartile of cereal fibre intake (Q1) (high whole grain/low cereal fibre) were examined. As there were few participants meeting these criteria, statistical analysis comparing these diets may not be meaningful. Instead, foods making up these meal patterns were reviewed descriptively to provide an insight into the composition of these diets.
Results
There were 5860 foods in the databank recorded from NDNS RP 2008–2014. Of these, 454 foods (7·7 %) were estimated to contain at least 0·1 g whole grain/100 g, and 2088 foods (35·6 %) were estimated to contain at least 0·1 g cereal fibre/100 g, meaning approximately 21·7 % of cereal fibre-containing foods contained some whole grain ingredients. The highest sources of whole grain were 100 % whole grain foods with relatively low water content, including popcorn (plain with no added fat, sugar or salt) (95·9 g/100 g), corn cakes (100 % maize) (95·4 g/100 g), raw wild rice (91·7 g/100 g) and raw oatmeal (91·1 g/100 g). The highest sources of cereal fibre in the database were bran wheat (33 g/100 g), All Bran™ cereal (Kellogg’s brand only) (25·1 g/100 g) and all-bran cereal (other brands) (23·6–24·3 g/100 g), which notably all contained no whole grain but were instead high sources of bran.
Descriptive characteristics and dietary intakes of participants are outlined in Tables 1 and 2. Age was positively associated with whole grain (P < 0·0001) and cereal fibre intake (P = 0·017). Participants within Q4 of energy-adjusted whole grain intake reported lower consumption of total energy (P < 0·0001), total fat (P = 0·003), saturated fat (P = 0·01), monounsaturated fat (P = 0·0001) and Na (P = 0·05). They reported consuming more cereal fibre, total dietary fibre, carbohydrate (P < 0·0001 for all) and protein (P = 0·04). They were more likely to have graduated from university (within the UK) (P < 0·0001), had a significantly higher equivalised household income (P = 0·0001) and were less likely to smoke (P < 0·0001).
Table 1 Characteristics and nutrient intakes according to quartiles of energy-adjusted whole grain intake among participants of National Diet and Nutrition Survey Rolling Programme 2008–2014
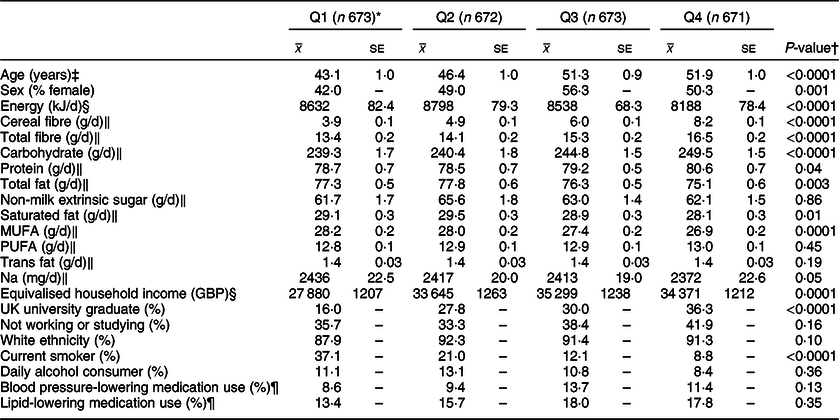
* Median whole grain intake (g/10 MJ per d): Q1 3·0, Q2 20·1, Q3 38·9 g, Q4 68·8.
† Associations with continuous variables were tested with linear regression analysis and a test for trend; associations with categorical variables were tested with a chi-square analysis.
‡ Adjusted for sex.
§ Adjusted for age and sex.
‖ Adjusted for age, sex and total energy intake (kJ/d).
¶ Based on the data available from a smaller sample of participants (n 2128).
Table 2 Characteristics and nutrient intakes according to quartiles of energy-adjusted cereal fibre intake among participants of National Diet and Nutrition Survey Rolling Programme 2008–2014
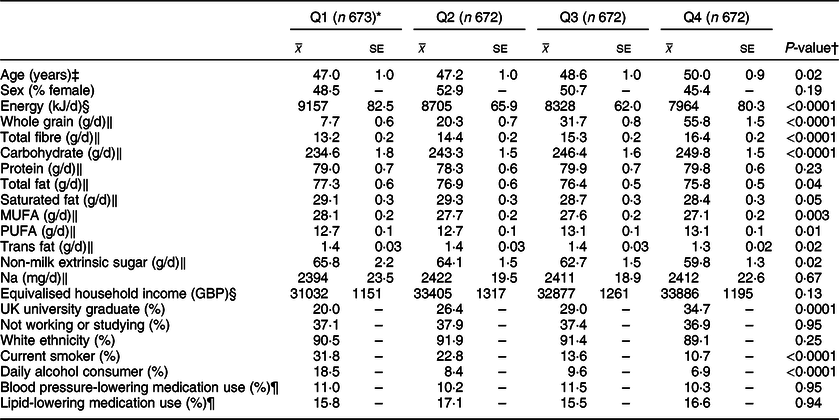
* Median cereal fibre intake (g/10 MJ per d): Q1 4·0, Q2 5·7, Q3 7·4, Q4 9·8.
† Associations with continuous variables were tested with linear regression analysis and a test for trend; associations with categorical variables were tested with a chi-square analysis.
‡ Adjusted for sex.
§ Adjusted for age and sex.
‖ Adjusted for age, sex and total energy intake (kJ/d).
¶ Based on the data available from a smaller sample of participants (n 2128).
A review of the key characteristics of participants in the highest quartile of energy-adjusted cereal fibre intake (Q4) showed similar patterns, reporting lower amounts of total energy (P < 0·0001), total fat (P = 0·04), saturated fat (P = 0·05), trans fat (P = 0·02), monounsaturated fat (P = 0·003) and added (non-milk extrinsic) sugar (P = 0·02). They reported consuming more whole grain, total dietary fibre, carbohydrate (all P < 0·0001) and polyunsaturated fat (P = 0·01). Significantly fewer participants in Q4 were current smokers or daily alcohol consumers (both P < 0·0001), and they were significantly more likely to have graduated from a university (within the UK) (P = 0·0001).
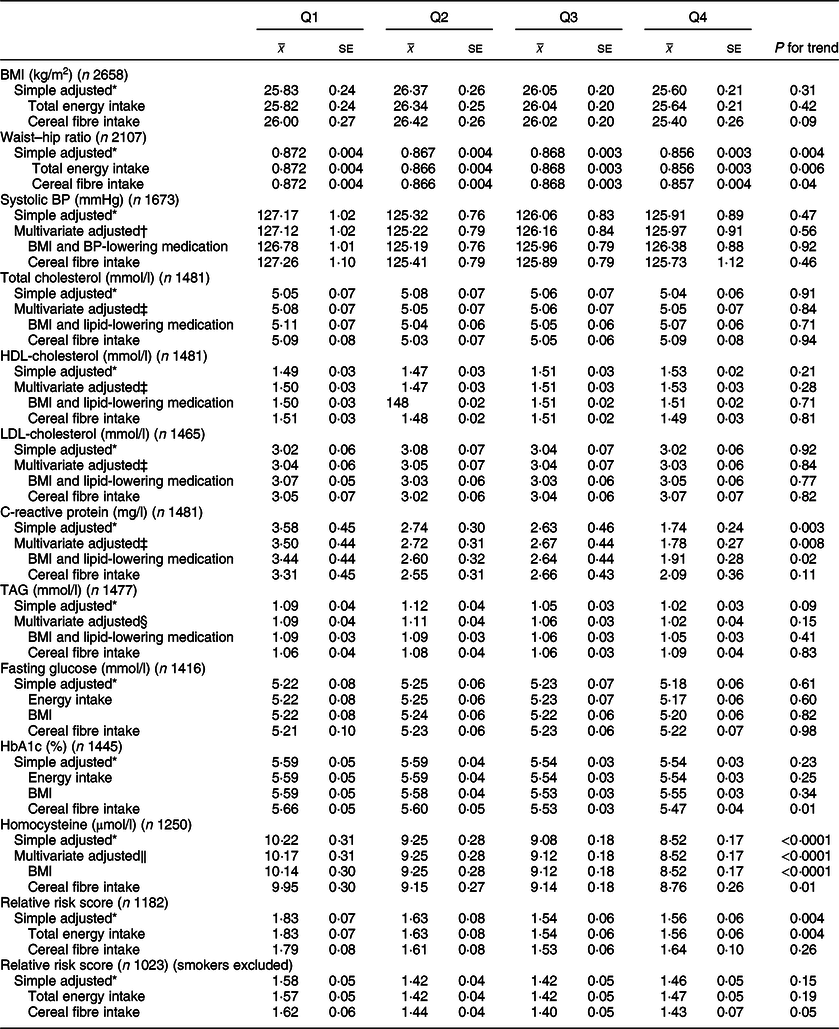
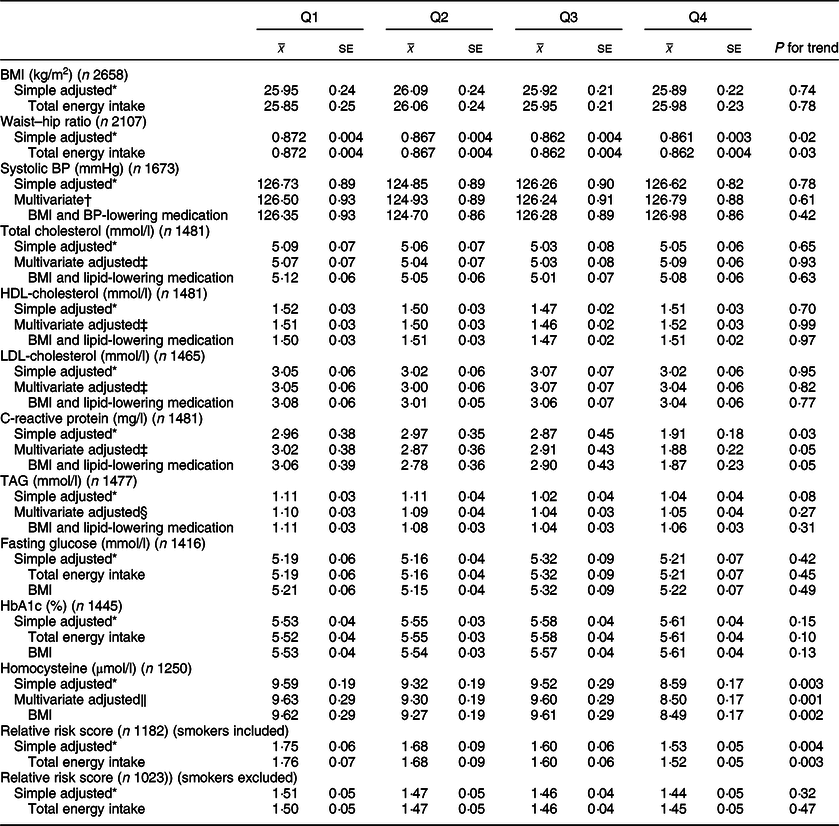
Associations between whole grain and cereal fibre intake and assessed risk factors are shown in Tables 3 and 4, respectively. Compared with participants in the lowest quartile of whole grain intake, participants in the highest quartile had lower waist–hip ratios (Q1 0·872; Q4 0·856; P = 0·006). These results remained significant after adjusting for cereal fibre (P = 0·04), as well as further adjustment for physical activity in the sensitivity analysis (P = 0·03; data not shown). Comparable results were found for cereal fibre intake (Q1 0·872; Q4 0·867; P = 0·03); however, this disappeared when examining smaller sample within the sensitivity analysis (P = 0·14).
Table 3 CVD risk factors according to quartiles of energy-adjusted whole grain intake among participants of National Diet and Nutrition Survey Rolling Programme 2008–2014
BP, blood pressure.
* Adjusted for age and sex.
† Adjusted for age, sex, total energy, ethnicity, smoking status, Na.
‡ Adjusted for age, sex, total energy, ethnicity, smoking status, alcohol, saturated fat, trans fat.
§ Adjusted for age, sex, total energy, ethnicity, smoking status, alcohol, saturated fat, trans fat, non-milk extrinsic sugar.
‖ Adjusted for age, sex, total energy, ethnicity, smoking status, alcohol.
Table 4 CVD risk factors according to quartiles of energy-adjusted cereal fibre intake among participants of National Diet and Nutrition Survey Rolling Programme 2008–2014
BP, blood pressure.
* Adjusted for age and sex.
† Adjusted for age, sex, total energy, ethnicity, smoking status, Na.
‡ Adjusted for age, sex, total energy, ethnicity, smoking status, alcohol, saturated fat, trans fat.
§ Adjusted for age, sex, total energy, ethnicity, smoking status, alcohol, saturated fat, trans fat, non-milk extrinsic sugar.
‖ Adjusted for age, sex, total energy, ethnicity, smoking status, alcohol.
Whole grain intake was inversely associated with CRP levels (Q1 3·50 mg/l; Q4 1·78 mg/l; P = 0·008), and these associations remained after adjusting for BMI and use of lipid-lowering medications (P = 0·02). Upon adjusting for cereal fibre, the association was no longer significant (P = 0·11). A borderline significant inverse association was also found for CRP and cereal fibre intake, which remained after adjusting for BMI and use of lipid-lowering medication (P = 0·05).
Both whole grain and cereal fibre intake were associated with significantly lower homocysteine levels, even after further adjusting for BMI (Q1 10·14 µmol/l, Q4 8·52 µmol/l; P < 0·0001; and Q1 9·62 µmol/l, Q4 8·49 µmol/l; P = 0·002, respectively). Whole grain intake remained significant after adjusting for cereal fibre intake (P = 0·01). Both associations remained significant within the sensitivity analysis (P = 0·03 for whole grain; P = 0·003 for cereal fibre), where there was a much smaller sample size of 990 participants.
HbA1c values were relatively consistent across quartiles of energy-adjusted whole grain intake; however, unexpectedly, after adjusting for cereal fibre intake, a small but statistically significant inverse association was seen (Q1 5·66 %, Q4 5·47 %; P = 0·01), which remained in the sensitivity analysis (P = 0·008). Interestingly, there was a slight positive but non-significant association between cereal fibre intake and HbA1c.
When smokers were included in the analysis, higher whole grain and cereal fibre intakes were both associated with significantly lower CVD risk score (Q1 1·85, Q4 1·56; P = 0·002; and Q1 1·78, Q4 1·52; P = 0·003, respectively). After adjusting for cereal fibre, whole grain association was no longer significant (P = 0·26). When smokers were excluded from the analysis, whole grain intake was associated with lower relative risk score after adjusting for cereal fibre intake with borderline significance (P = 0·05), which was attenuated slightly in the sensitivity analysis (P = 0·07).
No other risk factors assessed were significantly associated with whole grain or cereal fibre intakes (P > 0·05 for all).
Composition and quality of high whole grain/low cereal fibre and low whole grain/high cereal fibre diets
Only two participants were categorised as consuming a high whole grain/low cereal fibre diet based on being in both the highest quartile of whole grain intake (Q4) and the lowest quartile of cereal fibre intake (Q1). Both participants reported consuming brown rice (a relatively low-fibre whole grain food) daily. With the exception of brown rice, few other cereal foods were included in the 4-d food diaries of either participant.
Two main patterns of intake could be identified within the twenty-three participants who were in both the lowest quartile of whole grain intake (Q1) and the highest quartile of cereal fibre intake (Q4) (low whole grain/high cereal fibre diet). A small number of participants (n 5) reported consuming cereal foods that were not whole grain but were high in cereal fibre, such as bran products and brown breads (brown bread is not classified as a whole grain as it contains only 80 % intact grain). However, unexpectedly, the majority of participants within this group (n 18) reported diets that comprised large amounts of refined grain cereal foods. While these cereal foods were not high sources of fibre individually, these participants ate them in large enough qualities to accumulate to higher intakes, even after adjusting for total energy intake. Commonly eaten cereal foods within this group included white bread and bread alternatives, white pasta and noodles, pizza and white rice.
Discussion
Among adult participants of NDNS RP 2008–2014, some modest associations were found between diets high in whole grain and cereal fibre, and lower waist–hip ratio, CRP levels (borderline P = 0·05 for cereal fibre), homocysteine levels and CVD relative risk score. However, no associations were found for all other CVD risk factors examined, including BMI, lipid profile constituents, blood pressure and metabolic markers.
In contrast to similar cross-sectional studies from the USA(Reference Newby, Maras and Bakun13,Reference Sahyoun, Jacques and Zhang34–Reference McKeown, Yoshida and Shea36) , we did not find a significant association for BMI within this UK population; however, both whole grain and cereal fibre intakes were inversely associated with waist–hip ratio. Potentially, the waist–hip ratio is more indicative of cardiovascular risk than overall body weight, as it is a more direct measure of central adiposity. Commonly proposed mechanisms explaining the association between whole grain intake and weight management mainly refer to the fibre component and its effect on overall energy intake. Foods high in fibre, such as whole grains, tend to be of lower energy density, resulting in reduced overall energy intake(Reference Satija and Hu37). Soluble fibre, in particular, may also delay gastric emptying and macronutrient absorption by binding with water to form a viscous matrix trapping nutrients prior to digestion, postulated to increase satiety(Reference Satija and Hu37). Our findings seem to support this pathway, as both whole grain and cereal fibre intakes were strongly inversely associated with overall energy intake, and this was more pronounced for cereal fibre. However, the actual differences in mean waist–hip ratios between lowest and highest quartiles of whole grain and cereal fibre intake were minor (0·016 and 0·01, respectively), and neither are necessarily indicative of considerable risk difference, which limits the interpretation of potential differential benefits between whole grain and cereal fibre intakes.
Neither whole grain nor cereal fibre were associated with any lipid profile constituent. While one cross-sectional study also found no associations(Reference Sahyoun, Jacques and Zhang34), other similar-sized studies have found significant inverse associations for whole grain intake(Reference Newby, Maras and Bakun13,Reference McKeown, Meigs and Liu38,Reference Jensen, Koh-Banerjee and Franz39) and cereal fibre intake(Reference Newby, Maras and Bakun13). It is likely that the lipid-lowering effects of whole grains are dependent on the type of whole grains and the fibre they contain. Whole grains high in β-glucan-soluble fibre such as oats are thought to lower LDL-cholesterol through the ability of β-glucan to inhibit bile acid reabsorption, causing the body to increase uptake of circulating LDL-cholesterol to replenish hepatic cholesterol(Reference Daou and Zhang40). In a previous study of NDNS RP 2008–2011, oats accounted for only 15 % of total whole grain consumed(Reference Mann, Pearce and McKevith41). Given these proportions, any associations relating directly to oat or β-glucan intake are unlikely to be captured in the analysis of total whole grain and cereal fibre intake. In controlled intervention studies targeting oat intake only, more pronounced effects on lipid profile constituents have been shown from both oatmeal (a whole grain) and oat bran (a high cereal fibre source), with effects related specifically to the fibre content as β-glucan(Reference Maki, Beiseigel and Jonnalagadda42). Similarly, our study found no associations between whole grain and cereal fibre to systolic blood pressure, in agreement with other cross-sectional studies(Reference Newby, Maras and Bakun13,Reference Sahyoun, Jacques and Zhang34,Reference McKeown, Meigs and Liu38) . Two reviews of controlled trials found that the effects were more pronounced in hypertensive participants rather than normotensive participants(Reference Streppel, Arends and van’t Veer43,Reference Whelton, Hyre and Pedersen44) , which may explain a lack of results from population-based studies.
Whole grain and cereal fibre intake were also not associated with fasting plasma glucose levels in the current study. Again, grains higher in soluble fibre may have a differential effect to other whole grains, as an increased viscosity of intestinal contents created by soluble fibre may reduce macronutrient absorption and slow gastric emptying, in turn reducing glucose and insulin responses(Reference Jenkins, Wolever and Leeds45). Additionally, associations were often more pronounced in participants with type 2 diabetes mellitus or insulin resistance(Reference Behall, Scholfield and Hallfrisch46,Reference Harris Jackson, West and Vanden Heuvel47) . Here, an inverse association between whole grain intake and HbA1c became significant only after adjusting for cereal fibre intake. Although the association was NS, higher cereal fibre intakes also tended to be associated with higher HbA1c. While it is unlikely that this trend is genuine, other constituents of whole grains may account for the association seen only in whole grain intake. For example, Mg intake may also be of benefit to glucose metabolism, as the restoration of intracellular Mg concentrations in patients with non-insulin-dependent diabetes mellitus (NIDDM) has been shown to effectively improve insulin-mediated glucose uptake(Reference Barbagallo, Dominguez and Galioto48).
Whole grain intake was inversely associated with CRP, although the association disappeared after adjusting for cereal fibre intake. In a previous cross-sectional study of years 1–4 of NDNS RP (2008–2011), whole grain intake was not associated with CRP levels(Reference Mann, Pearce and McKevith49). Despite the study using a similar method, it is possible that the addition of years 5–6 of NDNS RP within our study accounted for the difference in findings. Within other cross-sectional studies, whole grains(Reference Jensen, Koh-Banerjee and Franz39,Reference Lutsey, Jacobs and Kori50) have been associated with lower CRP levels. Similar to the results seen here, the associations were attenuated in models adjusting for BMI. CRP is a clinical indicator of inflammation, and as obesity is characterised by low-grade systemic inflammation(Reference Calder, Ahluwalia and Brouns51), fibre may, in part, reduce CRP levels through its effect on body weight. However, BMI was not independently associated with whole grain intake within our study. Additionally, fermentation of cereal fibres within the gut, particularly arabinoxylan and β-glucan, increases the production of butyrate, an SCFA that has been shown to inhibit inflammatory response(Reference Bach Knudsen, Lærke and Hedemann52). These proposed mechanisms may explain why adjusting for cereal fibre intake caused the association for whole grain intake to disappear within our study. That is, the associations are primarily due to the fibre content of whole grain foods. However, high cereal fibre intake when analysed separately was only borderline inversely (P = 0·05) related to CRP levels. Phenolic acids, particularly ferulic acid, have been shown to also exhibit anti-inflammatory activity(Reference Călinoiu and Vodnar53), suggesting that additional bioactive compounds within whole grains may also contribute to the association found.
Both whole grain and cereal fibre intake were strongly associated with lower homocysteine levels within the current study, consistent with other cross-sectional studies in differing populations(Reference Jensen, Koh-Banerjee and Franz39,Reference Lutsey, Jacobs and Kori50) . While the association to whole grain intake was attenuated after adjusting for cereal fibre intake, it remained significant. This was not unexpected, as folate and pyridoxine (vitamin B6), both contained within whole grain foods, are key cofactors in the metabolism of homocysteine, and supplements with both (as well as vitamin B12) has been found to restore elevated homocysteine levels(Reference den Heijer, Brouwer Ingeborg and Bos Gerard54). Therefore, it is probable that these components of high whole grain intake are contributing to the inverse association seen here. While high homocysteine levels have been proven to be an independent risk factor for CVD(55), it is not yet known whether a causative relationship exists or whether it is a marker of risk, as there is limited evidence showing lowered CVD risk with the administration of homocysteine-lowering vitamins(Reference Ueland and Clarke56). With consideration of this, findings here should be interpreted cautiously, and larger studies are needed to further clarify the relationship between homocysteine and CVD.
As consumers of higher whole grain and cereal fibre were significantly less likely to smoke in our study, and smoking status is one of the three risk factors included in the calculation of relative risk score, the inverse associations found between whole grain and cereal fibre intakes and relative risk score may be highly influenced by this confounding relationship. Therefore, analysing risk scores with current smokers excluded is potentially more accurate for considering dietary-related associations. Interestingly, when associations between whole grain intake and total cholesterol and systolic blood pressure were performed separately, no results were found, but when combined into a risk score, a borderline inverse association was found (P = 0·05) after adjusting for cereal fibre intake, despite the much smaller sample size. This finding suggests the value in further research assessing CVD risk with a combination of risk factors such as through risk scores.
An issue with attempting to examine the extent to which the benefits associated with whole grain intake may be explained by their high cereal fibre content is separating the whole grain and cereal fibre intake. Unsurprisingly, the highest consumers of whole grain also make up the vast majority of those consuming the highest amount of cereal fibre. We attempted to descriptively explore the diet composition of participants who did not fit into this pattern, as there were not enough eligible participants to perform statistical analyses. The findings were unexpected, particularly the diets of those consuming high cereal fibre, low whole grain, which contained high amounts of poorer-quality refined grain foods (e.g., pizza, white rice, fried breads), rather than being rich in bran-based foods, which were the highest sources of cereal fibre recorded within the survey. This finding highlights the difficulty in determining the individual health benefits of non-whole grain cereal fibre outside of a controlled setting, as comparative diets may be starkly different in overall quality. Differences in associations seen here between whole grains and cereal fibre intakes, such as the slight positive association between cereal fibre intake and HbA1c, may be partly a result of this, despite attempts to adjust for other dietary confounders. However, it is difficult to speculate based on these results only, given the very small number of participants within these separated groups. It would be valuable to compare CVD associations between high whole grain consumers and the two different high cereal fibre–low whole grain patterns (namely high bran consumers and high refined grain consumers), if sufficient sample sizes were available.
The strengths of the current study include the large sample size, the use of a 4-d food diary to record intakes and MSM adjustment to estimate usual intakes, and the systematic process used to estimate whole grain and cereal fibre contents within all foods consumed by the participants. Although attempts were made to adjust for relevant confounding dietary and lifestyle factors for associations, there was a possibility of residual confounding, as higher whole grain and cereal fibre intake may be associated with a healthier lifestyle and better diet quality. As there are multiple risk factors that may be relevant in the association between whole grain and cereal fibre intake and CVD risk, many tests were performed within the current study, increasing the potential for type 1 error. However, significant associations found within our paper tended to be consistent with findings in previous, similar cross-sectional studies, while inconsistency tended to occur when we did not find an association. Regardless, caution needs to be taken with the interpretation of findings, particularly those of borderline significance. While many risk factors were assessed within the current study, data were restricted to that which was measured within NDNS RP, limiting the exploration of additional potentially relevant CVD risk factors. Finally, as this is a cross-sectional study, it lacks temporality, and it is impossible to determine any causation between intakes and risk factors assessed.
In consideration of all the findings, cereal fibre intake often attenuated inverse associations to CVD risk factors found when examining whole grain intakes, although the associations were stronger in whole grain analyses (prior to cereal fibre adjustment) than when cereal fibre intake was independently examined. This suggests that while cereal fibre is likely a major component contributing to most whole grain inverse associations, additional components present with high whole grain intake, which may not be present with high cereal fibre intake, are also of value. Alternatively, as we found that diets high in cereal fibre from non-whole grain sources tended to feature high amounts of poorer-quality grain foods, it may be that additional components of these diets that were not accounted for in multivariate analyses are weakening any benefits of the high cereal fibre consumed. Longer-term intervention studies are needed to explore this notion further, whereby participants can be fed whole grain and non-whole grain diets that are matched for cereal fibre intake and overall diet quality.
Importantly, all associations found here were modest, and there were many risk factors assessed that were not associated with either whole grain or cereal fibre intakes. In these cases, other dietary factors may be more relevant, highlighting that, while it is valuable to explore the potential independent associations of singular foods or nutrients within the research setting, the translation of findings into efforts to prevent chronic disease should always be placed in the context of total diet quality and composition.
Acknowledgements
Acknowledgements: The authors would like to thank Professor Chris Seal and Dr Kay Mann for their expertise and assistance regarding whole grain food composition database development; Darren Cole for his help in creating the cereal fibre and whole grain databases; and Dave Collins for statistical support specific to the NDNS data. The authors also thank the UK Data Service for supplying NDNS RP data, and all participants of NDNS RP. Financial support: This research was conducted with the support of the Australian Government Research Training Program Scholarship. This research received no specific grant from any funding agency in the public, commercial or not-for-profit sectors. Conflict of interest: None. Authorship: E.M.B. and E.J.B. designed the research; E.M.B. and B.A. developed food composition databases; E.M.B. analysed data; M.J.B. provided statistical analysis support; S.R. provided C.V.D. expertise and interpretation of results; E.M.B. wrote the paper; all authors reviewed the manuscript; E.M.B. had primary responsibility for the final content. Ethics of human subject participation: None.


