


Project TALENT is a US national longitudinal study of about 377,000 individuals who were first assessed in 1960 while in secondary school (grades 9–12). Created by John Flanagan at American Institutes for Research (AIR) and with funding from the United States Office of Education (USOE, now the US Department of Education), the study included students in about 1,200 schools who participated in a 2-day battery of tests and questionnaires covering aptitudes, abilities, interests, and individual and family characteristics (Flanagan, Reference Flanagan1962; Flanagan et al., Reference Flanagan, Dailey, Shaycoft, Gorham, Orr and Goldberg1960). Principals completed a school characteristics survey and guidance counselors completed a survey on the school's guidance program. Follow-up surveys were collected 1, 5, and 11 years after the students’ expected graduation from high school. The purpose behind this massive data collection was threefold: (1) to use the resulting databank as a national inventory of human resources; (2) to better understand the processes by which young people choose and advance their careers; and (3) to discern which experiences and influences are most important in preparing students for their future. The dataset's sizeable and diverse population has been used as a nationally representative sample to address many questions about measurement of cognitive abilities and achievements (Cooley & Lohnes, 1970; Humphreys et al., Reference Humphreys, Parsons and Park1979), educational and occupational attainment (Abeles et al., Reference Abeles, Steel, Wise, Baltes and Brim1980; Arneson et al., Reference Arneson, Sackett and Beatty2011; Kuhn & Weinberger, Reference Kuhn and Weinberger2005; Schoenfeldt, Reference Schoenfeldt1968a; Wise et al., Reference Wise, McLaughlin and Steel1979), and to study special populations, including racial/ethnic groups, and veterans (Burket & Flanagan, Reference Burket and Flanagan1963; Card, Reference Card1983; Kapel, Reference Kapel1968; Neyman & Dailey, Reference Neyman and Dailey1963).
Today, Project TALENT is being developed as a resource on aging and the life course. The existing data are being used to address questions about early life predictors of mortality (Stone et al., Reference Stone, Eyster, Lapham and Plotts2011), and sources of variation in intellectual abilities and achievements associated with schools (McArdle, Reference McArdle2010, Reference McArdle2011), families (Prescott et al., Reference Prescott, McArdle, Lapham and Plotts2011), and biological mechanisms (Prescott et al., Reference Prescott, McArdle, Berenbaum and Lapham2012). The original participants are now between 66 and 70 years of age and plans are underway for a new collection of data.
In this paper, we summarize the design and measures collected in the entire Project TALENT study and then focus on the Twin and Sibling sample.
Project TALENT Study Design
A stratified random sample was selected to be nationally representative of US students enrolled in grades 9–12 in 1960 and to be large enough to provide sufficient data to analyze a variety of occupational groups and life courses (Flanagan, Reference Flanagan1972; Flanagan et al., Reference Flanagan, Dailey, Shaycoft, Gorham, Orr and Goldberg1960, Reference Flanagan, Colley and Holdeman1965; Wise et al., Reference Wise, McLaughlin and Steel1979). Secondary schools were the primary sampling unit. The sampling frame was created from multiple sources, including a data file of public senior high schools and a supplemental list of private and parochial high schools provided by the USOE, as well as a list of schools obtained from the Internal Revenue Service. The sample was stratified by school type (public, parochial, and private-non-parochial) and nine geographic regions. The five cities that had a population greater than 1.5 million at the time (New York, Los Angeles, Chicago, Philadelphia, and Detroit) were designated as separate strata. For public schools, two additional stratifying variables were used: student retention ratio (the number of graduates in 1958 divided by the number of 10th graders in 1959) and size of the senior class. A general sampling ratio of 1 in 20 was then used within each stratum. Exceptions included sampling 1 in 13 schools with 400 seniors or more, and 1 in 50 schools with 25 or fewer seniors. All students in grades 9–12 were tested in sampled schools, with the exception of New York City and Chicago schools, which sampled 1 in 10 and 1 in 12, respectively. At their own request, approximately 128 other schools volunteered to participate in Project TALENT, including all public, private, and parochial schools in Knox County, Tennessee. Because these schools were not in the original sampling frame, they have not been included in the probability sample and are not included in the archived versions of the data.
One challenge with the sampling was the inclusion of 9th graders who frequently were attending a junior high school. If a junior high school was clearly and exclusively associated with a sampled high school, then all 9th graders in that school were sampled for testing. However, the relationships between junior and senior high schools were not always clear. If junior high schools were associated with more than one high school or multiple junior high schools fed into the selected high school, all students in the junior high school(s) were selected for testing and the student and school weights were adjusted accordingly (Wise et al., Reference Wise, Steel and MacDonald1979).
As shown in Table 1, each grade cohort from the base year sample was followed up with mailed surveys at 1, 5, and 11 years after the anticipated date of their graduation. These collection points were chosen to capture personal and career development as participants completed postsecondary education or training and later after they had entered the workforce.
TABLE 1 Modal age of Project TALENT Respondents by Survey Component

Source: The Project Talent Data Bank Handbook, Table 1.1 (Wise et al., Reference Wise, Steel and MacDonald1979).
Response Rates
Response rates for schools and students in the base year were remarkably high. Of the 1,312 selected schools, 1,225 participated, including 987 (93% of those selected) high schools, and 238 (96%) associated junior high schools. The base-year testing occurred within school classrooms across four half-days or two full days during the spring of 1960. Given the less stringent human subjects regulations at the time, students were not individually consented and participation at the school level was virtually complete.
As would be expected, response rates for the follow-up data collections were not nearly as high and decreased over time (see Table 2). To counter bias introduced by non-response and unsuccessful tracking efforts, in each wave special samples were drawn from the pool of non-respondents and received extensive locating and follow-up measures through a telephone interview or an in-person interview. The high response rates for these special samples are indicated in Table 2. Non-respondents were selected systematically by region, state, city, and school and, in most cases, by classroom to reduce the sampling error for related variables. In addition, the special sample for the 11-year follow-up of the 1960 9th graders included an additional sample of racial/ethnic minorities and was stratified by general academic aptitude because higher aptitude was found to be correlated with response propensity (Rossi et al., Reference Rossi, Wise, Williams and Carrel1976). The weights were designed to adjust for non-response within several key stratification variables (for more information see McLaughlin et al., Reference McLaughlin, Fulscher and Yen1974).
TABLE 2 Number and Percentage of Project TALENT Respondents, by Grade and Data Collection

— Not available.
Source: The Project Talent Data Bank Handbook, Table 1.1 (Wise et al., Reference Wise, McLaughlin and Steel1979).
Sample Characteristics
Schools that participated in Project TALENT were located in 49 states (see Figure 1). When the sampling frame was being designed (in the late 1950s), Alaska had yet to join the United States, and Alaskan schools were not included in the sample. While Hawaii had also not achieved statehood, several Hawaiian schools were included in the sample.

FIGURE 1 Location of schools selected to participate in Project TALENT in 1960.
Source: Figure 3 (Flanagan et al., Reference Flanagan, Dailey, Shaycoft, Gorham, Orr and Goldberg1962).
Almost all participants were born between late 1941 and mid-1945 (i.e., were eligible to enter 1st grade in 1948–1951). A small proportion (1.6%) was outside this range due to repeating or skipping grades. Overall, 50.1% were female.
Race and ethnicity was not asked of individual participants in 1960, but was asked in follow-up surveys. Individual-level race and ethnicity information is thus missing for about half of the participants. However, principals reported racial and ethnic composition at the school level, which can be used to assign race and ethnicity with high probability for many students. The participants of Project TALENT were the last cohorts of high school students in the United States to progress through the secondary school system before implementation of the landmark Civil Rights Act of 1964 (9th grade participants are expected to have entered 12th grade in 1964). In 1960, many schools in the southern United States were segregated and de jure segregation existed across much of the country. Indeed, 6% of Project TALENT schools were predominantly Black, and 93% of the schools were predominantly non-Hispanic White (defined as 90% or more of the student body).
Measures
We briefly summarize the available data collected in Project TALENT (for more information see Daily & Shaycoft, Reference Daily and Shaycoft1961). Student-level data files and additional documentation are available through the Inter-University Consortium for Political and Social Research (ICPSR), and the school-level data file can be obtained by contacting American Institutes for Research.
The information collected in 1960 is summarized in Table 3. Student data includes measures of the students’ knowledge, cognitive abilities, decision-making style, personality, vocational interests, and information on the students’ personal experiences and family background. These measures were all developed for use in Project TALENT by a prominent group of psychometricians and educational researchers. Each section was timed and administered under standard conditions within school classrooms.
TABLE 3 Measures Included in 1960 Base Year Assessment in Project TALENT
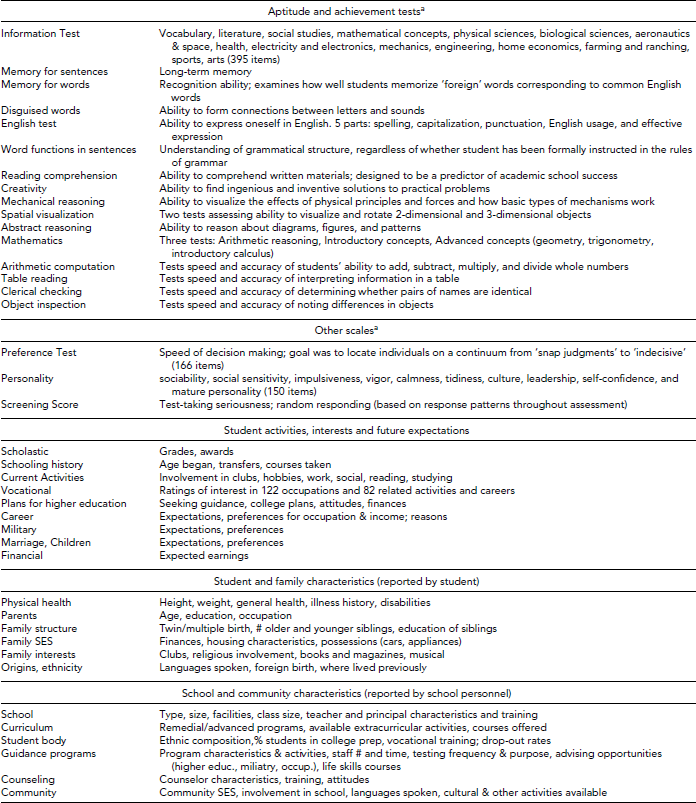
a Scores available at scale level for entire sample; at item level for 4% of sample.
Source: Flanagan et al., Reference Flanagan, Dailey, Shaycoft, Gorham, Orr and Goldberg1962.
The item-level data were retained for measures of vocational interests and personal characteristics. For cognitive and personality measures, scale scores were retained for all members of the sample, but item-level data were kept for only a random sample of 4% of participants.
Abilities and achievements — 1960
The cognition sections of the 1960 Project TALENT assessment were conceptualized as measures of basic cognitive ability and measures of achievement (knowledge). These were assessed using multiple scales organized into tests of ‘Information’ and measures of specific abilities. The Information test included 395 items that measure general knowledge and knowledge and information about specific areas. The intent was to measure acquisition of knowledge about scholastic topics and also to identify students who would be interested in a particular field and have an aptitude for it. Other ability and achievement measures were assessed by a total of 775 items grouped into 16 tests (see Table 3). Contemporary analyses of these measures (e.g., McArdle Reference McArdle2010, Reference McArdle2011) indicate they correspond to at least nine key cognitive factors, including what have become more well known as crystallized (Gc) and fluid (Gf) intelligence (see Horn & Cattell, Reference Horn and Cattell1982).
Student characteristics, activities and interests — 1960
Student Information Blank. This section included 394 items that collected information on personal experiences, home life and family, and hopes and aspirations for the future. The personal experiences items include club memberships and offices held, hobbies and recreational activities, work experiences, sources of personal income, dating and social activities, reading interests, study habits, grades and schooling matters, guidance and counseling experiences, awards, driving, and health. Topics included in the family and home subject area include family composition, including twin status and number of siblings, parents’ occupation, education of family members, description of home, family mobility, foreign languages spoken by parents, and indices of family economic status and academic orientation, such as books and magazines in the home, and number of automobiles owned. The final subject area — students’ plans and aspirations — included: educational plans, specific college plans (asked of 11th and 12th grade students), plans for marriage and children, economic aspirations, plans for fulfilling military service requirements, and occupational choices, decisions, and values.
Personality. This questionnaire included 150 statements covering 10 personality traits including: sociability, social sensitivity, impulsiveness, vigor, calmness, tidiness, culture, leadership, self-confidence, and mature personality. These items were developed specifically for Project TALENT and do not directly correspond to other personality scales, although preliminary work indicates their factor structure can be mapped to other structures, such as the Big Five.
Vocational Interest Inventory. This section was designed to identify the degree of interest a student had in 122 occupations (e.g., electrician, typist, judge) and 82 related activities (e.g., owning a business, solving puzzles).
School-level data — 1960
The general school questionnaire completed by principals contained six sections, covering: (1) policies, practices, and physical condition of the school; (2) number of teachers and their training and characteristics; (3) characteristics of the student body (e.g., enrollment, dropouts, percentage of graduates going to college); (4) characteristics of the community (e.g., PTA activity, per-pupil expenditures); (5) characteristics of the principal (e.g., age, experience, and training); and (6) courses offered in grades 9–12.
The school guidance program questionnaire covered: (1) scope of the guidance program (e.g., presence of guidance program in the school, number of guidance counseling staff, adequacy of referral facilities in community); (2) what kind of guidance was provided to students and parents and how; (3) to what extent program had expanded in recent years; and (4) use of nationally standardized tests in the school and how the results were used or shared.
The 1-year, 5-year, and 11-year follow-up surveys
All three follow-up surveys collected data on education, occupational experiences, and marriage and family. The assessment of educational experiences included graduation from high school or drop-out, attendance at a post-secondary institution, degrees obtained, sources of income support, programs or majors, post-secondary grades, years attended, reasons for dropping out if appropriate, and opinions on the usefulness of a degree in preparing for work. Data collected on occupations included the participant's job title at the time of the follow-up, future occupational plans, pay, hours worked, instances of and reasons for unemployment, number of jobs held, and (in the 11-year follow-up only) job satisfaction. The marriage and family data included items on current marital status, number of marriages, age at marriage, and information on the spouse (e.g., age, level of education, occupation). The 11-year follow-up expanded this section to include information on children and plans for future children. Other topics included in one or more of the follow-ups were race/ethnicity, religion, health, smoking, parental mortality, driving, military experience, Peace Corps, volunteer work, typical time allocation to activities, voting, and attributes of the participant's community of residence.
New Data Collections With Project TALENT Participants
Several recent efforts have been conducted to locate Project TALENT participants and to assess the feasibility of conducting new data collections. Funded in part by an award from the National Institute on Aging (NIA) of the U.S. National Institutes of Health (3P01 AG021079-07S1), AIR staff targeted the 50th high school reunions of the classes of 1960 and 1961 as a means of locating and re-engaging Project TALENT participants. In 2011, AIR staff attended or sent personalized information packets to 431 reunions in all 49 states. Other outreach methods include a yearly newsletter sharing information about the project's history and current activities, as well as notices on the project's website and newsletter welcoming participants to request their original score reports.
In 2011, AIR partnered with University of Michigan's Center for the Demography of Aging (funded by NIA grants P30 AG012846-17S1, and U01 AG009740-21S2) to conduct a pilot study. The pilot study was designed to examine how best to locate and attain responses from Project TALENT participants whose last point of contact may have been more than 50 years ago. The pilot study sample included 1% of the original Project TALENT participants, selected by randomly sampling 10% of the 1960 schools and then randomly selecting 10% of the students from those schools. Several experiments were embedded in the mailed survey data collection to examine the impact of various incentive amounts, use of phone follow-up, and impact of requesting permission to link Project TALENT data to the Social Security Administration's (SSA) records. The pilot study questionnaire collected demographic information, a selection of items from the Health and Retirement Study (such as life satisfaction, family and social engagement, life events, activities and opinions, military service, recent work history, and health and well-being), as well as some of the original Project TALENT personality measures.
Data were collected from November 2011 through June 2012. About 93% of males and 78% of females were located, including 20% of men and 11% of the women identified as deceased. Locating women is more difficult due to name changes after marriage. The preliminary return rate, that is, the number of completed questionnaires as a percentage of all questionnaires mailed, ranged from 48% to 75% depending on incentive level and intensity of follow-up efforts. (See Stone & Bandyk, Reference Stone and Bandyk2012 for more details on tracking participants.)
Twins and Siblings in Project TALENT
The birth rate of twins and other multiples in the United States during the 1940s was approximately 1% of births, meaning about 2% of all Project TALENT participants are expected to be part of twin or multiple sets. This corresponds to approximately 7,540 individuals of the 377,000 individuals in the probability sample. The school-based design of Project TALENT means that there are also many thousands of non-twin siblings who attended the same high school when the 1960 assessment was conducted. As described subsequently, AIR is developing matching algorithms and reviewing procedures to identify twins and siblings and link them to each other.
Complete ascertainment of twin and sibling pairs is unrealistic as this would require both individuals to survive to at least age 15, not have dropped out of school, and be attending the same school (or another school within the Project TALENT sample). Students residing in institutions or being schooled at home were not included in the study. In addition, students in New York City and Chicago were sampled from schools (rather than using the complete census), meaning that both twins or siblings may not have been selected for inclusion in Project TALENT.
We plan to use information from twinning rates and life tables for these birth cohorts combined with the school- and region-specific dropout rates to estimate sources of under-ascertainment of twin pairs and sets of siblings. As shown in Table 2, the base-year sample sizes in Project TALENT are smaller for each successive grade. This mostly reflects increasing school dropout rates in later years of high school rather than changes in the birth rate during this period. According to the 1960 US Census, school enrollment rates for students ages 15 to 18 ranged from 92.8% for 15-year-olds to 75.5% for 17-year-olds and 50.8% for 18-year-olds. The lower enrollment rate for those aged 18 also reflects that some had already graduated from high school and did not enroll in college. Differences in birth rates are less likely to be a factor given that the sample was born prior to the large rise in birth rates during the baby boom period, which began in 1946. During 1942–1945, when the large majority of Project TALENT participants were born, birth rates in the United States ranged from 20.3 to 22.4 live births per 1,000-population (CDC, 2003).
Identifying Twins and Siblings
One item on the Project TALENT base year questionnaire (BY_SIB200) was intended to identify twins, but there were no items that linked siblings or twins to each other, and no questions were asked in the original assessments about twin pair zygosity. About 5% of the sample gave a response to item BY_SIB200 indicating they were a twin or multiple. Our interpretation of this higher-than-expected rate of endorsement is that it reflects some sloppiness of responding and also a misunderstanding of the item content. The item was placed within a series of items about family size and number of siblings, and it seems likely that it was endorsed by some individuals who were not themselves twins but had twins as siblings. Because of the discrepancy between responses to this question and the expected number of twin pairs based on vital statistics, our procedure for identifying twin pairs does not rely heavily on this item.
Identifying siblings and twins is done sequentially. Sets of siblings are first identified and then twins and other multiples are identified from among sets of siblings. As shown in Table 4, the algorithm employs nine variables from the Student Information Blank, as well as students’ names, parents’ names, birth date, address, and school information obtained from the tracking and mailing data file maintained by AIR. The algorithm includes several matching variables that have been given numeric weights or match scores. In addition to exact matching on last name, we are using phonetic name coding (using NYSIIS and SoundEx) and the probabilities of name frequencies to identify potential matches. The likelihood of any two students being a twin pair is assessed using the score assigned by the algorithm. Groups of potential twins and their scores are then output and assigned into one of three categories: good matches (those who are definitely twins), bad matches (those who are definitely not twins), and manual review matches (those with scores not high or low enough to be considered good or bad matches). Manual review matches are then reviewed by hand to determine if the paired students are twins. Because many variables used to identify twins have missing values, some are only included for manual review and not necessarily included in the scoring system for the computer-matching algorithm.
TABLE 4 Variables From 1960 Project TALENT Assessment Used to Link Siblings and Identify Twins
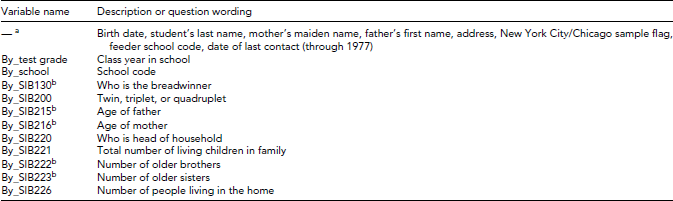
a These variables are not available in the archived dataset.
b Variable was only used when manually verifying twins.
Using this method, more than 90,000 sibling sets from about 40,000 families have been identified, including 4,647 individual twins (in 2,313 complete pairs), six sets of triplets, and about 1,200 non-twin siblings of twins. We expect these numbers to change with further refinements to the algorithms and the collection of additional information through participant contact and follow-ups. Table 5 provides approximate sample sizes by pair type for twins, siblings of twins, and other sibling pairs identified as of August 2012.
TABLE 5 Approximate Sample Sizes of Twins, Siblings of Twins and Non-Twin Siblings in Project TALENT

Values reflect twin pairs and sibling sets identified as of August 2012.
Comparison of Twins and Non-Twins in Project TALENT
Although the twin sample in Project TALENT does not have the near-complete ascertainment available in some national population registers, we are able to evaluate representativeness by comparing twins’ scores on a wide range of measures to those of non-twin participants. Table 6 shows the unweighted student and school distributions, of a few measures for the twins and non-twins within Project TALENT.
TABLE 6 Unweighted Percentage Distribution of Twin and Non-Twin Project TALENT Participants, by Selected Student and School Characteristics
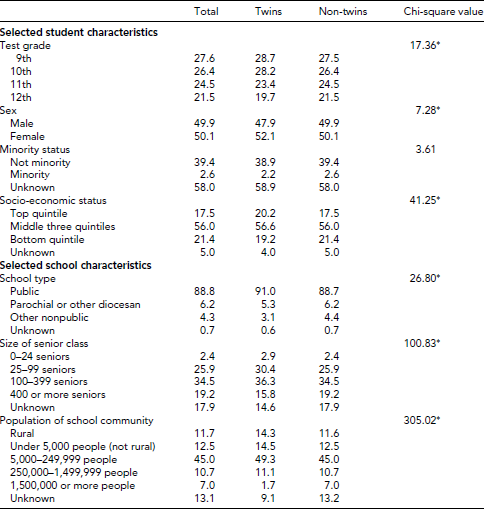
*p < .05.
Twins account for a smaller proportion of the total in 12th grade than in other grades. This may be due, in part, to the algorithm requiring a record for both twins to detect a twin pair. Consequently, if one twin had dropped out of school, the co-twin would be counted as a non-twin, or singleton. There are no significant differences between the two groups in their composition by minority status. Based on responses to multiple items, relatively more twins than non-twins fell into the highest socio-economic status quintile in 1960, which may reflect the tendency of DZ twins to be born to older parents.
Among the selected school-level variables, there is a slight tendency for twins to be in public school and in small schools (25–99 seniors). Examining the size of the school's surrounding community reveals that twins are less likely to be enrolled in schools located in cities with a population of at least 1.5 million. This may reflect the selected 10% sampling of students (and thus underascertainment of twins) from schools in New York City and Chicago.
Prior Research With Project TALENT Twin and Sibling Information
The Project TALENT data generated more than 200 publications and reports during the 1960s to 1980s, mostly concerning educational trajectories and occupational outcomes, but also focusing on the impact of life experiences on subsequent adjustment (e.g., Card, Reference Card1983). Relative to its great potential, very little has appeared in the literature based on the twin and sibling data.
Two reports have been published using unique analyses of data from about 500 pairs of twins participating in Project TALENT. As reported by Schoenfeldt (Reference Schoenfeldt1968b), approximately 1,900 potential twin pairs were identified by matching last names and birthdates of individuals who indicated they were part of a twin or other set of multiples (based on responses to item BY_SIB200 described previously). Pairs that were of the same sex (i.e., both male or both female, N = 1,511) were mailed questionnaires assessing their physical similarity to each other. These were returned by 550 pairs. Schoenfeldt (Reference Schoenfeldt1968b) reported analyses of cognition data based on 150 identical (monozygotic or MZ) male, 187 MZ female, 53 fraternal (dizygotic or DZ) male, and 103 DZ female pairs. As was typical of studies in that era, dizygotic opposite-sex pairs were not considered to be of interest and their data were not included in the analyses. Clearly there was substantial under-ascertainment of the twins in Project TALENT and the potential for selection bias in the analyzed sample. The 1,511 identified pairs represent about 55%, and the analyzed 550 pairs about 20%, of the expected number of same-sex pairs in the sample. There was also the usual response bias favoring MZ and female pairs.
The same cognitive data were later analyzed by Humphreys (1971, as reported in Reference Humphreys, Cicchetti and Grove1991). The sample sizes in this report are 15–20% larger than in the Schoenfeldt Reference Schoenfeldt1968 article and seem to reflect the individual (rather than pairwise) sample sizes. In both studies, resemblance among MZ pairs was greater than those among DZ pairs for all measures considered, consistent with other studies of broadly measured cognitive abilities (Bouchard & McGue, Reference Bouchard and McGue2003).
To our knowledge, the sibling structure in Project TALENT has not been used in any prior publications. Several researchers used information about family size or birth order in analyses of school achievement and aspirations (Bayer, Reference Bayer1966; Burton, Reference Burton1968; Claudy et al., Reference Claudy, Gross and Strause1972), but these analyses were conducted at the individual level and did not use within-family comparisons of siblings in the same family. Accurate matching of potential siblings in such a large sample based on multiple items was a huge task that exceeded the computing resources then available.
Our ongoing efforts to identify and classify twins and siblings will be much more comprehensive and accurate than prior attempts. Current computer capability allows much more sophisticated matching of twins and siblings using original questionnaire responses and demographic information.
The Project TALENT Twin, Sibling and Classmate Study
The structure of the Project TALENT data provides a unique design that includes twins, siblings of twins, and siblings in other families all nested within schools. Comparing twins and non-twins attending the same schools allows estimation of extra-familial environmental effects that contribute to similarity of the twins. This is an important issue, as what is often referred to as ‘family environment’ in a standard twin design actually reflects all environmental sources of resemblance between siblings, including schools, neighborhoods, shared peers, and between-family effects associated with social class, religion, ethnicity, and other macro-level influences.
The school-level data are also useful for evaluating the representativeness of the twins and twin families. Comparisons with classmates can include the sibling sets and individuals without any siblings in Project TALENT, including those whose siblings were not in high school (or not in a sampled school) in 1960 as well as only children.
Figure 2 illustrates our design, showing two possible configurations of families whose offspring attend the same school. Family ‘W’ includes a twin pair and another sibling, whereas Family ‘X’ includes a pair of (non-twin) siblings. Using this design, variation in a measured trait can be partitioned into five components: additive genetic (A), individual-specific environment and error (E), environmental effects specific to twin pairs (T), environments shared by siblings within a family (F), and environmental effects due to sharing the same school (or other neighborhood/community factors, S). In a traditional design of MZ and DZ twins, the common environmental component, C, would include the T, F, and S components.

FIGURE 2 The Twin-Sibling-Classmate model.
Note: Shown are two examples of family structures in Project TALENT: Family W with a set of twins and one other sibling; and Family X, with a sibling pair unrelated to W but attending the same school. The design of twins nested within sibling sets nested within schools allows sources of environmental resemblance on measure Y among siblings to be partitioned into three components (shown in gray ovals): family effects (with loading f), twin-specific effects (t), and school effects (s). Other variation is attributable to additive genetic effects (A, with loading a) and individual-specific environments and measurement unreliability (E, e). The expected correlations among A components are 1.0 for MZ twins and 0.5 for DZ twins and full siblings. The design can be extended to include half- and step-siblings and to estimate the genetic correlation across sexes. To the extent t > 0, the f parameter is reduced for twins (indicated by f*).
As depicted in Figure 2, students in different schools are assumed to be uncorrelated with each other. However, the 1960 Project TALENT data included many school-level measured variables that could be analyzed, such as curriculum features, community economic indicators, rural/urban location, and minority composition. Other standard twin model assumptions include: additivity and independence of the different sources of variance, negligible assortative mating, and equal environments of MZ and DZ twin pairs. We can test the validity of these assumptions by using measured indices of parental characteristics, participants’ reports of their neighborhoods and household characteristics and school-level variables.
A multivariate version of the model (or a version incorporating measure reliability) would permit separation of measurement unreliability from individual specific environmental factors (E). Additionally, having multiple siblings within each family permits estimation of age variation in a phenotype that is not confounded with between-family differences.
To our knowledge, this design is unique among existing twin studies. Many twin registers have data from siblings of twins, providing greater statistical power than twins alone (e.g., Posthuma & Boomsma, Reference Posthuma and Boomsma2000). In their longitudinal study of Finnish adolescent twins, Lea Pulkkinen, Richard Rose and colleagues included a ‘classmate control’ for each twin, which enabled separation of school and common environmental effects (Rose et al., Reference Rose, Viken, Dick, Bates, Pulkkinen and Kaprio2003). However, the design did not also include siblings of twins to identify any age cohort or twin-specific factors.
Twin Pair Zygosity
The only variables obtained in the 1960 Project TALENT assessment that assess physical resemblance and could be used for assessing twin pair zygosity are height and weight. We explored using this information, but found the categories of height and weight that were collected were generally too broad to permit confident classification (Prescott et al., Reference Prescott, McArdle, Lapham and Plotts2011).
We are, therefore, obtaining photographs of the twins as adolescents from their high school yearbooks. Yearbooks are being obtained through Amazon.com, libraries, schools, eBay, historical societies, and Project TALENT participants. In addition, photos from yearbooks have also been collected on Classmates.com. This databank is continuing to expand; as of July 2012 we had yearbook photos for 402 same-sex twin pairs from 147 different schools, representing about 20% of the 721 schools that identified twins attended. Our plan is to continue obtaining yearbooks and then to conduct ratings of the faces for physical similarity. These ratings will then be validated against self-reported zygosity items (for twin pairs that have both types of information) collected at a future date.
We are also investigating using facial recognition software for distinguishing zygosity using photographs of adolescent twin pairs whose zygosity has already been determined. This includes one set of contemporary twins whose photos are being taken under highly controlled conditions and whose zygosity has been validated by genotyping (courtesy of L. Baker), and a second set of twins from the same birth cohort as Project TALENT participants whose photos were taken in 1959 and were typed by blood groupings (courtesy of I. Gottesman). The results of this work will inform our future plans with regard to assigning or estimating zygosity of the Project TALENT twins.
Future Directions
Clearly, obtaining validated zygosity classifications will be important for conducting standard analyses of these twin data. However, even without this information a variety of valuable analyses are possible. It is possible to conduct heritability studies using approximate indicators or latent measures of zygosity (see Benyamin et al., Reference Benyamin, Deary and Visscher2006; Neale, Reference Neale2003; Webbink et al., Reference Webbink, Roeleveld and Visscher2006).
Additionally, data from twins and non-twin siblings can be compared to evaluate the impact of prenatal effects or other factors associated with twinning. Degree of resemblance among twin pairs, siblings of twins and classmates from non-twin families can be compared to separate the impact of age, families, and school/community effects. Comparing brothers and sisters from within the same families is a powerful test of gender effects, and girls from opposite sex pairs can be compared to those from same-sex pairs to address hypotheses about prenatal androgenization of behavior.
The large sibling sample in Project TALENT is useful for evaluating many hypotheses concerning the impact of family factors, gender, and birth order on a wide range of variables, including cognition, personality, and interests. For example, we recently used Project TALENT twins and sibling data to test the maternal immunity hypothesis as applied to cognition (Prescott, et al., Reference Prescott, McArdle, Berenbaum and Lapham2012). This hypothesis proposes that boys with older brothers have reduced prenatal brain androgenization due to decreased in utero androgen sensitivity from maternal Y-specific antibodies that develop and accumulate across successive pregnancies with male (but not female) fetuses (Blanchard, Reference Blanchard2001). We found a small but consistent birth order effect for younger siblings to have lower cognitive scores, and this increased with the more elder brothers they had. But inconsistent with predictions from the maternal immunity hypothesis, the younger sibling disadvantage was observed across a wide range of cognitive measures (not just those previously associated with androgenization in females), and the effect size was of similar magnitude in males and females.
Plans are being developed for following up Project TALENT twins and siblings as part of a larger study of Project TALENT participants related to health and cognition. This will also include collecting zygosity information from living twins and their siblings and family photos for those not living or not available for study.
Acknowledgments
Archiving of Project TALENT data is supported in part by NIH grant R01-AG038587 (PI: Susan Lapham). Reunion activities were funded by 3P01AG021079-07S1, The Wisconsin Longitudinal Study: Tracking the Lifecourse (PI: R. Hauser). Pilot study data collection funded by P30 AG012846-17S1 and U01 AG009740-21S2, Health and Retirement Study (PI: D. Weir) The authors are grateful to the Project TALENT participants and the many collaborators past and present who contributed their effort and expertise to this project.


