


1 Introduction
Ethnic bias can be defined as engaging in discriminatory behavior, holding negative attitudes toward, or otherwise having less favorable reactions toward people based on their ethnicity.Footnote 1 Such bias has become an important focus of research in the social sciences. Yet its measurement has long remained a challenge, and the choice of measurement tool can have implications for the conclusions we draw about the presence and effects of ethnic bias.
A first challenge stems from the lack of clarity about what is to be measured. If ethnic bias is defined as having less positive behaviors, attitudes, or other reactions toward noncoethnics than toward coethnics, then ethnic biases can occur on as many dimensions as there are different types of behaviors, attitudes, or reactions to measure. Mistrust or exhibiting lower levels of altruism are forms of ethnic bias, but so too are greater disliking and heightened fear or perceptions of threat. Which of these or other dimensions are of interest to a researcher will generally depend upon the research question and the cognitive, social, political, or other phenomena the researcher seeks to understand. For example, the biases relevant for understanding patterns of economic discrimination, collective action failure, policy outcomes, or voting may be quite different from those relevant for understanding organized inter-group violence or incidental inter-personal conflict. However, perhaps due to the limited range of the existing tool kit for measuring ethnic bias, measurement tools are very often deployed as though they can measure bias per se without careful consideration of the dimensions of bias that may be most relevant for the research question at hand. A study may thus conclude that ethnic bias does not exist when, in fact, the measurement tools used were insensitive to important dimensions of ethnic bias that may have been present.
A second measurement challenge arises due to individuals’ efforts to present themselves in a favorable light. Such self-presentational concerns may cause research participants who hold biases toward out-group members to be reluctant to admit these biases either to investigators or to themselves. Measurement tools vary in their “controllability”: the degree of effort, skill, or task experience that is required for an individual seeking to hide her biases to be able to do so. Even the partial controllability of a measurement tool can be problematic—especially when individuals vary in their ability to take advantage of the opportunity it affords to hide their biases. Together, the challenges of finding measurement tools sensitive to the appropriate dimensions of bias and of dealing with self-presentational concerns under controllability raise important questions about what to make of many of the findings in the literature to date.
These concerns are particularly germane for the large body of research that employs behavioral/experimental economics games (henceforth “economics games”) to measure ethnic bias.Footnote 2 Despite their wide and growing use, the empirical performance of economics games as tools for measuring ethnic bias has raised concerns about what they may miss. Notwithstanding notable studies that find evidence of cross-group bias using economics games (e.g., Mironova and Whitt Reference Mironova and Whitt2014; Iyengar and Westwood Reference Iyengar and Westwood2015; Carlin, Love, and Young Reference Carlin, Love and Young2020), several recent investigations have failed to detect favoritism toward coethnics as compared to noncoethnics in settings where ethnic contestation and even violence suggest that ethnic biases are important features of daily life. For example, Berge et al. (Reference Berge, Bjorvatn, Galle, Miguel, Posner, Tungodden and Zhang2020) find no evidence of ethnic bias in Dictator and Public Goods Games played by a large sample of residents of Nairobi, Kenya, including in experimental sessions scheduled just 1–2 months prior to that country’s 2013 national elections, when the salience of ethnicity was expected to have been heightened (Eifert, Miguel, and Posner Reference Eifert, Miguel and Posner2010). Habyarimana et al. (Reference Habyarimana, Humphreys, Posner and Weinstein2009) also find no evidence of ethnic bias in standard Dictator and Public Goods Games played in Kampala, Uganda, a setting in which ethnicity is similarly important in political and social interactions. The inability of economics games to detect the existence of ethnic biases in these circumstances raises questions about their utility as measurement tools.Footnote 3
Both of the concerns raised above may be responsible for these results. First, as noted, ethnic bias is not one construct but rather a feature that may apply to any attitude, behavior, or reaction that individuals have when interacting with members of other ethnic groups. Economics games may be sensitive to some such sources of bias—for example, differential altruism, trust, and expectations of reciprocity (Camerer Reference Camerer2003)—but blind to other important ones—for example, fear, threat, and dislike. Both the structure of economics games and the laboratory setting in which they are played may cause them to do a better job of capturing bias along the former (more “economic”) dimensions than the latter (more automatic associational or emotional) dimensions. When research subjects play games in a laboratory setting, there is a trusted enforcer, interactions are expected to be civil and safe, and the rules and conditions are common knowledge. These conditions may drive a wedge between any tendency to see members of the other group as threatening or unlikable (outside the lab) and how participants play these games in the lab.Footnote 4
Notwithstanding their development in response to self-presentational concerns in survey research, economics games are not immune to this problem. Although it was hoped that real money stakes would blunt the tendency for participants to conceal their prejudices, multiple studies have now clearly demonstrated that these economics games remain subject to presentational biases (e.g., Haley and Fessler Reference Haley and Fessler2005; List Reference List2007; Levitt and List Reference Levitt and List2007; Zizzo Reference Zizzo2010; Cilliers, Dube, and Siddiqi Reference Cilliers, Dube and Siddiqi2015; Quidt, Haushofer, and Roth Reference Quidt, Haushofer and Roth2018).Footnote 5 This susceptibility stems from a combination of participants’ knowledge that their decisions are being scrutinized and the high controllability of these games, which provide ample opportunity for participants to reflect before responding. In contexts where participants expect open displays of ethnic bias to be frowned upon, they may conceal their biases, behaving in ways not reflective of the underlying preferences the investigators had hoped to measure with these games.
For both of these reasons, even a person who holds real and consequential negative attitudes toward members of another group—and would vote against politicians from that group, support discriminatory policies against that group, and even engage in violence if threatened by a member of that group—may not show those attitudes in how they play various economics games. For example, in a Public Goods Game, such a person may still cooperate briefly with a counterpart from that community, whether to appear less biased to herself or the investigator, or to maximize monetary gains in a laboratory-setting with clear rules, strong enforcement, and no physical or long-term risk. This presents problems for researchers using economics games to understand social, political, or even violent interactions between groups outside the laboratory. It may also explain why researchers working in settings where ethnicity appears to be highly salient in social interactions nonetheless fail to find evidence of ethnic bias in their economics experiments.
1.1 Augmenting the Tool Box: Misattribution-Based Procedures
To address these challenges, we consider a set of tools that do not rely upon effortful and considered decisions as economics games do, looking instead to the more automatic associations and evaluations, be they semantic or affective, that people experience in response to stimuli representing coethnics or noncoethnics. Such automatic processes are extremely relevant and important. They feature prominently in psychological theory dating at least to James (Reference James1890) and are central to contemporary dual-process models (e.g., Gawronski and Payne Reference Gawronski and Payne2010; Lodge and Taber Reference Lodge and Taber2013). They are also the basis for implicit measurement approaches such as the Implicit Association Task (IAT) (Greenwald, McGhee, and Schwartz Reference Greenwald, McGhee and Schwartz1998; Banaji and Greenwald Reference Banaji and Greenwald2013), as well as the misattribution-based procedures we employ here. We expect these tools to be less susceptible to social desirability bias and sensitive to a different set of biases than the economics games. Further, theory suggests that the biases to which these tools are sensitive—emotional reactions and feelings of threat or dislike—may have important implications for out-of-lab group behaviors. A prime example of this connection is the “security dilemma” (Posen Reference Posen1993), which suggests that fear and threat perception play critical roles in conflict escalation, even among groups that would prefer to be cooperative and peaceful. The role of emotions in generating conflictual behavior has been noted by many scholars (e.g., Horowitz Reference Horowitz1995), including a role for fear and feelings of threat in predisposing people toward committing or condoning acts of violence (Petersen Reference Petersen2002) and supporting venal and autocratic leaders (Padro i Miquel Reference Padro i Miquel2007). Work on racial politics in the United States similarly underscores the importance of emotions in explaining attitudes and behaviors (e.g., Banks Reference Banks2014; Peréz Reference Peréz2016). If reactions to noncoethnics along dimensions such as threat, fear, and dislike are important components of the outcomes that social scientists wish to explain, then it is important that researchers employ measurement tools that are able to capture these aspects of ethnic bias.
We adapt three tasks from social psychology for this purpose. All are priming-based paradigms that exploit the idea of misattribution: activation due to a first stimulus (the cue or prime—we use the terms interchangeably) triggers associations that can then be mistakenly attributed to a second stimulus (the target) appearing shortly after. Specifically, each task in our usage here involves trials in which participants first see a prime stimulus, cueing them to either coethnicity or noncoethnicity, and then see a target image that requires some type of judgment about an ambiguous image. According to the misattribution idea, the early automatic associations triggered by the prime “spill over” to the target image, thus influencing how the target is judged.Footnote 6 The first task we employ is the Affect Misattribution Procedure (AMP) (Payne et al. Reference Payne, Cheng, Govorun and Stewart2005), which we structure to detect general positive or negative affect toward coethnics and noncoethnics.Footnote 7 Second, we use a modified version of the Weapon Misidentification Task (WMT) (Payne Reference Payne2001), which seeks to measure fearfulness or threat perception by determining whether individuals are biased toward detecting a weapon (versus a nonweapon) in the hands of a noncoethnic compared to a coethnic. Finally, we employ a modified Face Anger Attribution (FAA) task (Maner et al. Reference Maner, Kenrick, Becker, Robertson, Hofer, Neuberg, Delton, Butner and Schaller2005; Niedenthal et al. Reference Niedenthal, Brauer, Halberstadt and Innes-Ker2001), which also aims to measure fear or threat perception, this time by examining bias in perception of anger in the face of a noncoethnic compared to a coethnic. A major goal and potential contribution of our work is to adapt these tasks for use in a new environment, critical if we are to take seriously the admonition of Henrich, Heine, and Norenzayan (Reference Henrich, Heine and Norenzayan2010) for researchers to broaden the set of societies in which we locate our investigations into human behavior. Although we expect that the basic mental processes on which misattribution-based tasks rest are universal, the implementation of these tasks to date has presumed high literacy, familiarity with computers, and facility with rapidly presented computerized tasks.
The value of these tools is that individuals have great difficulty in controlling or “de-biasing” their evaluations of the target in order to conceal their biases. Misattribution theory holds that people are not able to recognize the influence that the prime has on their perception of the target image, and as a result are not able to eliminate the influence of the prime in how they respond to the target (Payne et al. Reference Payne, Cheng, Govorun and Stewart2005).Footnote 8 Empirically, evidence from over a decade of AMP studies (see e.g., Payne and Lundberg Reference Payne and Lundberg2014 for a review) shows that biases do in fact persist in how participants rate the target, even though participants are encouraged to try to eliminate those biases from their responses in the task instructions.Footnote 9
We recruited participants to an experimental laboratory in Nairobi, Kenya to participate both in these tasks and in a pair of economics games—the standard Dictator Game (DG) and the standard Public Goods Game (PGG)—that have been widely used by researchers to measure ethnic bias. For each economics game or misattribution task, we construct measures of ethnic bias by comparing responses to coethnics and noncoethnics at the individual level. We also employ a more novel economics game, the “Choose Your Dictator” (CYD) game (Berge et al. Reference Berge, Bjorvatn, Galle, Miguel, Posner, Tungodden and Zhang2020), which measures expectations of bias among others. Insofar as participants may be more willing to admit that they expect other people to be biased than to display bias themselves, the CYD may provide insight into the extent to which the DG and PGG results may be affected by self-presentational concerns.
To sharpen our focus on politically relevant inter-ethnic differences, and also to maximize study power, we limit the sample to Kikuyu and Luo participants and restrict all of our ethnic cues to these two groups, since these are the two most politically competitive and historically antagonistic groups in Kenyan national politics. In 2007, inter-ethnic hostility between these two groups escalated to violence resulting in over 1,000 deaths following a contentious presidential election in which the leading candidates were Luo and Kikuyu. Our laboratory experiments were conducted shortly before another presidential election in which the leading candidates were again members of these two communities. Ethnic tensions were thus likely to have been especially high at the time of our study.
We find that the commonly deployed DG and PGG show no evidence of ethnic bias. Among the misattribution tasks, responses in the AMP show strong ethnic bias, which we regard as indicating greater dislike (or lesser liking) of noncoethnics versus coethnics. Evidence of biased responses are also found in the WMT, with individuals more likely to perceive a weapon (rather than a tool) in the hands of a noncoethnic compared to a coethnic. No clear ethnic pattern of responses was found for the FAA. We conclude that the AMP and the WMT detect a set of expected biases, present in the context we study, to which the DG and PGG appear to be blind. The null results for the economics games may stem from the types of bias they measure being absent in this population or from difficulty in measuring any form of bias because participants who are concerned about the way they present themselves are able to hide their biases. We thus recommend that researchers interested in measuring ethnic biases of various types, particularly relating to liking/disliking and fear or perceptions of threat, should consider adding the AMP and WMT to their tool kits.
2 Methods
2.1 Sample Recruitment
We recruited participants from the Kibera and Kawangware neighborhoods of Nairobi to join the general subject pool of the Busara Center for Experimental Economics.Footnote 10 They were then invited to join our study if they were members of either the Kikuyu or Luo ethnic groups. Subjects were further stratified by gender, age and length of residence in Nairobi. The descriptive characteristics of our sample are reported in Table 1.Footnote 11
Table 1. Summary statistics of sample.

Sample characteristics. “Full sample” refers to all individuals for whom we have data. “Final sample” applies our inclusion criterion of scoring above chance on the literacy test.
2.2 Experimental Procedures
Individuals in the study pool were contacted by phone and invited to participate in lab sessions held in a mobile experimental lab set up in a community center in Kawangware. Participants were paid 200 KSh (about $2) for attending the session, plus an additional 50 KSh if they arrived on time. They also received a reimbursement for their transport expenses, as well as whatever they earned from their play during the experimental games. Payments were made via MPESA mobile money transfer after the conclusion of the lab session.
Each session began with an exercise to familiarize participants with the touch screens on the tablet computers used during the experiments. Participants then took an on-screen literacy test, which involved distinguishing between positive and negative words in the participant’s preferred language. They also completed a set of Raven’s matrices, designed to measure cognitive ability (Raven Reference Raven, Raven and Raven2008). The purpose of these tests was to allow us to identify participants who might have difficulty following task instructions or reading the primes required to complete the tasks. A discussion of the exclusion of participants based on their performance on the literacy test is provided in Section 2.4 below.
Instructions for the games and tasks were provided on the computer screens in both English and Swahili and were also read aloud in Swahili by a trained lab leader. For parts of the session where subsets of participants received different instructions or where they completed games or tasks at their own pace, participants put on headphones and received instructions via recordings in Swahili. The ordering of the lab session proceeded as follows:
1. Dictator Game (DG)
2. Public Goods Game (PGG)
3. Choose Your Dictator Game (CYD-Anonymous, CYD-Profiled)
4. Affect Misattribution Procedure (AMP-Universal, AMP-Town, AMP-Region)
5. Face Anger Attribution Task (FAA-Slow, FAA-Fast)
6. Weapon Misidentification Task (WMT)
7. Post-Survey
8. Conclusion and Payment
There is no perfect way to order the tasks. In our case, randomizing the order was not feasible because different platforms were used for presenting the economics games and the misattribution tasks, so these groups needed to be blocked. Working within this constraint, we chose the ordering so that the tasks that were more likely to alert participants to our interest in measuring ethnic bias were put toward the end of the sequence. Thus the misattribution tasks came after the economics games, and, in particular, the WMT came last, as we judged it to be the most potentially revealing of our interest in ethnic bias. Minimizing the social desirability bias in the economics games (by putting them first) also had the benefit of making the comparison between the economics games and the misattribution tasks a harder test of the argument that the latter are less sensitive to social desirability bias.
Participants were paid their earnings from all of the games together in a lump sum (along with their show-up payment and a transportation reimbursement) after the conclusion of the lab session. Hence, there were no opportunities for learning during the course of the experiment nor risk that participants’ knowledge of their accumulating earnings might alter their risk preferences as trials progressed.
We describe the specific procedures for each of the games and tasks below. Diagrams showing the sequence and timing of stimuli for all tasks and games can be found in Appendix A.
Economics Games
In the DG, participants were given 100 KSh and asked to divide this sum between themselves and a “receiver.” They got to keep whatever portion of the endowment they decided not to give away, paid at the end of the lab session. Participants were informed that the receiver was an actual person to whom the money they allocated would be given.Footnote 12 In the anonymous version of the DG, participants were given no information about the receiver. In the “profiled” version, they were shown a photograph of the receiver and given his first name, age, education, and hometown, with the hometown selected so as to provide an indication of the receiver’s likely Kikuyu or Luo origins.Footnote 13 We use hometown as a cue for ethnicity because providing the receiver’s ethnic group membership would have cued participants to our interest in ethnicity and likely generated social desirability bias.Footnote 14 The inclusion of information about the receiver’s age and education was meant to further obscure the ethnic focus of the study. The profiled game was played twice: once with a partner from a coethnic hometown and once with a partner from a noncoethnic hometown, with the order randomized.Footnote 15
Participants in the PGG were given an endowment of 100 KSh and asked to choose how much to keep for themselves and how much to contribute to a group fund in which contributions were multiplied by two before being equally shared among themselves and two other players. Whatever they decided to keep, plus their share of the group fund, was paid to them at the end of the lab session.Footnote 16 Participants first played an anonymous version of the game in which they received no information about the two other players. Then they played a series of profiled rounds in which they were shown photos and provided the names, ages, education levels, and hometowns of the other players. As in the profiled DG, the hometowns were selected so as to provide a strong clue about the players’ Kikuyu or Luo ethnic affiliations. Participants played three rounds of the profiled PGG: one with a “mixed group,” one with a “coethnic group” in which both of the players were from coethnic hometowns, and one with a “noncoethnic group” in which both of the players were from noncoethnics hometowns. The order in which these three rounds were played was randomized.
In the CYD, participants (“choosers”) were presented with profiles of two potential dictators and were asked to choose one to be “their” dictator in a DG.Footnote 17 One of the two profiles was from a coethnic hometown; the other was from a noncoethnic hometown. As in the profiled DG and PGG, choosers were shown photos of the two potential dictators and provided with basic information about their age, education, and hometown. The CYD was played twice. In the first, anonymous, version, choosers selected a dictator after being told that the potential dictators did not have any information about them. In the second version, the choosers selected a dictator after being told that the dictators would be provided with the choosers’ own basic information profile (i.e., their age, years of education, and hometown).Footnote 18 In this profiled version of the game, the chooser’s selection depended on both the expected differences in altruism between the two dictators and the expected altruism of each dictator toward someone with their own information profile.
Misattribution Tasks
Although economics games are widely used in developing country settings such as Kenya, to our knowledge the misattribution-based tasks we employ are novel in this context.Footnote 19 An important contribution of our research therefore lies in determining the feasibility of performing these tasks in a setting in which some participants are illiterate and might be unfamiliar with computers, keyboards, and seemingly artificial speeded-response tasks derived from social psychology paradigms. Language barriers and understanding the task instructions posed additional challenges that required extensive effort to address. For example, we extended the time between trials to prevent participants from feeling that the experiment was “getting away from them.” Experimental instructions were also provided orally, by a lab coordinator, in addition to the on-screen instructions. We also include a series of practice rounds, completed under the lab coordinator’s supervision and with opportunities to ask questions, before proceeding to the full trial sequences. That said, our task still depends critically on literacy, which turned out to be lower than expected in our sample.
In the AMP, participants were first shown a prime word for 200 ms, which they were told to ignore, and then shown an innocuous target image for 500 ms, followed by a white noise mask. This mask, standard in psychometric experiments, ensures that an after-image of the target does not linger and thereby extend the duration of the target image. The participant was asked to rate the target image as pleasant or unpleasant by pressing the appropriate key on a keyboard. The target images were Chinese characters, identical to those used in other studies that have employed this task based on the original design in Payne et al. (Reference Payne, Cheng, Govorun and Stewart2005). The prime word was a (Kikuyu or Luo) hometown in one version of the task (AMP-Town) and a region (“Central” or “Nyanza”—the former strongly associated with Kikuyus, the latter with Luos) in the other (AMP-Region). We also played a third version of the AMP (AMP-Universal) in which the priming word was a term with a nearly universal pleasant or unpleasant connotation (i.e., “sunshine” or “disease”). The purpose of the AMP-Universal was to test whether the AMP produces comparable estimates to that in other populations, given the challenges of language and computer-literacy we face in the context in which we were working. Each version of the AMP contained 30 trials, with the priming words randomized.
The WMT was introduced to participants as an exercise whose goal was to learn how quickly and accurately people are able to identify threats. Participants were very briefly (100 ms) shown an image of a man that they were primed to believe was either a coethnic or a noncoethnic, followed by a mask. Priming was accomplished by flashing the man’s name and hometown (i.e., “Philip from Kisumu”) on the screen for 1,000 ms before showing the image of him holding the object, which was either a weapon (a gun, small knife, or long blade) or a nonthreatening object with a similar shape (a cell phone, flashlight, or folded umbrella). Subjects were instructed to indicate whether they thought the man was holding a weapon by pressing the appropriate key on a keyboard. Prior research in the U.S. context suggests that individuals are more likely to say that they see a weapon when the person is a member of a stereotypically threatening group (see Payne Reference Payne2001 for seminal work and Rivers Reference Rivers2017 for a recent review). In the context we study, members of the Kikuyu and Luo ethnic groups are not widely regarded as being stereotypically threatening. However, following the original misattribution-based logic of the task, we expect the ethnic cue to increase the probability that the participant judges the target image to be a weapon rather than a tool if the cue triggers automatic semantic or affective associations in the participant’s mind that suggest heightened threat. The WMT contained 40 separate trials with images and profiles randomized.
The FAA task was introduced to participants as an exercise designed to see how well people can detect other people’s emotions using only subtle facial cues. Participants were shown an ethnically ambiguous face (which they were primed to believe was either a coethnic or a noncoethnic) in a pose calibrated to be emotionally neutral, or near to it, on a happy-angry scale.Footnote 20 Priming was accomplished by flashing the person’s name and hometown on the screen for 2,000 ms prior to being shown the photo. Participants were then asked to indicate whether they thought the person was angry or happy by pressing the appropriate key on a keyboard. Participants were told (truthfully) that the person was actually angry or happy but was trying to cover up his emotion to look neutral. We conducted two versions of the FAA task: one in which the face was shown very quickly (FAA-Fast) for 500 ms, followed by a mask, and one in which the face was shown for a full 5,000 ms (FAA-Slow).Footnote 21 Prior research suggests that participants are more likely to find faces angry when exposed to faces of members of a group they find to be threatening. Here too, according to the misattribution principle, any feelings or semantic associations of threat or anger with the cued group are expected to increase the probability that the target face is judged to be angry. We thus expected the FAA to pick up bias even in a setting like Nairobi where Kikuyu and Luo are not widely viewed as threatening. Each version of the FAA task contained 40 trials with the faces and hometown profiles randomized.
2.3 Estimation
The most important estimand for each task is the “ethnic effect” as measured by that task. In all tasks but the CYD, this is defined at both the individual level and the group level. For the misattribution tasks in particular, because they contain many trials per person, the individual level effect estimates and the distribution across those estimates are of interest. Beginning with the misattribution tasks (AMP, WMT, and FAA), each has a similar structure: numerous trials, each of which consists of a cue, followed by a target image, followed by a response. The “ethnic effect” of interest in all these tasks simply measured how responses differ depending upon coethnicity. Specifically,
 $$ \begin{align*} \text{EthnicEffect}_i={\mathbb{E}}[r_i|\text{coethnic}]-{\mathbb{E}}[r_i| \text{noncoethnic}], \end{align*} $$
 where r is an indicator for the “positive” response (i.e., a positive rating of the target, perceiving a tool rather than a weapon, or perceiving a happy rather than an angry face). We condition on either seeing a coethnicity cue ( $\text {coethnic}$) or a cue to noncoethnicity ( $\text {noncoethnic}$). For the DG and PGG, the ethnic effect estimand is analogous. For the DG, the question is how the “contribution” of money made by the participant to the other player depends upon the other player’s ethnicity, which is inferred from the other player’s hometown. Similarly for the PGG, we are interested in the difference in expected contributions when participants play with coethnics versus noncoethnics.Footnote 22 In both the DG and PGG the ethnic effect measure is thus
 $$ \begin{align*} \text{EthnicEffect}_i &= \mathbb{E}[\text{contribution}_i | \text{coethnic}] - \mathbb{E}[\text{contribution}_i | \text{noncoethnic}]. \end{align*} $$
Each of these quantities is estimated for person i using simple difference-in-means as the analogous sample estimator, as in
 $$ \begin{align*} \widehat{\text{EthnicEffect}}_i = \frac{1}{N_c}\sum_{t} r_t (\text{coethnic}_t)- \frac{1}{N_{\overline{c}}}\sum_{t} r_t (1-\text{coethnic}_t), \end{align*} $$
 where  $r_t$ is the trialwise response (now either the positive response in the misattribution tasks or the contribution level for the economics games), and $\text {coethnic}_t$ is an indicator equal to one for trials that cue coethnicity and zero for trials with noncoethnics.
This produces one estimate per person per task, which can then be analyzed in various ways. For example, to examine average ethnic effects across the whole sample for a given measure, we write  $\overline {\text {EthnicEffect}} =\frac {1}{N} \sum _{i=1}^N \widehat {\text {EthnicEffect}}_i$. Because the data are reduced to one measure per person per task, in analyzing any given task we do not need to employ cluster-robust standard errors or multi-level models.
The CYD task differs from the others and must be analyzed differently. In each of the profiled and anonymous versions of this task, participants decide to play with a coethnic, a noncoethnic, or the computer. This does not leave us with any person-level ethnic effect measure, but it does give us a measure that, on average across the sample, can be useful, or that can be correlated with other measures. The distribution of responses for the CYD can be found in Online Supplement A. For the mean ethnic effect on CYD tasks, we simply compute the proportion who chose to play with a coethnic, out of those who chose either coethnic or noncoethnic.Footnote 23 The question is then whether this proportion exceeds 50%, which we test using an exact binomial test.
2.4 Exclusionary Criteria
The concerns noted above regarding variation in literacy, language skills, and computer familiarity make thoughtful exclusion of participants who appear unable to perform the tasks even more important than in laboratory experiments set in more familiar environments, where rejection criteria are routinely applied. We preregistered plans to show results without any exclusion, as well as with two types of exclusions: removing individual trials that are clearly problematic, and removing participants who were likely unable to perform the tasks as intended. For the trial-wise exclusion, we remove all trials (from the misattribution tasks) on which the reaction time was less than or equal to our pre-registered cutoff of 200 ms, an implausibly fast reaction time.Footnote 24 This causes us to reject an average of 11.5% of each participant’s trials.
For the participant-wise exclusion, the key concern is literacy. Even if we slow the pace of the AMP, WMT, and FAA, at any reasonable rate the cues had to be presented in writing on the screen, rather than orally. Thus the misattribution tasks cannot work as intended among those who are not able to read somewhat reliably. Given this feature of the experiment and the lower than expected literacy rate in our sample, we conduct our main analyses with only participants scoring at or above chance on the literacy test, dropping a surprising 136 participants.Footnote 25 Results for the full sample without this exclusion can be found in Online Supplement B. Descriptive statistics for both the sample used here and the full sample are provided in Table 1.
3 Results
The first analysis assessed our main question: is each task sensitive to the ethnicity manipulation, thus revealing sensitivity to some form of ethnic bias? These results are shown graphically in Figure 1 and numerically in Table 2.Footnote 26

Figure 1. Mean ethnic effects by task.
Table 2. Mean ethnic effects and universal AMP.
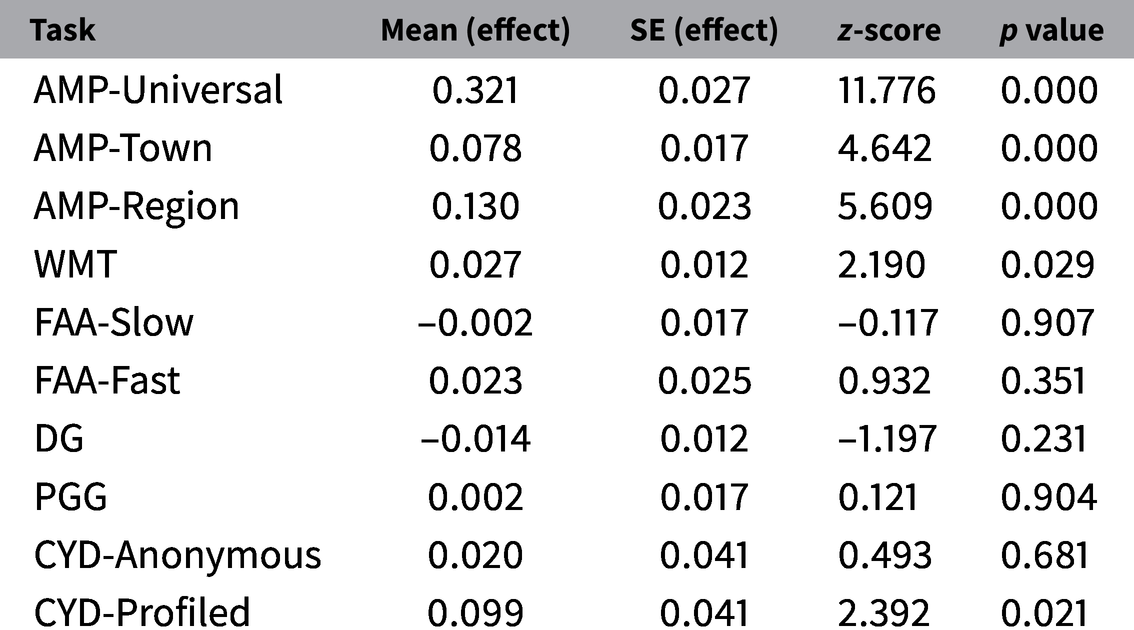
Table showing the (mean) ethnic effect estimates by task/game.
Abbreviations: AMP, Affect Misattribution Procedure; CYD, Choose Your Dictator; DG, Dictator Game; FAA, Face Anger Attribution Task; PGG, Public Goods Game; WMT, Weapon Misidentification Task.
Among the misattribution tasks, AMP-Town, and AMP-Region—both intended to measure positive/negative affective differences across coethnics and noncoethnics—reveal significant ethnic bias with z-scores of 4.6 and 5.6 respectively. Participants are between 8 and 13 percentage points more likely to view an arbitrary target image (a Chinese character) as pleasant when primed by a hometown or region associated with their own ethnic group than by one associated with the rival group. We regard these results as strong evidence that the AMP can detect differences in what we interpret to be positive or negative feelings toward coethnics versus noncoethnics, and that it does detect such effects in this particular sample. These findings are consistent with those reported in Berge et al. (Reference Berge, Bjorvatn, Galle, Miguel, Posner, Tungodden and Zhang2020), who, in a similar Kenyan sample, find statistically significant, albeit weaker, evidence of ethnic bias using the IAT.
Table 2 shows these results numerically, while adding results for the AMP-Universal. As described above, this is not an ethnic effect, but simply a validation that the AMP works in this setting. We see that it has a very strong and clear effect indeed: participants are 32 percentage points more likely to see the target image as pleasant when cued by positive words such as “sunshine” than when cued by negative words such as “disease.” We take this as strong evidence that the AMP “works” in this context, where it has not previously been deployed to our knowledge. This result is almost identical to results of a similar AMP study conducted in the United States using an online platform (Hazlett and Berinsky Reference Hazlett and Berinsky2018), which found an effect of 31–35 percentage points. It is somewhat smaller than estimates from the original AMP study Payne et al. (Reference Payne, Cheng, Govorun and Stewart2005), which employed college psychology students in a laboratory setting.
Next, among the measures intended to detect fear or threat perception, the WMT detects a statistically significant, albeit much smaller effect. Participants are 2.7 percentage points more likely to believe they see a weapon in the hands of a person when cued to believe the person is a noncoethnic than when they are cued to believe the person is a coethnic ( $z=2.19$). While sufficient for standard statistical significance, we withhold judgement as to whether this effect is strong-enough to be reliable and reproducible.Footnote 27 Finally, the FAA task did not detect a significant ethnic effect. It does, however, show a surprising bimodal distribution of ethnic effects across individuals (see Online Supplement A), which we discuss in Section 4. The standard economics games—the DG and PGG—show no detectable average effects, with z-scores of -1.2 and 0.12 respectively. These null findings echo those reported in Berge et al. (Reference Berge, Bjorvatn, Galle, Miguel, Posner, Tungodden and Zhang2020) and in the standard DG and PGG reported in Habyarimana et al. (Reference Habyarimana, Humphreys, Posner and Weinstein2009). The contrast between these findings and those in the AMP and WMT are consistent with the hypothesis that the former are sensitive to types of biases—altruism toward others and expectations of cooperation—that are not present in our sample, while the latter are sensitive to a different set of biases that are, in fact, present.Footnote 28
As noted above, an alternative explanation for the null results in the DG and PGG is that participants do hold biases on dimensions such as altruism and cooperation (which these games seek to measure) but successfully hide these biases when playing these games. This brings us to the CYD, which may sidestep social desirability bias by asking about expectations of bias in others rather than revealing biases that participants themselves may hold. The CYD-Anonymous, like the DG and PGG, shows no detectable ethnic bias. But the profiled version of the CYD (in which choosers believe the dictator will know their ethnicity and will therefore be in a position to discriminate on ethnicity) does show evidence of ethnic bias: participants are 9.5 percentage points more likely than chance to choose a coethnic to be their dictator ( $z=2.30$).Footnote 29 We regard this as evidence either that (1) individuals, regardless of their own altruistic intentions toward coethnics versus noncoethnics, expect others to have greater altruism toward coethnics than noncoethnics or (2) individuals are biased and would favor giving coethnics more money, but self-presentational concerns or normative play prevent this from appearing in the DG, while asking how others would play the DG shields participants from such adjustments. Further, the lack of effect on the anonymous CYD suggests that participants do not simply expect members of other groups to be globally less altruistic. Rather, they specifically expect them to be less altruistic toward out-groups—that is, to be more parochial.Footnote 30
4 Discussion
In designing our experiments, we sought to cue participants to the ethnic backgrounds of the individuals they were exposed to in the games and tasks without emphasizing our interest in ethnicity. Our strategy was to employ hometowns and regions as cues, rather than the labels “Kikuyu” or “Luo.” A potential drawback of this strategy is that the cues, meant to capture differential responses to people from these areas, may instead have picked up differential affect toward the towns or regions themselves. For example, if a participant had fond personal memories of visiting particular (coethnic) areas, the AMP might detect this warm affect toward these areas rather than the affect the participant may have toward people presented as being from those places. However, for such familiarity with coethnic areas to have generated the observed effects, a reasonably large subset of the sample would have to have had positive experiences with a reasonably large subset of the many coethnic (but not noncoethnic) towns used in the experiment. Given that participants were exposed to 14 different coethnic hometowns in the AMP (as well as 14 different noncoethnic hometowns), we find this unlikely. Moreover, if participants felt generically positive (negative) affect toward a large number of towns only because they were “coethnic” (“noncoethnic”), and not out of personal experience, this would qualify as ethnic bias in our view.
A similar argument applies to the WMT, in which participants viewing identical images of men holding an object more often believed they saw a weapon in that person’s hands when the person was described as being from a noncoethnic rather than a coethnic hometown. It is possible that the hometown cue had its effect through priming participants to think about the characteristics of the hometown apart from its predominant ethnic group—for example, some towns may be thought to be more dangerous, leading to the prediction that somebody from that town is more likely to have a weapon. For this account to hold, Kikuyus would need to have frequently found Luo towns to be more dangerous and Luos would need to have frequently found Kikuyu towns to be more dangerous. We again expect this is unlikely to be the case, unless participants make such presumptions based merely on the ethnicity attached to these towns, which would qualify as an ethnic bias.
In either case, however, an interesting feature of biases in fear or threat perception is that they regard the expected behavior of others. We would expect to see a WMT effect so long as participants have an expectation that those in the other group are more likely to show hostility toward the participant than would be members of one’s own group. Such expectations of biases in others (here, expecting heightened hostility from the out-group) qualify as bias by our definition (see footnote 1). Indeed, biases in fear or threat-perception of exactly this kind are clearly relevant to inter-group relations in many settings today.
Relatedly, an important aspect of the WMT is that while this task is often used to measure racial bias in the U.S. context where many individuals hold a stereotype that black people are more threatening (Duncan Reference Duncan1976; Wilson, Hugenberg, and Rule Reference Wilson, Hugenberg and Rule2017), such stereotypes about Kikuyus and Luos are not widely held in Kenya. However, the WMT more generally detects any reason why the participant would view individuals from one group as being more likely to have a weaponthantheir own, even without such stereotypes. These two groups have experienced violent conflict in the past, in particular in the periods leading up to and following national elections.Footnote 31 The results indicate simply that cues regarding the noncoethnic group activate associations and feelings that are threatening enough to skew their perception of the subsequent target image so that, on average, participants more often believe they see a weapon. An important question for future research is whether these reactions would be equally strong during a period more removed from a national election or other episodes of inter-group violence.Footnote 32
Given that both the WMT and FAA are designed to measure the degree of differential threat one feels when cued to a co-ethnic versus a noncoethnic, a question raised by our results is why the WMT detects an effect while the FAA does not. One possibility is of course simple statistical uncertainty. Another is that the two tasks may measure different things. The appearance of emotion on a person’s face (picked up in the FAA) may simply be a less salient concern than whether or not the person is holding a weapon (picked up by the WMT). Moreover, some questions remain unanswered regarding our FAA results. The distribution of individual-level FAA estimates (see Online Supplement A) does show evidence of strong bias for a substantial group of individuals. However, an even larger group has FAA effects that are small in magnitude but have the unexpected sign. The average effect over these groups is not distinguishable from zero. Understanding these results will require further replication and inquiry. Finally, we note that the FAA is the only misattribution task in which a close-up of a face is the target image. To the extent that idiosyncratic features of the face (including any features that strongly identify the person as a Kikuyu or Luo) override the more subtle information provided in the (randomized) profile, the signal may be lost in the noise.Footnote 33
As noted above, the finding of an effect on the CYD-Profiled but not on the DG suggests either that individuals believe that others are biased when they themselves are not or that the DG fails to find a bias because it is more susceptible to self-presentational concerns than the CYD. Either answer presents a minor puzzle of its own. To find that, on average, people say “I am not biased but most other people are” implies an obvious logical paradox. Of course, such paradoxes can be explained simply by people being overly optimistic about their own (lack of) bias, or overly cynical about the biases held by others. The alternative claim—that individuals are biased but cannot reveal that bias in the DG due to normative, contextual or self-presentational concerns—also poses a puzzle. If this is the case, then despite being prevented from acting on their own biases in the DG, participants must fail to foresee that the same pressures will make others behave fairly toward them in the DG.
Of course, variability in these tasks’ vulnerability to social desirability bias would only explain our divergent results if reporting ethnically biased attitudes was prohibited in this context we are studying. Our strong impression, based on discussions with our local collaborators and our own experience working in Kenya, is that ethnicity is widely understood to be a highly sensitive topic. Indeed, the great sensitivity around studying inter-ethnic attitudes and behavior influenced every aspect of our experimental design, the IRB process, the debriefing of participants, and our collaboration with the Busara Center. In the past, the Busara Center has been unable to run certain experiments for fear they may be seen as suggesting participants have “tribalist” views, which would be uncomfortable for participants and damaging to the Busara Center’s reputation. We do note that, in a set of policy-related questions we asked in a follow-up survey, the vast majority of individuals reported preferences consistent with their ethnicity (see Online Supplement D.2). The willingness to report political attitudes that are ethnically patterned, however, seems not to be prohibited to the same degree as showing ethnic bias on an inter-personal level.
Finally, we note that the misattribution tasks specifically theorize that biased assessments of the target image are rooted in longstanding associations that participants have formed with the cued category (here, ethnic group). Although this could be called a “statistical” process, the term “statistical discrimination” is reserved in the study of labor market discrimination for cases where the inferences made about a person based on his/her group membership pertain to unobserved factors relevant to the person’s expected economic productivity. The term “taste-based” is used when the inference made about the person pertains to a noneconomic feature that is imputed to them, such as how much the employer expects to like working with that person. In our tasks, there is not an equivalent to “statistical discrimination,” since the choice made is not related to features that affect economic productivity or job performance. Rather, our results speak to the power and existence, in this sample, of biases along what would be considered “taste-based” features, such as differential liking/disliking and fear of perceived threat.
4.1 Real-World Relevance and Choice of Measurement Tools
The automatic reactions that mistattribution-based tools capture are important affective and cognitive processes, of intrinsic scientific value for many researchers. However, investigators more interested in ultimate individual or group behavior may ask whether these reactions inform realized behavior, or if they are simply “over-ruled” whenever individuals have the opportunity to reflect before acting.
Both theory and evidence suggest that these biases are in fact influential in daily behavior. That individuals do not recognize when their attitudes or perceptions have been informed by these biases—even when warned that they may be—enables these biases to influence a wide range of real-world choices and behaviors, despite opportunities outside of the laboratory to “stop and consider” one’s behavioral choices. Empirically, for example, racial biases detected by the AMP appear to have been predictive of vote choice for President Obama independently of explicit racism measures, conservatism, and symbolic racism measures (Greenwald et al. Reference Greenwald, Smith, Sriram, Bar-Anan and Nosek2009, although see also Kalmoe and Piston Reference Kalmoe and Piston2013). Many additional studies have documented relationships between AMP-based measurements and behavioral or explicit measures.Footnote 34
We propose three conditions that must be met in order for such biases to be “purged” from expressed behavior: (1) motivation to control or de-bias one’s response (in our case, the desire not to be seen as “tribalistic”); (2) ability to control or de-bias one’s response accurately; and (3) the participant’s concern that making the behavioral choice consistent with her/his biases would lead to an unacceptably high risk of being thought to hold that bias. If these conditions are met, biases could be hidden from an otherwise appropriate measurement tool, even though such biases could still have important behavioral and political consequences.
This framework can thus aid investigators in choosing the appropriate tool, or modifying existing tools to break one of these conditions. Measures such as the AMP, WMT, FAA, and other tools in which one’s bias is difficult to control are all useful precisely because condition 2 is expected to fail.Footnote 35 In economics games, by contrast, condition 2 will typically hold because there is ample time and no particular challenge in controlling one’s behavior. This alone does not guarantee that a bias will remain hidden from economics games: conditions 1 and 3 would also need to hold. Condition 1 will hold in cases, like the one studied here, where social prohibitions exist against appearing biased. Regarding condition 3, participants in a DG or PGG may reasonably worry that discriminating against an out-group member will leave them vulnerable to charges of bias.
We are not certain how great a worry this was in our version of these tasks and the context we were studying. An interesting avenue for future research could manipulate condition 3 by structuring these games so that participants do not worry that their biased behaviors will be revealing—for example, by adding additional profile information that offers participants more ways to excuse or justify any biases. Finally, in the CYD, condition 3 is expected to fail because participants know their behavior can be excused as reflecting the anticipated bias in others, not themselves. This is in keeping with our explanation above as to why the CYD produced evidence of bias where the DG and PGG do not.
5 Conclusions
Our study was motivated by the concern, rooted in both theory and empirical performance, that commonly used economics games might be incomplete tools for measuring ethnic bias. The objective of our experiments was to determine whether misattribution-based tasks might be able to measure ethnic biases to which the economics games are blind. We find compelling evidence that at least some of them are. Our results suggest that there are aspects of ethnic bias that exist in our study setting that are detected by the AMP and the WMT: the AMP results suggest that on average, individuals experienced less positive/more negative feelings toward noncoethnics than to coethnics, and the WMT result suggests that individuals experienced greater threat perception when faced with noncoethnics than coethnics. Meanwhile, null results for the DG and PGG suggest either an absence in our study population of the sorts of “economic” biases—differential altruism, trust, expectations of reciprocity—that these games are expected to capture, or greater vulnerability of these measurement tools to social desirability bias. The differing results between the economics games and misattribution tasks support an argument for expanding the tool kit that social scientists use to study ethnic and other group biases, and also for undertaking additional investigations aimed a deepening our understanding of what these different approaches do and do not capture.
Appendix A. Diagrams of the Games and Tasks

For the hometown cues, the Kikuyu-associated towns were: Kikuyu, Wangige, Murang’a, Othaya, Kerugoya, Nyeri, Kiambu, Karatina, Kagio, Maragwa, Nyahururu, Runyenjes, Makuyu, Kinoo, Gakindu, Kinangop, Limuru, Kimende, Mukurweine, and Gatanga. The Luo-associated towns were: Kisumu, Siaya, Kendu Bay, Oyugis, Homabay, Rongo, Migori, Awendo, Uriri, Nyakach, Ranen, Rarieda, Yala, Sondu, Awasi, Mbita, Rusinga, Ugenya, Ukwala, and Ahero.
Acknowledgments
We thank Lornah Wahome, David Clarance, Irene Ngina, Pauline Wanjeri, Suleiman Amanela, Joseph Kimani, Cyrus Muriithi, Chaning Jang, and James Vancel at the Busara Center for Behavioral Economics, as well as Jim Fearon, David Laitin, Efrén Peréz, and participants at the 2018 Society for Political Methodology Summer Meeting, the 2018 WGAPE national meeting, and the Princeton Conference on Identity and Inequality for helpful comments. Thanks to Patricia Valdezco for editing assistance.
Data Availability Statement
The replication materials for this paper can be found on the Harvard Dataverse at Blum et al. (Reference Blum, Hazlett and Posner2020).
Research with Human Subjects
This research was approved by the Institutional Review Boards at UCLA (IRB 17-000775) and Maseno University, Kenya (MSU/DRPI/MUERC/00429/17).
Preanalysis Plan
A pre-analysis plan was registered for this study and can be found at http://egap.org/registration/3102.
Supplementary Material
For supplementary material accompanying this paper, please visit https://doi.org/10.1017/pan.2020.37.


 Open access