


Epidemiological, clinical and animal studies have shown that fetal and early postnatal nutrition alters the development of somatic structure, endocrine systems and homeostatic mechanisms in the fetus and infant. These effects influence the risk of developing obesity and components of the metabolic syndrome in later life(Reference Barker and Law1–Reference Eriksson and Olsson3).
Both low- and high-protein diets fed during gestation and lactation have adverse effects on the offspring(Reference Langley-Evans, Phillips and Jackson4–Reference Zambrano, Bautista and Deas8), but the mechanisms by which they bring about these effects are unclear. Rats born to dams fed a low-protein diet have increased blood pressure (BP)(Reference Langley and Jackson9), body weight (BW)(Reference Zambrano, Bautista and Deas8), adiposity(Reference Macedo, Ferreira and Menegaz10) and compromised glucose metabolism(Reference Desai, Crowther and Ozanne11). Similarly, high-protein diets fed during gestation and lactation increase adiposity(Reference Daenzer, Ortmann and Klaus12), BW(Reference Thone-Reineke, Kalk and Dorn13), BP, food efficiency(Reference Thone-Reineke, Kalk and Dorn13) and decrease energy expenditure in the offspring(Reference Daenzer, Ortmann and Klaus12).
In addition to the requirement for adequate and balanced amounts of essential amino acids for protein synthesis, amino acids have potential to elicit significant effects on development through additional actions(Reference Rees, Hay and Brown6, Reference Langley-Evans14–Reference Brawley, Torrens and Anthony17). The addition of glycine(Reference Jackson, Dunn and Marchand15, Reference Brawley, Torrens and Anthony17) to low-protein diets ameliorates the effect of the diet on vascular dysfunction and BP(Reference Jackson, Dunn and Marchand15), while adding taurine normalises insulin secretion in the offspring(Reference Cherif, Reusens and Ahn18). Although their mechanism of action remains unexplained, it may include their effects on DNA methylation. Amino acids have the potential to affect DNA methylation during fetal development either directly by involvement in DNA methylation pathways or indirectly through effects on hormonal and oxidative status of maternal blood reaching the fetus(Reference Jackson, Dunn and Marchand15, Reference Petrie, Duthie and Rees16, Reference McMillen and Robinson19, Reference Jiang, Sun and Xiong20). Furthermore, because of the effects of individual amino acids on regulatory systems(Reference Rees, Hay and Brown6, Reference Petrie, Duthie and Rees16, Reference Cherif, Reusens and Ahn18–Reference Jiang, Sun and Xiong20), malnutrition may not be the only prerequisite for the effects of proteins and amino acids in maternal diets on development of the offspring. Thus, it is possible that protein source and amino acid composition of nutritionally complete maternal diets affect the phenotype of the offspring. Furthermore, whether development of the offspring is affected differently by dietary protein consumed during gestation only or throughout gestation and lactation has not been reported, but would be expected because the development of regulatory systems in rodents continues in late fetal and early postnatal life(Reference McMillen and Robinson19, Reference Hietaniemi, Santaniemi and Malo21).
The primary objective of the present study was to test the hypothesis that nutritionally complete diets(Reference Reeves, Nielsen and Fahey22) differing in protein sources and fed during gestation alone or during gestation and lactation differ in their effects on characteristics of the metabolic syndrome in the offspring. Therefore, Wistar rat dams were fed either the AIN-93G soya protein (S)- or casein (C)-based diet. In addition, because the Predictive Adaptive Response Hypothesis suggests that the effect of the maternal diet on the offspring is reduced if the diet of the offspring is similar to that of the dams, two groups of offspring from both maternal groups were fed either a S- or C-based diet. Therefore, the secondary objective was to determine the effect of protein composition of the weaning diet on the consequences of the dams' diets in the offspring.
Experimental methods
Animals and diets
First-time pregnant Wistar rats were received at day 3 of gestation (Charles River, QC, Canada) and were housed individually in ventilated plastic transparent cages with bedding at 22 ± 1°C and a 12 h light–12 h dark cycle (lights off at 22.00 to 10.00 hours). At weaning, rat offspring were housed individually in ventilated plastic transparent cages with bedding. The powdered diets were provided ad libitum in stainless-steel cups with a mesh disc insert to reduce spillage. All rats had free access to water throughout the experiments.
The composition of the C diet was as follows: casein (200·0 g/kg), maize starch (529·4 g/kg), sucrose (100·1 g/kg), soyabean oil (70·0 g/kg), cellulose (50·0 g/kg), vitamin mixture (10·0 g/kg), mineral mixture (35·0 g/kg), cystine (3·0 g/kg), choline bitartarate (2·5 g/kg) and tert-butyl hydroquinone (0·014 g/kg). The composition of the S diet was identical to the C diet, except that soya protein replaced casein, and methionine (2·54 g/kg) and cystine (2·54 g/kg) were added to the S diet and cystine (3·0 g/kg) to the C diet as recommended for the AIN-93G diets(Reference Reeves, Nielsen and Fahey22). Amino acid content of the C and S diets as fed is shown in Table 1. Maize starch, high-protein casein (87 %) and cellulose were purchased from Harlan Teklad (Madison, WI, USA). The vitamin and mineral mixtures, cystine, methionine, choline bitartrate and tert-butyl hydroquinone were purchased from Dyets, Inc. (Bethlehem, PA, USA), sucrose from Allied Food Service (Toronto, ON, Canada) and soyabean oil from Loblaws (Toronto, ON, Canada).
Table 1 Amino acid composition of casein and soya protein AIN-93G diets (g/kg diet)*
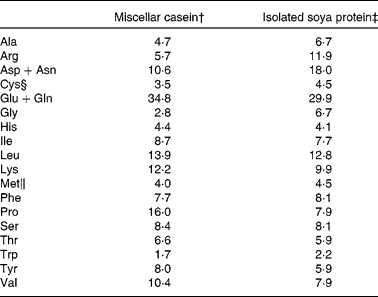
* The amino acid content of the diets is calculated based on purity of the protein sources (87 and 90 % for casein and soya protein, respectively) and the totals include the addition of the free amino acids.
† Harlan Teklad.
‡ Dyets, Inc.
§ Cystine was added to both casein (3 g/kg diet) and soya protein (2·54 g/kg diet) diets.
∥ Methionine was added to only the soya protein diet (2·54 g/kg diet).
Genistein, daidzein and glycitein content of the S diet was 36·1, 31·3 and 4·4 μg/g, respectively.
The protocol was approved by the University of Toronto Animal Care Committee and care and maintenance of the animals conformed to the guidelines of the Canadian Council on Animal Care.
Experimental design
To examine the main and interactive effects of the dams' and the pups' diets on the offspring, two experiments were conducted with a 2 × 2 design. To test the primary hypothesis, the C and S diets were fed to the dams only during gestation in Expt 1 and throughout gestation and lactation in Expt 2. To test the Predictive Adaptive Hypothesis, male offspring from both Expt 1 and 2 were fed either a C or S diet and were followed for 9 and 15 weeks post-weaning, respectively.
Expt 1: the effect of protein source in the diet fed during gestation and after weaning on components of the metabolic syndrome in male offspring
The objective of the present study was to investigate the effect of the C or S diet fed to pregnant dams only during gestation on postnatal development in male offspring fed either a C or S diet. Beginning at 3 d of gestation, two groups of pregnant rats (n 12) were fed either a C or S diet. During lactation, both groups received only the C diet. BW of the offspring was measured at birth (day 1, after litters were culled to 10 pups) and on days 7, 14 and 21. At weaning (day 21 of age), one male offspring from each mother in each diet group was assigned to either the C or S diet (n 12). BW was measured weekly for 8 weeks after weaning. Systolic BP (SBP) and diastolic BP (DBP) and pulse rate at week 4 and blood glucose (BG) response to a glucose load at week 8 were measured. Fat pad mass (FPM: abdominal+epididymal+perirenal fats) was measured at killing at 9 weeks.
Expt 2: the effect of protein source in diets fed during gestation and lactation and after weaning on components of the metabolic syndrome in male offspring and in the dams
The objective of the present study was to investigate the effect of feeding the dams the C and S diets throughout gestation and lactation, and to extend the duration of observation on the pups fed either the C or S diet. During gestation and lactation, two groups of pregnant rats (n 12) were fed either the C or S diet, and were maintained on the same diets for another 6 weeks after weaning. At weaning, one male offspring from each mother in each diet group was assigned to either the C or S diet for 15 weeks (n 12). For the remaining pups, BW was measured at birth (day 1, after litters were culled to 10 pups) and on days 7, 14 and 21. At birth, weaning (day 21 of age) and at week 15 post-weaning, rats (twelve animals per dam diet group) were killed. BW was measured weekly from weaning to week 15 after weaning. Body fat composition was determined at birth, at weaning and at week 15. SBP and DBP were measured at week 2 in the dams, and SBP, DBP and pulse rate at weeks 4, 8 and 12 in the pups. Glucose and insulin tolerance tests (ITT) were conducted at weeks 4, 8 and 12.
Trunk blood of fetuses (n 5–6) obtained at day 20 of gestation in Expt 2 and pups at birth in both experiments was pooled. Pups (n 12) were killed by decapitation after a 12 h overnight food deprivation at week 9 in Expt 1, and at weaning and week 15 in Expt 2. Plasma concentrations of insulin, homocysteine, corticosterone, albumin and glucose were measured.
Dams from Expt 2 on the S or C diet were killed at days 14 and 20 of gestation (n 6) and at week 6 after weaning (n 12). Glucose tolerance tests (GTT) were conducted at 3 weeks post-weaning. Plasma concentrations of glucose, insulin, corticosterone, homocysteine and albumin were measured.
Glucose tolerance test
Rats were fasted overnight for 10 h. A blood sample was withdrawn from the tail vein before and at 15, 30 and 60 min after a glucose administration (0·375 g glucose/ml, 5 g glucose/kg BW).
Insulin tolerance test
Rats were fasted overnight for 10 h. Insulin (Humulin®-R; Eli Lilly and Company, Indianapolis, IN, USA) injections were given intraperitoneally (0·5 U/ml, 0·75 U insulin/kg BW) and blood was obtained before and at 15, 30 and 60 min after an insulin injection.
Blood pressure
SBP and DBP were measured by the non-invasive tail-cuff method with optical plethysmography using a tail manometer-tachometer system (BP-2000, Visitech system; Apex, NC, USA). Rats were restrained in holders on a platform with constant temperature of 30°C. They were adapted daily to the device for 5 d. On the day of measurement, five mock measurements preceded a series of ten measurements and only the latter were used in calculating the average as reported previously(Reference Szeto, Aziz and Das23).
Blood glucose
Tail vein glucose concentration was assayed using a hand-held commercial glucose meter (MediSense Precision Xtra; Abbott Laboratories, Alameda, CA, USA) using test strips(Reference Szeto, Aziz and Das23). Glucose in plasma from trunk blood obtained upon decapitation was measured using a glucose oxidase kit (Ascensia Elite XL; Bayer AG, Leverkusen, Germany).
Blood collection
Trunk blood was collected in chilled vacutainer tubes (BD, Franklin Lakes, NJ, USA) containing EDTA+Trasylol® (Bayer AG, Leverkusen, Germany) solution (10 % blood volume, 5 × 10⁸ Iu/l). Blood samples were centrifuged for 20 min at 3000 g and 4°C for 10 min. Plasma was separated and immediately stored at − 80°C.
Hormone assays
Plasma insulin was measured using Insulin Enzyme Immunoassay (Cat no. 80-INSRT-E01; Alpco Diagnostics, Salem, NH, USA) with an assay sensitivity of 0·124 ng/ml. Plasma homocysteine was measured by Enzyme Immunoassay (Cat. no. 194-5361; Bio-Rad Laboratories, Inc., Hercules, CA, USA) with a sensitivity of 1·0 μmol/l. Plasma albumin was measured using a colorimetric assay (Cat. no. 11970909; Roche Diagnostics, Indianapolis, IN, USA) with a sensitivity of 2·0 g/l. Plasma corticosterone was measured using Enzyme Immunoassay (Cat. no. DSL-10-81 100; Beckman Coulter, Webster, TX, USA) with an assay sensitivity of 1·6 ng/ml.
Body composition
Fat mass and lean mass were measured at birth by dual-energy X-ray absorptiometry (pSabre; Orthometrix, Naples, FL, USA) applying a specialised software program (Host Software version 3.9.4; Scanner Software version 1.2.0)(Reference Sacco, Jiang and Reza-Lopez24). After killing, carcasses were placed directly on the dual-energy X-ray absorptiometry. All scans were performed at a speed of 10 mm/s and a resolution of 0·5 × 1·0 mm. At weaning and at the end of the experiments, FPM was measured by dissection of extracted abdominal, epididymal and perirenal fat.
Isoflavone measurement
Homogenised soya protein samples were analysed for isoflavones (genistein, daidzein and glycitein) by GC–MS, as described previously(Reference Thompson, Boucher and Cotterchio25). The isoflavone analysis involved extraction of samples twice with 5 ml of 70 % methanol, passing a portion of extraction through a C18 solid-phase extraction column (SPE column; Octadecyl C18/14 %, 200 mg/3 ml; Applied Separations, Allentown, PA, USA), hydrolysis with β-glucuronidase (Helix Pomatia; Sigma-Aldrich, St Louis, MO, USA) and passage through another C18 SPE column. An internal standard (5α-androstane-3β,17β-diol; Steraloids, Inc., Wilton, NH, USA) was added to the column eluent, and the sample was then derivatised with Tri-Sil Reagent (Pierce Company, Rockford, IL, USA) before injection to the GC–MS (Agilent 6890 series GC system interfaced with an Agilent 5973 network mass selective detector; Agilent Technologies, Wilmington, DE, USA).
Statistical analyses
All data are expressed as means with their standard errors. BG response was calculated as the total incremental area under the curve (tAUC) of the BG concentration over 1 h after receiving glucose administered for the GTT and after receiving insulin injection for the ITT. For the former, the reported tAUC is positive above baseline, whereas for the latter, the tAUC is a negative representing the area below baseline. The homeostasis model assessment of insulin resistance (HOMA-IR) index was calculated as fasting glucose multiplied by fasting insulin divided by 22·5(Reference Muniyappa, Lee and Chen26). All analyses were conducted using SAS (version 9e; SAS Institute, Cary, NC, USA). The effect of the two diets fed to the dams, the two diets fed to the pups and the interactions between the dams' and pups' diets on BW, glucose response, SBP and DBP was analysed by two-way ANOVA. When repeated measures were made over time on BW and BG, the PROC MIXED MODEL procedure was used with dams' diets, pups' diets and time as main factors. A one-way ANOVA followed by post hoc Tukey's test was conducted to compare treatment effects when interactions were statistically significant. Student's unpaired t test was applied to mean comparisons of effects of the maternal diets on plasma measures. Statistical significance was defined at P < 0·05.
Results
Expt 1: the effect of protein source in the diet fed during gestation and after weaning on components of the metabolic syndrome in male offspring
Gestational diet did not affect birth weight (6·2 (sem 0·2) v. 6·3 (sem 0·1) g) in rats born to dams fed the C and S diets, respectively. However, at week 9, BW of offspring born to the S diet-fed dams was 5 % higher (450·3 (sem 5·7) v. 427·3 (sem 5·3) g, P < 0·05; Fig. 1). At week 4, SBP was 18 % (P < 0·05), DBP was 7 % (P < 0·05) and pulse rate was 6 % higher (P < 0·01) in pups born to dams fed the S diet (Table 2). At week 9, fasting BG was 8·5 % higher in rats born to the S diet-fed dams (P < 0·05; Table 3). However, the gestational diet did not affect glucose response to glucose administration in the offspring at week 8 (Table 4) or FPM (15·6 (sem 0·7) and 15·2 (sem 0·7) g, C and S diets, respectively) at week 9.
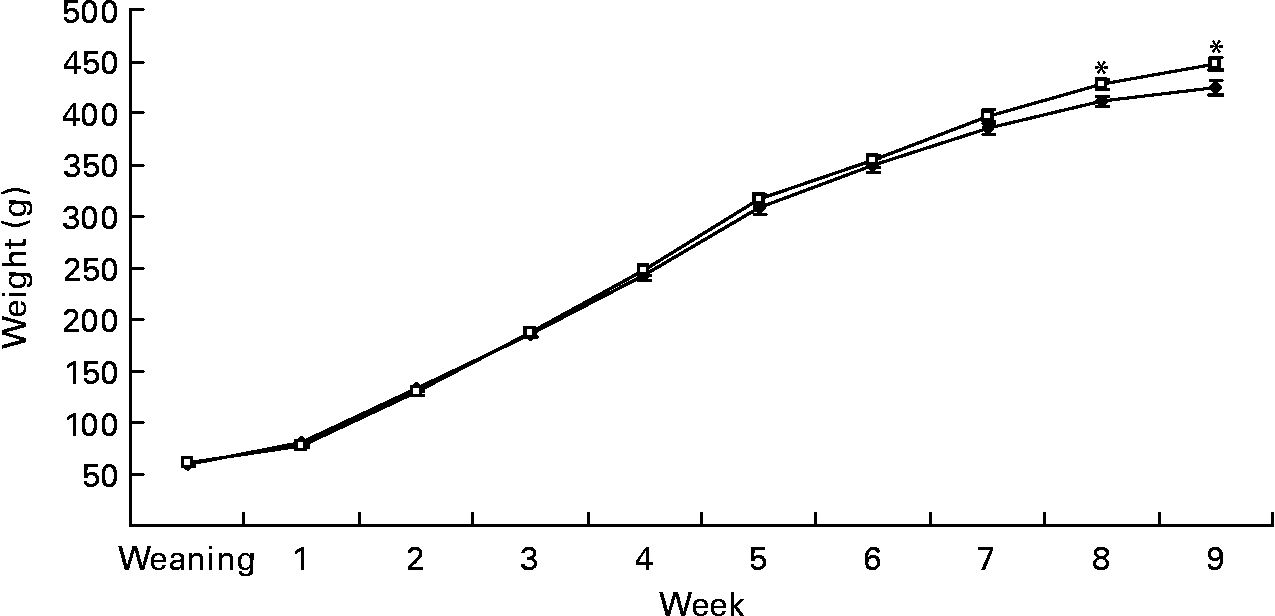
Fig. 1 Expt 1: effect of protein source during gestation on post-weaning body weight (BW) of male offspring. Values are means, with their standard errors represented by vertical bars (n 12). BW was analysed by MIXED model followed by Tukey's post hoc test with gestational diet, weaning diet and time as main factors: gestational diet (NS); weaning diet (NS); time (P < 0·0001); gestational diet × time (P < 0·005). * Mean values were significantly different (P < 0·05). Data are pooled for the pup diet to present the effect of gestational diet alone on BW. C, casein (–♦–); S, soya protein (–□–).
Table 2 Effect of protein source in diets of dams and offspring on systolic blood pressure (SBP) and diastolic blood pressure (DBP) and pulse rate*
(Mean values with their standard errors, n 11–12)

D, dams' diet; C, casein; S, soya protein; W, weaning diet; T, time; BPM, beats per minute.
a,b Mean values within a row with unlike superscript letters were significantly different (P < 0·05).
* MIXED model with D and W (Expt 1) and D, W and T (Expt 2) as main factors followed by Tukey's post hoc test when interaction was significant.
Table 3 Effect of protein source in diets of dams and offspring on fasting plasma measures in the offspring*
(Mean values with their standard errors, n 5–6)

D, dams' diet; C, casein; S, soya protein; W, weaning diet; HOMA-IR, homeostasis model assessment of insulin resistance.
* MIXED model with D and W diets as main factors. Expt 1: interaction for HOMA-IR (P = 0·06).
† HOMA-IR index was calculated as fasting glucose (mm) multiplied by fasting insulin (ng/ml) divided by 22·5.
Table 4 Effect of protein source in diets of dams and offspring on blood glucose response during the oral glucose and insulin tolerance tests*
(Mean values with their standard errors, n 10–12)

D, dams' diet; C, casein; S, soya protein; W, weaning diet; T, time; GTT, glucose tolerance test; ITT, insulin tolerance test.
* MIXED model with D and W as main factors.
† GTT: after overnight fasting, rats received glucose (0·375 g glucose/ml, 5 g glucose/kg body weight) by oral administration and blood glucose was measured before and 15, 30 and 60 min later.
‡ ITT: insulin (Humulin® R; Eli Lilly and Company, Indianapolis, IN, USA) injections were given intraperitoneally (0·5 U/ml, 0·75 U insulin/kg body weight) and blood glucose was measured before and 15, 30 and 60 min later.
The pup diet influenced glucose metabolism. At week 8, the tAUC for glucose after the glucose administration was higher in rats weaned to the S diet (P < 0·001; Table 4). At week 9, higher fasting BG (14 %, P < 0·01), insulin (11 %, P < 0·005), and HOMA-IR index (45 %, P < 0·001) were found in rats weaned to the S diet (Table 3) but, as indicated, by an interaction (P = 0·06) between the gestational diets and weaning diets, the effect of the weaning diet was stronger in those born to dams fed the S diet.
Expt 2: the effect of protein source in diets fed during gestation and lactation and after weaning on components of the metabolic syndrome in male offspring and in the dams
Offspring
There were no differences (C v. S diets, respectively) due to the protein source in the dams' diets on the pups at birth in litter size (13·2 (sem 0·7) and 13·2 (sem 0·5)), male:female ratio (0·53 (sem 0·05) and 0·52 (sem 0·03)), body fat (0·3 (sem 0·04) and 0·4 (sem 0·05) g) or BW (6·2 (sem 0·2) and 6·3 (sem 0·1) g) and at weaning in BW (62·2 (sem 2·1) and 56·3 (sem 3·2) g) and FPM (0·5 (sem 0·1) and 0·4 (sem 0·1) g). However, at week 15, BW of offspring was higher by 9 % (615·5 (sem 8·2) v. 564·8 (sem 8·8) g, P < 0·05) if born to S v. C diet-fed dams (Fig. 2). Their abdominal fat (22·0 (sem 1·5) v. 18·2 (sem 1·0) g, P < 0·05) and FPM were also larger in offspring (34·9 (sem 2·4) v. 30·9 (sem 1·8) g, P < 0·05) born to S diet-fed dams at week 15.

Fig. 2 Expt 2: effect of protein source during gestation and lactation on post-weaning body weight (BW) of male offspring. Values are means, with their standard errors represented by vertical bars (n 12). BW was analysed by MIXED model followed by Tukey's post hoc test with the diets fed during gestation and lactation (dams' diets), weaning diets and time as main factors: gestation and lactation diet (P < 0·05); weaning diet (NS), dams' diet × time (P < 0·01). * Mean values were significantly different (P < 0·05). Data are pooled for the pup diet to present the effect of the dams' diet alone on BW. C, casein (–♦–); S, soya protein (–□–).
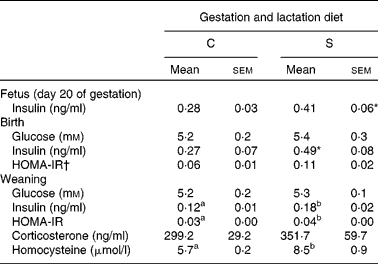
There was no effect of protein source in diets fed throughout gestation and lactation on fasting plasma glucose at birth or at weaning in the offspring (Table 5). However, the dams' diet affected glucose metabolism in later life. Fasting BG at week 15 was higher in offspring born to dams on the S diet (P < 0·005; Table 3). BG (tAUC) response to the glucose administration was also higher at weeks 4, 8 and 12 (P < 0·002) in offspring from the S diet-fed dams. The effect of the dams' diet became stronger with time (P < 0·0001) as shown by the interaction (P < 0·05) of the dams' diet with time.
Table 5 Expt 2: effect of protein source fed during gestation and lactation on fasting plasma measures in offspring
(Mean values with their standard errors, n 5–6)
C, casein; S, soya protein; HOMA-IR, homeostasis model assessment of insulin resistance.
a,b Mean values within a row with unlike superscript letters were significantly different (P < 0·05).
* P = 0·08; unpaired t test.
† HOMA-IR index was calculated as fasting glucose (mm) multiplied by fasting insulin (ng/ml) divided by 22·5.
The effect of insulin injections (ITT) on BG was not affected by dams' or weaning diets or by time. The source of protein in the dams' diets had no effect on plasma insulin in the fetus at day 20 (P = 0·08) or in the pups at birth (P = 0·08; Table 5). However, at weaning, offspring born to the dams fed the S diet had higher fasting plasma insulin (50 %, P < 0·05), HOMA-IR (33 %, P < 0·05) and homocysteine (32 %, P < 0·05) (Table 5), and at week 15, had higher HOMA-IR (24 %) (P < 0·01; Table 3). Higher SBP and DBP were found in the offspring born to the S diet-fed dams at 4, 8 and 12 weeks (P < 0·05; Table 2). This effect of the gestation and lactation diet of the dam interacted with the weaning diet (P < 0·01), explained by much higher SBP in pup consuming the S diet and born to mothers fed the S diet. Pulse rate of the offspring was also higher at 4, 8 and 12 weeks in the offspring born to dams fed the S diet (P < 0·05). Overall, pulse rate decreased with time (P < 0·05; Table 2). The dams' diet had no effect on fasting plasma corticosterone in the offspring (Tables 3 and 5). The pup diet had no statistically significant effect on any of the parameters measured.
Dams
BW of the dams was not affected by their diet during gestation (Fig. 3). However, BW was higher after parturition (7 %) and at week 1 of lactation (9 %) in dams fed the C diet (P < 0·05). Fasting plasma glucose was higher in S diet-fed dams at day 14 (9 %, P = 0·06) and at day 20 (16 %, P < 0·05), but not at week 6 after weaning. No dams' diet effects were found in dams' fasting plasma insulin at day 14 or 20 of gestation, but insulin was higher at week 6 in dams fed the S diet (21 %, P < 0·05), as was the HOMA-IR index at day 20 of gestation (72 %, P < 0·05) and week 6 after weaning (30 %, P < 0·05) (Table 6). The diets of the dams did not affect their fasting plasma homocysteine, corticosterone or albumin (Table 6), SBP and DBP at week 2 after weaning (Table 2), GTT and ITT at week 4 after weaning or FPM at days 14 and 20 or week 6 after weaning (data not shown).

Fig. 3 Expt 2: effect of protein source during gestation, lactation and 6 weeks post-weaning on body weight (BW) of dams. Values are means, with their standard errors represented by vertical bars (n 12). BW was analysed by MIXED model followed by Tukey's post hoc test with diet and time as main factors: diet (NS); time (P < 0·0001); diet × time (P = 0·08). * Mean values were significantly different (P < 0·05). C, casein (–♦–); S, soya protein (–□–).
Table 6 Expt 2: effect of protein source fed during gestation and lactation on fasting plasma measures in the dams
(Mean values with their standard errors, n 5–6)

C, casein; S, soya protein; HOMA-IR, homeostasis model assessment of insulin resistance.
a,b Mean values within a row with unlike superscript letters were significantly different (P < 0·05, unpaired t test).
* P = 0·06; unpaired t test.
† HOMA-IR index was calculated as fasting glucose (mm) multiplied by fasting insulin (ng/ml) divided by 22·5.
Discussion
The results of these experiments support the hypothesis that nutritionally complete diets differing in protein sources and fed during gestation alone or during gestation and lactation differ in their effects on characteristics of the metabolic syndrome in the offspring. The S diet, compared with the C-based diet, increased BW, body fat, SBP and DBP, and led to impaired insulin sensitivity and glucose tolerance in the male offspring. However, protein source in the pups' diet had little impact on the primary effects of protein source in the dams' diets on the offspring.
Extending the duration of the test diets from gestation alone in Expt 1 to gestation and lactation in Expt 2 resulted in a more robust effect of the S diet on BW, body composition and glucose metabolism in the offspring. The S diet fed during gestation and lactation increased BW of the offspring 4 weeks earlier (weeks 4 v. 8) than when fed only during gestation and also led to impaired glucose metabolism. Furthermore, it was made clear that the increase in BW was due to increased body fat. Thus, protein composition in the diet consumed during lactation also affected development and is consistent with continued development of intake regulatory systems of the hypothalamus and gastrointestinal tract in rodents in late pregnancy and the early postnatal period(Reference McMillen and Robinson19, Reference Remacle, Dumortier and Bol27).
The effects of protein source in diets fed to the dams throughout gestation and lactation were not modified by the composition of diets fed to the pups. This was surprising because the Predictive Adaptive Response Hypothesis is based on the premise that offspring weaned to similar diets as their mothers will adapt more appropriately to their postnatal environment than those receiving an unmatched diet(Reference Gluckman and Hanson28). Clearly, the adverse effect of the S diet fed to the dams on BP (Table 2) and glucose regulation (Tables 3–5) in the offspring was not diminished by feeding the pups with S diets.
The more favourable effect of casein on BP (Table 2) may have its origins in both the amino acids and bioactive peptides (BAP) it contains. Casein and soya protein differ in amino acid composition(Reference Phillips, Tang and Morre29) (Table 1). Soya protein contains only half the proline content of casein and may be a factor because the high BP of offspring born to dams fed low-protein gestational diets is reduced by adding glycine, proline and/or threonine(Reference Jackson, Dunn and Marchand15, Reference Bagley and Stipanuk30). Consumption of hydrolysates of proteins lowers BP in both human subjects and animals(Reference FitzGerald, Murray and Walsh31, Reference Mizuno, Nishimura and Matsuura32), suggesting that bioactive peptides may be a factor. For example, in hypertensive human subjects, consumption of a daily dose of casein hydrolysate (0·49 g/d) containing the peptides valine–proline–proline and isoleucine–proline–proline, known to inhibit in vitro angiotensin-converting enzyme, lowered both SBP and DBP(Reference Nakamura, Mizutani and Sasaki33). In hypertensive rats, oral administration of derivatives of casein hydrolysate (32 mg/kg BW per d) significantly decreased BP(Reference Mizuno, Nishimura and Matsuura32). Based on in vitro measures of angiotensin-converting enzyme activity, bioactive peptides have been found to be more abundant and inhibitory in casein(Reference FitzGerald and Meisel34) than in soya protein(Reference Meisel, Schwenke and Mothes35, Reference Saito36) but their role in vivo is uncertain because of the low absorption of the active peptides(Reference Foltz, van der Pijl and Duchateau37). However, casein is also rich in casomorphins capable of activating opioid receptors in the enteric nervous system and on the vagus, resulting in vasodilation(Reference FitzGerald, Murray and Walsh31, Reference FitzGerald and Meisel34, Reference Meisel38).
A weakness of the present study is that the effects observed could be due to a combination of the effects of the proteins and the amino acid additions to the diets. Thus, it cannot be concluded that soya protein alone had adverse effects compared with casein. To provide an adequate diet, as recommended in the AIN 93G diets, both methionine and cystine were added as free amino acids to the S diet and cystine was added to the C diet. These additions may be important because methionine content of the diet has a direct relationship with plasma homocysteine, and increased homocysteine concentration has been related to hypomethylation of DNA(Reference Jiang, Sun and Xiong20) and disturbed key events in organogenesis and in embryonic vasculogenesis(Reference Steegers-Theunissen and Steegers39). In the present study, plasma homocysteine was 48 % higher at weaning and 7 % higher at week 15 in the offspring born to the S diet-fed dams (Tables 3 and 5). The origin of this higher concentration of homocysteine is puzzling because total methionine content of the diets was similar (4·0 v. 4·5 g/kg diet). However, 54 % of the methionine in the S diet was in the form of free amino acid and would be expected to result in a faster absorption compared with methionine released during digestion. Cystine was also added to both diets (Table 1). The effect of cysteine on homocysteine is unclear because previous studies have reported that cysteine both increases(Reference Hultberg, Andersson and Masson40, Reference Verhoef, Steenge and Boelsma41) and decreases(Reference Fukada, Morita and Sugiyama42) homocysteine in human subjects.
The higher concentrations of homocysteine may also be attributed to insulin resistance as it occurred in the offspring with higher HOMA-IR indices at weaning (Table 5) and at week 15 (Table 3). Previous studies have found that insulin resistance provokes hyper-homocysteinaemia in both human subjects(Reference Giltay, Hoogeveen and Elbers43) and rats(Reference Fonseca, Keebler and Dicker-Brown44). Insulin regulates plasma homocysteine concentration via hepatic cystathionine β-synthase, a key enzyme involved in the trans-sulfuration activity(Reference Randeva45).
Finally, the effect on the dams of the S diet consumed during gestation and lactation may have contributed to metabolic differences in the offspring (Table 6). The S diet-fed dams had higher BG and HOMA-IR index values, concurrently with a trend to higher plasma insulin in their fetuses at day 20 of gestation. Glucose intolerance during gestation is known to lead to overweight, impaired glucose tolerance, hyperinsulinaemia and insulin resistance in juvenile and adult rat offspring, irrespective of any genetic disposition(Reference Dorner, Plagemann and Ruckert46–Reference Dorner and Plagemann48). Although the increased BW seen in infants from mothers that have type 2 diabetes was not observed in the rat offspring at birth, much higher BG concentrations and insulin resistance than found here are required(Reference Silverman, Rizzo and Green49, Reference Plagemann, Harder and Kohlhoff50). In the present study, while plasma glucose concentrations in S diet-fed dams were statistically significantly higher (averaging 6·5 mm) at day 20 of gestation, these concentrations would not be sufficient to classify them as diabetic and unlikely to affect the BW of their offspring at birth.
Many physiological properties of soya protein are attributed to its isoflavone content, specifically genistein(Reference Cassidy and Griffin51–Reference Kavanagh, Jones and Zhang55) or interactions between isoflavones and other components in the diet (e.g. amino acids)(Reference Noriega-Lopez, Tovar and Gonzalez-Granillo56). However, the isoflavone content of soya protein is an unlikely factor in the results obtained as the levels were below that associated with physiological effects. The genistein content of the S diet was 36 μg/g of the diets, well below that reported (250 μg/g diet) in the maternal diet to affect epigenetic and phenotypic changes in mice(Reference Dolinoy, Weidman and Waterland57). Similarly, the results obtained from the present study cannot be explained by stress responses of the dams or pups, for two reasons. First, there were no differences due to the diet in litter size or birth weight of the offspring, or in BW of dams at arrival, days 14 and 20 of gestation (Fig. 3). Second, no difference was found in fasting corticosterone level in either dams at days 14 and 20 of gestation and week 6 post-weaning or pups at weaning and week 15 (Tables 3, 5 and 6).
In summary, this is the first study to show that nutritionally complete diets based on soya protein or casein and fed to rat dams affect the metabolic phenotype of the offspring. This observation is of particular significance because the majority of animal studies aimed at understanding the effects of maternal diets on development are based on malnutrition models. In contrast, the present study shows that metabolic outcomes in the offspring may differ among ‘normal’ diets used for maintenance of the dams during pregnancy and lactation. For example, the source of protein in laboratory chow diets is highly variable and often includes herring fish, whey and plant proteins. In addition, there are several recommended AIN-93 diets with various sources of proteins (e.g. casein, soya and whey protein). Clearly, even though judged to be nutritionally complete diets, protein source and many other aspects of test diets fed during pregnancy and lactation in animal models of development could be a factor explaining variance in outcomes among studies.
The relevance of these results to human subjects is uncertain because human diets during gestation contain many mixed protein sources. On the other hand, infants are weaned to formula that are dependent on single sources of proteins or their hydrolysates during early life and may be a factor affecting development of regulatory systems and later life outcomes.
Conclusion
Soya protein, when compared with casein-based AIN-93G diets and fed during gestation or during gestation and lactation, increased the risk of developing characteristics of the metabolic syndrome in the offspring.
Acknowledgements
The present study was supported by the Natural Sciences and Engineering Research Council of Canada. The authors thank the management and technicians at the Department of Comparative Medicine at the University of Toronto. All the authors contributed to the preparation of the paper and read and approved the final manuscript. G. H. A. and A. J.-M. conceptualised and designed the research. A. J.-M., P. S. P. H., C. Smith, A. Hamedani and B. L. L. conducted the research. A. J.-M. analysed the data. A. J.-M., G. H. A. and I. M. Y. S. wrote the paper. G. H. A. had the primary responsibility for the final content. The authors declare that there are no conflicts of interest.


