


CVD and type 2 diabetes are leading causes of death in the USA. Studies show that metabolic syndrome (MetS) is an important determinant of cardiovascular risk and other related CVD( Reference Alberti, Eckel and Grundy 1 , Reference Kawada 2 ). In the USA, South Asian(s) (SA) are one of the fastest-growing minorities( Reference Kawada 2 ); however, very little is known about the prevalence of MetS and its metabolic profile in a diverse group of low-income SA Americans( Reference Singh and Miller 3 ). MetS studies of SA in the Asian subcontinent have shown increased prevalence compared with Americans( Reference Ramachandran, Snehalatha and Satyavani 4 , Reference Misra and Khurana 5 ). In the USA, low-income SA populations have a greater prevalence of obesity and related diseases( Reference Gany, Levy and Basu 6 , Reference Misra and Ganda 7 ), have less access to healthful foods, less physical activity outlets and generally less knowledge related to health management( Reference Ramachandran, Snehalatha and Satyavani 4 , Reference Misra and Khurana 5 ). Physiological and metabolic markers of low-income immigrant populations associated with MetS can be assessed in community health clinics. Accurate assessment of MetS and its components, particularly obesity( Reference Misra, Pandey and Sinha 8 , Reference Misra, Chowbey and Makkar 9 ), has been important in identifying individuals at greater risk for chronic disease and can be important to individuals who may not be able to afford regular preventive health care( Reference Misra and Khurana 5 ).
MetS is a clustering of atherogenic metabolic abnormalities with different definitions( Reference Alberti, Eckel and Grundy 1 , Reference Misra, Chowbey and Makkar 9 – Reference Ford 11 ). Recently, several major organizations developed a consensus definition of MetS. This new, harmonized definition (2009) requires the presence of three or more of the following five components: (i) abdominal obesity as measured by waist circumference (WC); (ii) elevated TAG; (iii) low HDL-cholesterol (HDLC); (iv) elevated blood pressure; and (v) elevated fasting blood glucose( Reference Alberti, Eckel and Grundy 1 ).
There has been continued effort to improve the definition for MetS as well as its clinical detection. There is still debate about the clinical usefulness of some components in SA( Reference Alberti, Zimmet and Shaw 10 , Reference Ford 11 ). However, abdominal obesity (WC) is now the recommended anthropometric measure for MetS because it has been shown to be more important in the development of CVD-related illnesses( Reference Alberti, Eckel and Grundy 1 ). WC has rarely been measured in the clinic environment in the past compared with BMI. Much controversy exists, particularly in SA, related to the accuracy of the obesity cut-offs (WC and BMI) for elevated risk and the appropriate cut-off values to use. This discussion has been particularly relevant for SA groups since Asians tend to have a higher percentage of body fatness at lower BMI and WC values( Reference Abbasi, Malhotra and Mathur 12 – Reference Misra and Khurana 16 ), therefore facing elevated risk at WC and BMI values below established European-derived cut-off values.
More is known about MetS in SA residing in Asia and Europe than is known about immigrant SA residing in the USA. Furthermore, although the prevalence of MetS has been reported in previous population studies of Asian Indians( Reference Misra, Wasir and Pandey 17 , Reference Khanna, Kapoor and Kumar 18 ), few studies exist, in the USA, on MetS in SA from countries other than India, such as Pakistan, Bangladesh, Sri Lanka, Iran, Afghanistan, Bhutan and Nepal, all of which make up the SA region. Moreover, the clustering of MetS indicators has not been studied among the broader grouping of SA in the USA. Finally, the studies we do have on SA Indians mentioned previously( Reference Misra and Khurana 16 ) are not recent and have mostly used definitions of MetS that are no longer recommended.
The purpose of the present research is to examine the prevalence of MetS and its abnormal indicators in and among an ethnically diverse sample of low-income adult SA of both sexes residing in Maryland. We also want to develop and suggest an appropriate BMI cut-off that captures a similar prevalence of MetS to that recommended for SA by the current consensus definition.
Experimental methods
Subjects
The total sample consisted of 1403 apparently healthy SA men and women aged between 20 and 68 years whose countries of birth were Pakistan, India, Bangladesh, Sri Lanka, Iran, Afghanistan, Bhutan and/or Nepal. The sample was obtained from two religious community medical centres in Montgomery and Baltimore Counties in the State of Maryland between May 2012 and June 2013. The two centres, in addition to acting as a focal point for social and religious activities of the mostly Muslim community, also provided free primary medical care for low-income and indigent members of the community. Individuals who were pregnant and those with other metabolic diseases (cancer, CVD, type 1 diabetes, HIV) were excluded. From the clinical file extraction (CFE), we excluded individuals sampled from the clinical files with incomplete data such as date of birth, ethnicity and variables needed to calculate MetS.
Our research consisted of two databases that totalled 1403 subjects. The first sample included a CFE (n 1002) and the second interviewees (n 401), as described below.
Our goal was to determine the BMI cut-off value (from the interviewees) that would be comparable to that calculated by the suggested harmonized definition( Reference Alberti, Eckel and Grundy 1 ). First, the prevalence of MetS was calculated using the harmonized definition in the sub-sample (n 401). Next, we wanted to test the validity of these WC cut-offs in the sub-sample (n 401). In order to derive the WC values we performed receiver-operating characteristic (ROC) curve analysis and used established procedures described below to determine the optimal WC cut-off values. ROC curve and correlation analyses, performed on the interviewed sample, revealed that the harmonized WC cut-offs (≥90 cm in males, ≥80 cm in females) were appropriate. Next, we determined which BMI cut-off gave a comparable prevalence of MetS to the recommended WC cut-offs( Reference Alberti, Eckel and Grundy 1 ) using several BMI cut-off values previously suggested for SA (e.g. 23·0 kg/m2 ( 13 ), 25·0 kg/m2 ( Reference Snehalatha, Viswanathan and Ramachandran 19 , Reference Tan, Ma and Wai 20 ), 30·0 kg/m2 ( Reference Snehalatha, Viswanathan and Ramachandran 19 , Reference Vasudevan, Stotts and Mandayam 21 )). Some of these BMI values were derived from ROC curve analysis( Reference Misra, Pandey and Sinha 8 , Reference Schisterman, Perkins and Liu 22 ).
The BMI of 23·0 kg/m2 was found to be a good substitute for the harmonized WC cut-off value, yielding a similar percentage of MetS. Thus, the cut-off of 23·0 kg/m2 was then used to study MetS prevalence in the second sample of 1002 subjects for whom WC was not available in their clinic records and on the combined sample of 1403 subjects.
Interviewed sample
A convenience sample of 401 consecutive walk-ins was interviewed in their native language by one of us. Sample size was determined by performing a power calculation based on MetS prevalence from previous SA studies in the USA( Reference Flowers, Molina and Mathur 23 , Reference Misra, Patel and Kotha 24 ) (27 %). This calculation resulted in a sample size of 400 with a reasonable minimum effect of α=0·05, a minimum power to detect that effect, and the sample size that would achieve that desired level of power was 80 %.
All walk-in patients consented for interviews. Medical and chronic disease history, smoking, alcohol consumption, income categories ($US 0–15 000, $US 16 000–30 000, $US 31 000–45 000), highest education completed (none, junior high, high school, bachelor, graduate), sociodemographic data (age, country of origin, smoking, physical activity, total years in the USA) and the reason for clinic attendance were obtained. Physical activity was defined as activities above and beyond daily living (cleaning, cooking and household chores), measured by four questions: (i) ‘Do you engage in vigorous exercise?’, (ii) ‘How many days a week?’, (iii) ‘How many minutes a day?’ and (iv) ‘What exercise do you engage in?’ where 1=walking, 2=running, 3=jogging, 4=weight, 5=stretch, 6=other. Weight, height and WC were obtained on these individuals. Their weight and height were measured on a Detecto Promed 6129 scale (Toldedo, OH, USA) with subjects wearing light street clothing with shoes removed. Weight was measured to the nearest 0·1 kg and height to the nearest 0·1 cm. Subjects removed hair ornaments and buns from the top of the head in order to measure stature. BMI was calculated as (weight in kg)/(height in metres)2. WC was measured at the midpoint point between the iliac crest and lower rib to the nearest 0·1 cm. The cut-off values for WC were ≥90 cm in males, ≥80 cm in females( Reference Gany, Levy and Basu 6 ).
Information on the remaining MetS indicators were obtained from the clinic charts of these 401 subjects. The laboratory values were analysed by Lab Corp. (Burlington, NC, USA).
Assessment of metabolic syndrome from interviews
The diagnosis of MetS was based on the harmonized definition( Reference Misra, Chowbey and Makkar 9 ) which required the presence of three or more of the following five components: (i) abdominal obesity (WC cut-offs for SA: men ≥90 cm, women ≥80 cm); (ii) elevated TAG (≥150 mg/dl or statins use); (iii) low HDLC (<40 mg/dl in men, <50 mg/dl in women or use of medication); (iv) elevated blood pressure (systolic/diastolic ≥130/85 mmHg or use of antihypertensive medication); and (v) elevated fasting glucose (>100 mg/dl or use of hypoglycaemic agents).
Clinical files
A systematic sample of clinic records of SA American subjects was obtained using the following formula: K≤N/n. From a random start we selected every second file until the target sample size (n 1002) was reached. For all subjects (both interviewed and clinic charts) we obtained standard background information including socio-economic (income, education), sociodemographic (age, ethnicity) and medical history (family background of disease, smoking, etc.).
Assessment of metabolic syndrome from clinical file extraction
The diagnosis of MetS for interviewees was based on the harmonized definition( Reference Misra, Chowbey and Makkar 9 ) which required the presence of three or more of the five components, as described above. However, for the 1002 clinical files, we used a modified harmonized definition (employing a BMI of 23·0 kg/m2 instead of WC, which was not present in clinic files). BMI (kg/m2) was categorized as: underweight (BMI<18·5kg/m2), normal (18·5 kg/m2≤BMI<22·9 kg/m2), overweight (23·0 kg/m2≤BMI<24·9 kg/m2) and obese (BMI≥25·0kg/m2) as recommended by WHO( 13 , 25 ) for SA.
The prevalence of each abnormal component of the MetS was measured individually and in combinations of two, three and four for the entire sample (n 1403) and for the larger ethnic group categories (i.e. Indians, Pakistanis and Bengalis).
Statistical analysis
All data were analysed using the SAS statistical software package version 9·2. Results were expressed as means and their standard errors or as numbers and percentages. Student’s t test was used to compare means between groups and the χ
2 test to compare proportions between groups. We used ANOVA to compare the characteristics of MetS indicators among groups. ROC curve analyses were used (n 401) to determine the appropriate sex-specific WC cut-offs for MetS and to compare the sensitivity and specificity of BMI and WC cut-off values. We used two or more risk factors from the harmonized definition (in addition to WC or BMI cut-off) to define MetS, including hypertriacylglycerolaemia, hyperglycaemia, hypertension and low HDLC. Using logistic regression analysis and plotting sensitivity v.
 $$1{\minus}{\rm specificity}$$
, we investigated which WC cut-off value best predicted MetS using two or more abnormal MetS indicators. Perfect prediction using WC would have a point on the ROC curve with 100 % sensitivity and specificity. The distance on the ROC curve from perfect prediction was calculated for WC values. To determine the optimal thresholds, the point on the ROC curve with maximum Youden index (
$$1{\minus}{\rm specificity}$$
, we investigated which WC cut-off value best predicted MetS using two or more abnormal MetS indicators. Perfect prediction using WC would have a point on the ROC curve with 100 % sensitivity and specificity. The distance on the ROC curve from perfect prediction was calculated for WC values. To determine the optimal thresholds, the point on the ROC curve with maximum Youden index (
 $${\rm sensitivity}{\minus}{\rm (1}{\minus}{\rm specificity)}$$
), and the point with shortest distance value from the point (0, 1) (
$${\rm sensitivity}{\minus}{\rm (1}{\minus}{\rm specificity)}$$
), and the point with shortest distance value from the point (0, 1) (
 $$d=\sqrt {{\rm (1}{\minus}{\rm sensitivity)}^{{\rm 2}} {\plus}{\rm (1}{\minus}{\rm specificity)}^{{\rm 2}} } $$
), were calculated(
Reference Schisterman, Perkins and Liu
22
). These are the two most commonly used methods for establishing the optimal cut-offs(
Reference Schisterman, Perkins and Liu
22
), P≤0·05 was considered statistically significant.
$$d=\sqrt {{\rm (1}{\minus}{\rm sensitivity)}^{{\rm 2}} {\plus}{\rm (1}{\minus}{\rm specificity)}^{{\rm 2}} } $$
), were calculated(
Reference Schisterman, Perkins and Liu
22
). These are the two most commonly used methods for establishing the optimal cut-offs(
Reference Schisterman, Perkins and Liu
22
), P≤0·05 was considered statistically significant.
For the interviewees (n 401), we performed a logistic regression to evaluate the associations between those with and without MetS and exercise, years in the USA, years in school, income and country of origin. Age and sex were covariates.
All interviewees gave informed consent before participating in the study. The study protocol for all subjects was approved by both the Institutional Review Board of University of Maryland and the review boards of the two community centres.
Results
The sample consisted of a total of 1403 low-income, uninsured SA immigrants to the USA who utilized two community health centres in Montgomery and Baltimore Counties in the State of Maryland. Data were collected on 1002 subjects from the clinical files and an additional 401 subjects were separately interviewed. Both samples were similar in terms of mean age, ethnic breakdown, education within ethnic groups, mean income and mean years of residence in the USA. Forty-seven per cent of the total sample was male (n 661) and 53 % was female (n 742). The sample included individuals from: India 18 %, Pakistan 53 %, Bangladesh 16 %, Nepal 4 %, Sri Lanka 2 %, Afghanistan 2 %, Iran 3 % and Bhutan 1 %. We divided the sample into four subgroups: Pakistanis, Indians, Bengalis and, due to small sample sizes, the remaining nationalities into a category called ‘Other SA’ (Table 1). The mean height, weight and BMI are presented in Table 1. Overall, 71 % of the subjects were overweight and obese. Normal-weight subjects comprised 27 % of the sample, while 40 % were overweight, 31 % were obese and <1 % were underweight (BMI≤18·5 kg/m2). Underweight subjects (n 10) were not analysed.
Table 1 Demographic and clinical characteristics by sex among South Asian American adults aged 20–68 years from two community health centres in Montgomery and Baltimore County, MD, USA, May 2012–June 2013

WC, waist circumference; HDLC, HDL-cholesterol; BP, blood pressure.
Mean value was significantly different from that of females: *P<0·05, **P<0·001.
† ‘Other SA’ comprise individuals from Sri Lanka, Nepal, Iran, Afghanistan and Bhutan.
A majority of the subjects in all ethnic groups were married and/or living with a partner. Education status varied significantly by sex; 20 % of females had no education compared with only 7 % of males. Bengali subjects had the lowest education level (18·3 % were educated to the 5th grade level), while Indians were the most educated (22 % at the graduate level). Males also had a higher mean number of years in school (13 (se 4) years) compared with females (11 (se 5) years; P<0·05). The majority of the sample reported an income of $US 30 000 or less for a family of four. More than half of the subjects reported being employed (53 %), while 47 % were unemployed. The mean number of years residing in the USA was 11 (se 9) years. The mean length of residence in the USA was significantly longer (P<0·05) for males (12 (se 9) years) compared with females (10 (se 9) years; P<0·05). Nearly 80 % of the sample was Muslim and the remainder were Christian, Hindu, Sikh and Buddhist. The subjects spoke seventeen different languages. The predominant languages spoken were Urdu, Panjabi and Bengali. Smoking was reported by 2 % of the sample (n 28) and was more common in males than females. Table 1 shows the mean lipid and blood pressure values for the entire sample. In our interviewed sample, the ethnic differences defined by the country of origin showed that, overall, Indians had the highest prevalence of MetS (55 %) compared with Bengalis (51 %), Pakistanis (49 %) and Other SA (44 %).
Prevalence of metabolic syndrome in the interviewed sub-sample
The sub-sample of interviewed subjects (n 401) included 190 males and 211 females. They exercised on average for two days out of the week for about 22 min/d. The mean WC was not statistically different between males (97 (se 12) cm) and females (96 (se 13) cm). More females had abnormal WC values (57 %) compared with males (43 %). Subjects were asked the reason for their visit and they reported the following (from most to least prevalent): for colds and flu (46 %), follow-up visits to receive pain medication (27 %), regular annual visit for women (18 %) and check-up for an existing condition not related to MetS (9 %). Two females refused to participate in our study due to a lack of time for the survey; therefore, selection bias was unlikely. These females were not significantly different from the other subjects and their refusal did not affect our results.
MetS prevalence using the consensus harmonized definition (WC cut-off value of ≥90 cm in males and ≥80 cm for females) was 46 % for males and 54 % for females (Table 2).
Table 2 Prevalence of metabolic syndrome, comparing BMI and WC cut-offs by sex, among South Asian American adults aged 20–68 years from two community health centres in Montgomery and Baltimore County, MD, USA, May 2012–June 2013
WC, waist circumference.
† WHO recommendation for South Asians(25).
‡ Consensus harmonized definition for South Asians(1).
§ ‘Other SA’ comprise individuals from Sri Lanka, Nepal, Iran, Afghanistan and Bhutan.
Receiver-operating characteristic curve analysis
Given that the suggested harmonized ethnic-specific WC cut-off for SA was developed mainly using samples of Asian Indians, we examined the applicability of these standards to our more diverse sample of SA using a ROC curve analysis. BMI and WC had similar abilities to predict MetS (Fig. 1).
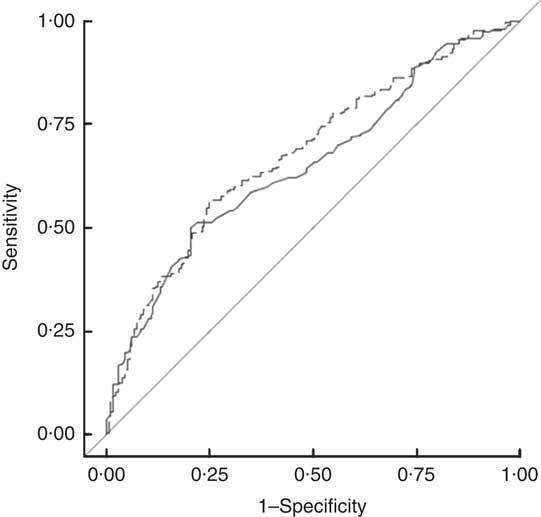
Fig. 1 Comparison of harmonized WC cut-offs (≥90 cm in males, ≥80 cm in females(1); ——, AUC=0·6518) and BMI (≥23·0 kg/m2 (13); – – –, AUC=0·6796) in predicting prevalence of metabolic syndrome in 1403 South Asian American adult males and females aged 20–68 years from two community health centres in Montgomery and Baltimore County, MD, USA, May 2012–June 2013 (WC, waist circumference; AUC, area under the ROC curve; ROC, receiver-operating characteristic)
A separate ROC curve analyses indicated that a WC (and two additional abnormal indicators) value of 89 cm for men and 79 cm for women optimally predicted MetS in SA Americans (Table 3). Using these cut-offs, there would be a slight, but non-significant, increase in the prevalence of central obesity and in the age-adjusted prevalence of MetS for males compared with that measured by the harmonized MetS definition. Our results were thus similar to confirming the utility of the harmonized recommendation of 90 cm for males and 80 cm for females.
Table 3 Sensitivity, specificity, AUC and distance in the ROC curve for WC cut-off values, by sex, among South Asian American adults aged 20–68 years from two community health centres in Montgomery and Baltimore County, MD, USA, May 2012–June 2013
AUC, area under the ROC curve; ROC, receiver-operating characteristic; WC, waist circumference.
† Metabolic risk factors were defined according to the International Diabetes Federation harmonized definition: elevated TAG, ≥150 mg/dl or treatment for hypertriacylglycerolaemia; reduced HDL-cholesterol, <40 mg/dl for men and <50 mg/dl for women or treatment for this lipid abnormality; elevated blood pressure, ≥130 mmHg systolic and/or ≥85 mmHg diastolic or treatment for previously diagnosed hypertension; elevated fasting plasma glucose, ≥100 mg/dl or previously diagnosed type 2 diabetes(1).
Prevalence of metabolic syndrome in the clinical file extraction sample
Subjects from the clinic files (n 1002) included 511 males and 491 females. Their mean age (49 years in males, 47 years in females), income (98 % of sample below the federal poverty line) and education (12 years) were similar to those of the interviewed sample. The percentage of abnormal indicators was similar in the CFE sample compared with the interviewed sample; for example, the prevalence of abnormal HDLC was 46 % and 44 %, respectively. The prevalence of MetS for the CFE sample (n 1002) using a modified BMI (23·0 kg/m2) definition was similar in males and females (49 % and 47 %, respectively) to that found in the interviewees (46 % in males and 54 % in females).
Because the prevalence of MetS was similar in the CFE sample and the interviewees, we decided to combine them (n 1403) to calculate the sex-specific prevalence of MetS, 48 % in males and 47 % in females.
Prevalence of metabolic syndrome by ethnic group
The prevalence of MetS differed by ethnicity, obesity measures (BMI and WC), obesity cut-offs and sex (Table 2). In Pakistani males, the prevalence of MetS using WC (≥90 cm) was 49 % and BMI (≥23·0 kg/m2) was 50 %. In Pakistani females, the prevalence of MetS using WC (≥80 cm) was 49 % and using BMI (≥23·0 kg/m2) was 49 %. Indian females had the highest prevalence of MetS (62 %) using the harmonized WC measure (Table 2). Bengali males had the highest prevalence of MetS (50 %) using the harmonized WC measure. The prevalence of MetS in the aggregated ‘Other SA’ males using the harmonized WC (≥80 cm) was 25 %, and for Other SA females was 56 % with the same criteria. Females had a higher prevalence of MetS using the harmonized WC cut-off, while males had a higher prevalence of MetS using the WHO BMI cut-off (Table 2). Indian males had a greater prevalence of MetS (47 %) than females (45 %) using BMI as cut-off; however, females had a greater prevalence using WC cut-offs (62 %) compared with males (46 %).
Within the Bengali group, males had a lower prevalence of MetS (50 %) compared with females (52 %) using both WC and BMI measures (45 % and 53 %, respectively). Among the Pakistani group, females had a similar prevalence of MetS using WC compared with males (49 % v. 49 %).
The percentage of abnormal body composition as assessed by BMI (overweight, obese) differed by ethnic groups. Pakistanis had the highest percentage of obese individuals (36 %) followed by Other SA (29 %), Bengalis (15 %) and Indians (5 %). The percentage of overweight subjects in descending order included: Bengali (42 %), Pakistani (40 %), Other SA (40 %) and Indians (39 %). Bengalis had a lower percentage of subjects who were obese compared with Pakistanis and Indians, yet the highest percentage in the overweight category. The association between BMI status and ethnicity was significant (P<0·001). The means for the MetS components of TAG, fasting blood glucose and diastolic blood pressure were not significantly different among the ethnic groups as measured by ANOVA GLM. The only significant differences were between Bengali females and Other SA females for HDLC values.
Metabolic syndrome indicators
The most prevalent single abnormal indicator was low HDLC and the two most prevalent abnormal indicators were low HDLC and elevated TAG (Table 4). SA Indians presented a different pattern of clustering compared with Pakistanis and Bengalis. Low HDLC and elevated blood glucose concentrations were more prevalent in SA Indians.
Table 4 Frequency of one or more abnormal components for metabolic syndrome, by sex, among South Asian American adults aged 20–68 years from two community health centres in Montgomery and Baltimore County, MD, USA, May 2012–June 2013

HDLC, HDL-cholesterol <40 mg/dl (men), <50 mg/dl (women); TAG, ≥150 mg/dl; GLU, fasting blood glucose ≥100 mg/dl; WC, waist circumference ≥80 cm (men), ≥90 cm (women).
† Single most common single abnormal indicator.
‡ Two most common abnormal indicators.
§ Three most common abnormal indicators.
|| Four most common abnormal indicators.
Determining predictors of metabolic syndrome
Logistic regression analysis showed that age was the only statistically significant predictor (OR=9·6; 95 % CI 1·0, 1·0; P<0·001) of MetS for males in our sample. The odds of developing MetS were higher in older SA than in younger SA. Years in the USA, minutes of exercise, income and education were not statistically significant predictors for males. For females, age and minutes of exercise were the only statistically significant predictors of MetS (OR=16·4; 95 % CI 1·03, 1·08; P<0·0001 and OR=0·14; 95 % CI 1·01, 1·02; P<0·05, respectively).
Discussion
While much is known about MetS prevalence and its abnormal indicators in certain groups of Americans( Reference Alberti, Eckel and Grundy 1 , Reference Eckel, Alberti and Grundy 26 – Reference Beltrán-Sánchez, Harhay and Harhay 29 ), little is known about MetS prevalence in SA Americans. Moreover, most existing studies of SA have focused on Indians( Reference Misra, Pandey and Sinha 8 , Reference Anjana, Sandeep and Deepa 14 , Reference Misra, Wasir and Pandey 17 , Reference Khanna, Kapoor and Kumar 18 , Reference Dudeja, Misra and Pandey 30 – Reference Gadgil, Anderson and Kandula 32 ), neglecting other groups of SA. The present work represents one of only a few studies to examine MetS prevalence (and the prevalence of abnormal indicators) in the USA in a large sample of SA Americans of different ethnicities and use the newer suggested cut-offs.
In our sample of over 1400 SA American individuals of diverse ethnicity, the prevalence of MetS using the modified harmonized definition (≥23·0 kg/m2)( 13 ) was 49 %; 50 % for males and 48 % for females. These prevalences are lower than those recently reported in the USA by Khanna et al. (77 %)( Reference Khanna, Kapoor and Kumar 18 ), similar to those found by Ramachandran et al. (41 %)( Reference Ramachandran, Snehalatha and Satyavani 4 ) and lower than those observed by Flowers et al. and Dodani et al. (27 %)( Reference Flowers, Molina and Mathur 23 , Reference Dodani, Henkhaus and Wick 33 ) who also used the harmonized WC cut-offs. Prior to the advent of the new harmonized definition, it had been difficult to compare studies of SA since different researchers used different MetS definitions( Reference Alberti, Eckel and Grundy 1 , Reference Alberti, Zimmet and Shaw 10 , Reference Cameron, Shaw and Zimmet 34 ), various cut-offs( Reference Misra, Wasir and Pandey 17 , Reference Balkau, Charles and Drivsholm 35 – Reference Sandeep, Gokulakrishnan and Deepa 37 ) as well as different measures of obesity (WC v. waist-to-hip ratio v. BMI)( Reference Abbasi, Malhotra and Mathur 12 , Reference Anjana, Sandeep and Deepa 14 , Reference Vasudevan, Stotts and Mandayam 21 , Reference Lear, Toma and Birmingham 38 ) for MetS.
Most studies drawn from clinic files data have used weights and heights for the calculation of BMI. The recommendation to use WC rather than BMI as a measure of obesity has gained momentum recently since the finding that abdominal obesity may be more highly associated with CVD and diabetes( Reference Anjana, Sandeep and Deepa 14 , Reference Premanath, Basavanagowdappa and Mahesh 39 , Reference Kanaya, Wassel and Mathur 40 ) than is overall obesity reflected by BMI. WC is largely absent from older clinic files. Therefore, it has been difficult for researchers to use the harmonized definition based on WC cut-offs. This has compromised our ability to compare studies of MetS prevalence in SA. Herein, we determined an appropriate BMI cut-off value for MetS that gave a similar prevalence of MetS to that using the harmonized WC cut-off. We then applied this BMI cut-off to the clinic file sample (n 1002). Our analyses revealed that the BMI cut-off value of 23·0 kg/m2 gave a similar prevalence of MetS as the WC cut-off recommended by the new consensus harmonized definition. Our proposed BMI cut-offs are congruent with the previously recommended BMI cut-offs for SA by Misra et al.( Reference Misra, Pandey and Sinha 8 ), who performed ROC curve analysis and suggested 23·0 kg/m2 for females and 24·0 kg/m2 for males. Ramachandran et al.( Reference Ramachandran, Snehalatha and Satyavani 4 ) studied South Indians of both sexes who attended hospitals in India found a MetS prevalence of 42 % overall, 36 % for men and 47 % for women( Reference Ramachandran, Snehalatha and Satyavani 4 , Reference Razak, Anand and Shannon 41 ). In 2011, Dodani et al.( Reference Dodani, Henkhaus and Wick 33 ) conducted a community-based cross-sectional study to ascertain the prevalence of MetS in South Asian immigrants to examine the association between MetS and HDLC function, apolipoprotein (APO1) gene polymorphisms and subclinical coronary artery disease using common carotid intima-media thickness as a surrogate marker. MetS was significantly associated with BMI≥23·0 kg/m2 and three APO1 SNP (G2, G3 and G5). The sample contained 35–65-year-olds (seventy-six males, fifty-three females) from Georgia, Kansas and Missouri. Their study used Hindu temples as recruitment sites with a total sample size of 129 first-generation SA Indians. The subjects were categorized not by country but by various language groups (SA, n 33; Guajarati, n 23; Hindi, n 23; Bengali, n 10; Punjabi, n 8; Other, n 4). Using the International Diabetes Federation definition (similar to the harmonized definition), they found the MetS prevalence to be 30 % in SA immigrants without coronary artery disease. In that study, Dodani et al.( Reference Dodani, Henkhaus and Wick 33 ) found the prevalence of MetS to be significantly correlated to BMI > 23·0 kg/m2.
We found that the prevalence of MetS differed among the three largest ethnic groups with SA Indian females having the highest prevalence of 62 % and clustered with two abnormal MetS indicators differently, compared with the other SA groups. Similar to Dodani et al.( Reference Dodani, Henkhaus and Wick 33 ), our results showed that Indians had the highest percentage of abnormal HDLC and fasting blood glucose compared with Pakistanis while Bengalis showed a higher prevalence of abnormal HDLC and TAG. These differences existed despite controlling for age, education level and income. The number of years resident in the USA was highest for Indian females and their mean WC was also higher than that of the other ethnic groups, suggesting possible increased adoption of Western eating and activity patterns. Comparisons of females using the harmonized BMI cut-off (≥23·0 kg/m2 for overweight) revealed that overweight Indian females had the highest prevalence of MetS (62 %) compared with all other overweight females (50 %). These results suggest that Indian women may have greater metabolic abnormalities at lower BMI levels than do women from other SA groups.
There have been similar suggestions from other studies of SA Indians( Reference Razak, Anand and Shannon 41 – Reference Samaha 44 ). It may also be that at lower BMI levels, abnormal fasting blood glucose increases the risk for the development of MetS in Asian Indians compared with abnormal HDLC and TAG. Although one would surmise that Indians and Pakistani have similar genetic histories, the division of India and Pakistan into separate states for over 60 years and the even longer divergent dietary differences related to their religions may explain the differences found in this and other studies.
Our results suggest that lumping all East Asians and South Asians into one category, i.e. ‘all Asian’, may not accurately represent the biological diversity inherent in the Asian populations. It may be necessary to disaggregate Asian ethnic groups by country of origin for more comprehensive analyses. Our data, and the findings of others, suggest that the metabolic profiles of Asian Indians may be different enough to warrant further comparisons of the different SA groups.
Our findings from the ROC curve analysis (WC of 89 cm for women, 79 cm for men) were largely concordant with the recommended harmonized cut-offs (men ≥90 cm, women ≥80 cm). Unlike some studies that found BMI was not a reliable indicator of MetS in SA Americans( Reference Dudeja, Misra and Pandey 30 ), our study showed that either BMI (at 23·0 kg/m2) or WC (≥90 cm for men, ≥80 cm for women) can be used to determine the prevalence of MetS( Reference Misra, Pandey and Sinha 8 , Reference Misra, Misra and Wijesuriya 45 , Reference Chowdhury, Lantz and Sjostrom 47 ). However, the important caveat is the BMI cut-off value selected. Our results, and those of others, show that it may not be appropriate to use the BMI cut-offs developed for certain other groups (e.g. European Americans or African Americans) for SA Americans since SA seem to experience metabolic abnormalities at lower BMI and WC cut-off values( Reference Snehalatha, Viswanathan and Ramachandran 19 , Reference Lear, Toma and Birmingham 38 , Reference Jayasinghe and Jayasinghe 43 , Reference Chowdhury, Lantz and Sjostrom 47 ).
The suggestion to use different cut-off values is not new. Other studies have also called for lower BMI cut-offs( Reference Dudeja, Misra and Pandey 30 ). BMI cut-off values of 25·0 kg/m2 and 30·0 kg/m2, derived from European populations, are associated with increased co-morbidities in SA and are clearly too high to use. They underestimate the prevalence of MetS and obfuscate the large numbers of SA who evince metabolic abnormalities at theses higher BMI cut-offs. Some researchers( Reference Dudeja, Misra and Pandey 30 ) have called for an even lower BMI cut-off (21·0 kg/m2) for overweight in SA, but this suggestion has failed to gain consensus( Reference Vasudevan, Stotts and Mandayam 21 , Reference Misra, Misra and Wijesuriya 45 , Reference Misra, Wasir and Vikram 46 ).
Our sample shows that women had a higher prevalence of MetS (54 %) than men (47 %), a finding contrary to that of Flowers et al.( Reference Flowers, Molina and Mathur 23 ) who found that males had a higher prevalence using the same MetS criteria. Flowers et al. ascribed the sex differences to the protective effect of oestrogen( Reference Alberti, Zimmet and Shaw 10 ). There were no statistically significant differences in the mean WC measures of men and women in our study, but women had a greater prevalence of abnormal WC values and the association between abnormal WC values and sex was statistically significant (P<0·001).
Studies on SA in the USA have underestimated the prevalence of MetS. Two studies published in 2010 that used the National Cholesterol Education Program Adult Treatment Panel III (NCEP ATP III) definition of MetS in SA (which employs a BMI cut-off of >25·0 kg/m2) resulted in an underestimated prevalence in the subjects. The South Asian Health Center (SAHC)( Reference Flowers, Molina and Mathur 23 ) in California studied 1445 individuals (1012 men, 433 women) comprised of European and SA Americans, finding 27 % MetS prevalence using the NCEP definition. The birth country was India for majority of their participants (n 749), and the remaining were from Pakistan (n 9), Sri Lanka (n 5) and the USA (n 40). The participants were recruited through a non-profit organization, (SAHC) programme at El Camino Hospital( Reference Alberti, Eckel and Grundy 23 ).
Bengali males had the highest prevalence of MetS (50 %) in the present study. Meaningful comparisons for the disaggregated ethnicities in the Other SA male group may be difficult due to small sample size and also combining several ethnic groups together may not be prudent. The sample size was ninety-five subjects for 80 % power. Based on this we had power to discuss differences between Pakistani, Indian and Bengali, but not the individual ethnic differences in the aggregated ‘Other SA’ group.
Bengali males were significantly better educated than Pakistani males and they also had significantly lower average BMI (26·0 kg/m2) and WC values than Pakistani and Indian males. Bengali males clustered in the highest income bracket earning $US 45 000–60 000. Interestingly, Bengali males lived in the USA for the shortest time period, suggesting that they may still present disease patterns similar to those in their country of origin, where greater income may equate to money for more energy-dense foods. Cultural and dietary analysis may help account for these differences.
We studied the prevalence of one, two, three, four and five abnormal MetS indicators in the overall sample and by ethnic group. Low HDLC was the most prevalent abnormal indicator. The two most prevalent abnormal MetS indicators were low HDLC and high TAG (29 %), the three most prevalent abnormal indicators were low HDLC, high TAG and high fasting blood glucose (18 %), and the four most prevalent abnormal indicators were low HDLC, high TAG, high fasting blood glucose and high WC. Our findings were similar to those seen in other studies of SA( Reference Singh and Miller 3 , Reference Flowers, Molina and Mathur 23 , Reference Gupta, Doobay and Singh 48 ) and showed a greater clustering of abnormal lipid indicators. Other studies suggested a common patterning in SA with insulin resistance in addition to dyslipidaemia characterized by the presence of high TAG and small dense dysfunctional HDLC( Reference Dodani, Henkhaus and Wick 33 ).
Since metabolic abnormalities increase with age, we also analysed MetS across age groups and found that older males and females (≥60 years) had a greater prevalence of MetS (64 % and 82 %, respectively), compared with younger males and females (20–60 years; 50 % and 44 %, respectively). However, χ 2 analysis showed that the association of MetS with age group was statistically significant only for females (P<0·005). This result may suggest that obesity in elderly subjects (≥60 years) was a greater contributor to MetS in females compared with males. Similar results were obtained using a logistic regression model to determine the association between MetS based on age, years resident in the USA, education level, country of origin, minutes of exercise per day and income level. Only age was statistically significant for males (P<0·001) while age and minutes of exercise were significant for females (P<0·001). Education, years resident in the USA and country of origin were not associated with the probability of developing MetS.
Limitations of the present paper are several. First, most of the data were taken from clinic files and based largely on self-reported activity. The study was not representative of all SA ethnic groups, but only those who used the services of the two clinics. The sample sizes were not large enough to analyse smaller groupings of SA Americans, including Sri Lankans, Nepali, etc. The study relied on cross-sectional data and as such cannot show causality between MetS and abnormal MetS indicators. However, the study does suggest the hypothesis that a lower BMI value is needed for SA Americans, which was confirmatory to other studies of SA. Studies that lump SA together may actually obfuscate the real differences in MetS prevalence and causation that may exist among these ethnic groups. Although our sample was a convenience sample, it is one of the largest in number and most diverse in groups of SA studied in the USA.
Conclusion
The prevalence of MetS in a diverse group of low-income SA at two community health clinics was determined to be 51 % using the most recent consensus harmonized definition. The most accurate BMI cut-off value for detecting MetS that corresponds to the consensus harmonized definition is 23·0 kg/m2 in SA. Since many clinics which serve the SA community do not collect WC data, we recommend using BMI cut-off of 23·0 kg/m2 for future epidemiological studies of SA. SA in this sample also had a high prevalence of abnormal HDLC, TAG and blood glucose values. Data from Asian Indians cannot be generalized to all SA; SA are diverse and our data, as well as that those of others, suggest that Asian Indians have a distinct pattern of clustering of blood glucose and TAG. Moreover, Asian Indian females had the highest prevalence of MetS (62 %).
Acknowledgements
Acknowledgements: The authors wish to thank the two clinics in Maryland where data were collected. Financial support: This research received no specific grant from any funding agency in the public, commercial or not-for-profit sectors. Conflict of interest: None. Authorship: S.A.K. was the lead author who collected, interviewed, entered and analysed the data. R.T.J. provided detailed advice on all parts of the research including the statistics and analysis, and also reviewed and edited the final draft of the paper. Ethics of human subject participation: All patients gave informed consent before participation in the study. Study protocol was approved by the Institutional Review Board of University of Maryland and also by the review boards of the two community centres.


