


Introduction
The great advantage of military conscription records for social analysis is that they are intended to be universal. The records of a volunteer army, in contrast, are less universal, and less representative of the population, because some people enlist while others do not. This concern is particularly serious in anthropometric research because subsets of the population with different propensity to enlist may have quite different average stature (Bodenhorn et al. Reference Bodenhorn, Guinnane and Mroz2013, Reference Bodenhorn, Guinnane and Mroz2014, Reference Bodenhorn, Guinnane and Mroz2017). Therefore, many researchers prefer the records of conscripts to identify the biological standard of living of a population (e.g., Baten and Blum Reference Baten and Blum2012; Drukker and Tassenaar Reference Drukker, Tassenaar, Steckel and Floud1997; Floud et al. Reference Floud, Fogel, Harris and Hong2011: 226; Heyberger Reference Heyberger2007). Yet conscription records, notwithstanding their value, are not without problems and biases of their own. Conscription in many contexts is intended by the ruling class to provide the state with an army. Not surprisingly, the elite often created legal loopholes for itself through various possibilities to avoid service. More generally, it can be expected that some social groups were more motivated and more capable of evading the compulsory examination and enlistment than others.
This article will investigate the possible selection biases that historians encounter when working with heights of conscripts. Although the article is only concerned with the Netherlands in the second half of the nineteenth century, it is expected that our results are relevant for other (European) countries with conscription systems as well. Estimating the extent and direction of selection biases in conscript records will allow us to improve the relevance and quality of recorded heights as an indicator of the biological standard or living. Moreover, doing so will help us to better understand variation found in heights by social groups, religion, and family composition (e.g., Kok et al. Reference Kok, Beekink and Bijsterbosch2017; Mazzoni et al. Reference Mazzoni, Breschi, Manfredini, Pozzi and Ruiu2017; Öberg Reference Öberg2014).
Selection biases can have several different origins. First, conscripts were often measured around age 19 or 20. This already implies they are survivors of—possibly socially differentiated—infant and child mortality. The first step, therefore, is to understand selection caused by the process of attrition arising from infant and child mortality. Second, effective conscription presupposes a reasonably functioning bureaucratic apparatus. The population should be “legible” by the state (Scott Reference Scott1998). In the mid-nineteenth century, the “legibility” of the Dutch population was strongly enhanced by the introduction of the population registers (1849). Heads of households were obliged to declare all moves of (members of) their households, which were duly recorded in the registers. Still, mobile people, especially youths, were regularly missing in the system (Kok Reference Kok1997). The inefficiency of Dutch bureaucracy may have led to some of them being overlooked by the draft. Others may have been consciously evading the (compulsory and personal) registration. For instance, sons of notables may have counted on their father’s influence to bend the rules, or to buy them a replacement. Pacifists—although no longer officially recognized—may still have done their utmost to avoid the system. Third, after registration, boys were expected to partake in the lottery ceremony, followed by their height measurement. Again, different groups of boys may have had motives and opportunities to avoid this, even though social pressure to partake was strong, as we will discuss later. Fourth, we also find boys present at the lottery whose heights were not recorded. As they were not evading registration and examination, there must have been other reasons for not recording their heights, possibly reflecting other selection biases. Finally, we must be aware of regional differences in the interpretation of subscription laws (Komlos Reference Komlos1989; Van Roon Reference Van Roon1994: 78). In our analysis, we will use data from several Dutch provinces.
We base our analysis on a complete life course reconstruction of (a sample of) Dutch birth cohorts starting in 1850 called the Historical Sample of the Netherlands (HSN). The Dutch population registers made such a prospective approach possible. The registers recorded all moves within the Netherlands, and the sampled research persons could thus be traced across the country. Linking the database to militia records allows us to determine the likelihood that one’s height was recorded, depending on period, region, family characteristics (including SES), religion, and migration.
First, we give an overview of the conscription system as it existed in the Netherlands, and with some variations, in several European countries. Then, we formulate hypotheses regarding the possible selection biases occurring in each step of the conscription process. After the discussion of our data, we then discuss attrition due to mortality and migration. Subsequently, we use logistic regression to determine the relative chances of being recorded at all, and of having one’s height registered. In the concluding section, we discuss to what extent selection biases complicate the use of (Dutch) conscript records.
Conscription Practices
Already in the eighteenth century, countries like the Habsburg Empire (Komlos Reference Komlos1989) and France (Osman Reference Osman2010) had a conscription system. Since the Napoleonic wars, conscription spread all over the new nation-states of Europe. Often they modeled their conscription system after the French (e.g., Alter et al. Reference Alter, Neven and Oris2004: 23; Grab Reference Grab1995: 29). This implies that several countries shared the same basic principles and thus potentially the same types of selection biases. In the Netherlands, conscription was introduced during the Napoleonic period as well, and the young kingdom decided to keep the system afterward.
The Dutch draft was determined by a lottery system. All adolescent boys who reached conscription age were to be registered on an enrollment list in the municipality in which their parents resided in January in the year before they were subject to conscription (Koerhuis and Van Mulken Reference Koerhuis and van Mulken1986; “Wet op de nationale militie 1861,” National Militia Act 1861, s18). This list was checked by the local authorities, put in alphabetical order, and put on display for all citizens to check (National Militia Act 1861, s21, 26). Boys and their parents were responsible for registering and those who failed to do so and were discovered were automatically selected for military service (ibid., s163). On the day of the lottery, all conscripts had to report and had to undergo an inspection (ibid., s34). The results were written down in the conscription records, which were a copy of the two lists mentioned previously, but now containing—next to occupation—the heights that are vital to anthropometric history. If the conscript was not able to make it on the day of the lottery, the parents or the mayor were permitted to stand in for the conscript and draw the lot for him (ibid., s33).
Absenteeism (with did not bring exemption) could have different causes. Boys could be simply away for work. Tassenaar (Reference Tassenaar2000) found 5 percent absent in rural Drenthe (eastern Netherlands), but some municipalities scored more than 20 percent due to locally high numbers of bargemen. The Dutch average was 15 percent (Van Zanden et al. Reference Van Zanden and Mandemakers1990: 7). These rates are in line with other European countries like France and Italy (Bassino and Dormois Reference Bassino and Dormois2009). Absenteeism can cause biases because of height differences between sedentary and traveling workers, as well as between migrants and nonmigrants. French regions with more emigrants stood out with higher rates of absenteeism (A’Hearn et al. Reference A’Hearn, Peracchi and Vecchi2009). In some studies, migrants have been known to be healthier (e.g., Puschmann et al. Reference Puschmann, Donrovich and Matthijs2017) as well as taller (e.g., Spitzer and Zimran Reference Spitzer and Zimran2018).
Another reason for being absent might be the option to hire a substitute. In most countries there was a system of paying for substitutes, such as in Italy (A’Hearn Reference A’Hearn2003), the Kingdom of Bavaria (Baten Reference Baten2009), France, and the Netherlands (National Militia Act 1861, s60, 70). This was an easy, yet expensive way to avoid service. De Meere (Reference De Meere1982: 98) claimed that those who had themselves replaced were almost always absent at the examination and that—because of the large sum of money involved—this implies that elite were underrecorded. However, several studies have claimed that insurance made it possible for recruits from all layers of society to have themselves replaced (Brinkman et al. Reference Brinkman, Drukker and Slot1988; Van Roon Reference Van Roon1994). These claims are supported by the fact that when the replacement system was abolished in 1898 no effect on the mean height was visible. Also, it made sense that boys who aimed at replacement still partook in the lottery, as they still had a (good) chance of drawing a high number, thus sparing their parents the costs of a substitute.
Conscripts could also be exempted for medical reasons, so recruits often pointed out their ailments to convince to doctors present that they should be send home. In the records we find “sore limbs” and “heavy headaches,” but also “smelly feet” and “baldness” given as reasons. There were regional differences in who was checked medically. In the province of Noord-Brabant everyone was checked, whereas in other provinces only those who claimed to be unfit were examined (Van Roon Reference Van Roon1994: 78). Remarkably, even the obviously unfit who would clearly be exempted showed up, which was not the case in Sweden (Öberg Reference Öberg2014). However, the key question is whether their heights were recorded in the end. Height was also used as a physical description in case of desertion or to refute claims of those who accused others of being incorrectly exempted because of their height. This was not needed for those exempted for medical reasons, so possibly registration of heights was omitted when, other than being too short, reasons for exemption were evident.
In most countries, there was a minimum height requirement and often the heights of those who did not reach the minimum were not recorded (see e.g., Jacobs et al. Reference Jacobs, Katzur and Tassenaar2008 for the resulting truncation problem). In the Netherlands all heights were registered, but we will explore if this was done consistently in case the reason for exemption was given as being too short. This investigation makes it also possible to test if height distributions were more left-skewed in the nineteenth century because of living conditions, or because of a selection biases (Staub et al. Reference Staub, Floris, Woitek and Rühli2015). This is important because skewedness of the distribution is often used to test for selection biases. In the Netherlands, the minimum height was lowered in 1862 from 157 to 155 centimeters (National Militia Act 1861, s47). This was done because the number of undersized conscripts rose from the 1840s onward. Conscripts were also measured a year later to make an extra year of growth possible (ibid., s8). In this article, we will not go into the bias caused by (differential) catch-up growth after conscription. To avoid problems by the aforementioned change in the law, we selected the birth year of 1850 as our starting point.
In the conscription law of 1817, conscripts who were the only son and on whom the family depended for their income were exempted. This exception was to make sure that conscription would not result in extreme poverty. This was also the case in Italy and the Habsburg Empire. In 1862, the law was changed, and all only sons were exempted (ibid., s47). Besides that, brothers could be exempted (ibid., s48–49), which was also the rule in Belgium (Alter et al. Reference Alter, Neven and Oris2004). In the Netherlands, there was a complex system to determine whether a brother had to serve. Boys of an even birth order (second, fourth, etc.) were exempted from conscription. In case of an uneven total number of brothers, only the smaller half of the number of brothers had to serve, which resulted in the brother born last in line to be exempted as well. The system became even more complicated when the oldest brother was exempted. The second brother could not apply for the brother rule anymore, but the third brother could. Therefore, the whole counting systems shifted from even to uneven birth order. When the second brother was exempted as well, the same rule applied and so on. This rule might pose an analytical problem because in studies of the impact of household composition on heights, sibship size, and birth order are often used as variables (Hatton and Martin Reference Hatton and Martin2010; Öberg Reference Öberg2014). Boys born last in the line and probably from somewhat larger families might be missing more often. As these boys are sometimes found to have a smaller stature (due to resource dilution, e.g., Hatton Reference Hatton2017; Stradford et al. Reference Stradford, van Poppel and Lumey2017) a bias toward taller sons may occur. However, the militia commissioner might be inclined to omit the heights of only sons because they were to be exempted anyway.
In this complex conscription system, there were even more ways to avoid service. There were exemptions for those who were already serving in the army (National Militia Act 1861, s47), those who were studying theology (only for one year, with possible extension [ibid., s127]), and those who were incarcerated (ibid., s55). In other countries as well, particular groups were exempt. In the Habsburg Empire, some professions requiring a great deal of skill were spared (Komlos Reference Komlos1989). For the Netherlands, it was found that most of those already serving as professionals in the military were not present during the examination (Drukker et al. Reference Drukker, Brinkman and van Meerten1991). Although they account for a small proportion, these groups all have their own characteristics that might influence the aggregated results.
Hypotheses
The conscription system was constructed in such a way that we can expect some selection biases, although to some extent they may cancel each other out. To estimate the direction and impact of these biases we formulate a number of hypotheses, which can be found in figure 1. Here we depict the selection process as it was described in the militia law of 1861. Before conscription there are already two hypothesized selection mechanisms at work. The first one is mortality. We expect that mortality was higher in the lower socioeconomic strata of society resulting in the poorest (and shortest) boys to die before they could be measured. The second mechanism is selective migration. Understandably, farmers and their sons tended to remain in their locality and its vicinity. Lower and unskilled workers, especially farm hands, tended to move frequently, but generally within a circumscribed area (Kok Reference Kok1997, Reference Kok2004). Frequent moves might have led to bureaucratic problems in tracing their whereabouts. However, long-distance migrations were more likely to cause such an effect. Skilled workers, white collar workers, and elite were more likely than others to move over large distances or to emigrate. Our second hypothesis therefore states that conscripts from relatively high social classes tend to “escape” registration due to long-distance migration.

Figure 1. Factors potentially causing selection in each administrative step leading to a recorded height.
In the enrollment process, we expect that nepotism (hypothesized selection mechanism 3 in figure 1) made it easier for elite sons to escape the records altogether because the system was controlled by social peers. Evading conscription was not a joke at the government’s expense. If one boy was able to avoid service in the army, or was rejected for one reason or other, that meant that another one was designated. The examination commission was flooded with letters decrying the exemption of a particular boy and denouncing him as having misled the doctors (Van Roon Reference Van Roon1994: 93). There are even reports of families migrating from areas with many (professional) exemptions to have a better chance in another municipality (ibid.: 87). It is to be expected that the social control on the conscription procedure was more intense in smaller municipalities (hypothesis 4).
Some groups may have been particularly motivated to avoid enlistment (hypothesis 5). Since 1861, only sons no longer needed to prove that the family depended on them. But the temporary loss of child’s work or salary still remained a large problem, especially for widows, and the examination commission kept receiving letters from widows pleading for the exemption of a son (ibid.: 84). We surmise that sons from widows or widowers were absent in the registration more often than others. Jews, Mennonites, and Moravians had been exempted from military duties until 1810, and the loss of this privilege, as well the pacifist persuasions of the latter two groups may still have incited them to avoid military service. The Moravians were a very tiny group and are not represented in the HSN, but we can check whether Jews and Mennonites managed to avoid the registration and lottery. In the second half of the nineteenth century, especially from the 1870s onward, neo-Calvinists became increasingly vocal and seceded from the mainstream Dutch Reformed Church in 1886 to form their own church. They also had their own political party, university, newspaper, youth organizations, and so on. In their efforts to protect their youths against sinful, “worldly” influences, they railed against army culture, especially the common usage of cursing and sexual innuendo in drilling practices (Van Ginneken Reference Van Ginneken1914). During the Dutch Republic, Roman Catholics were not allowed to take up official positions. In the nineteenth century they still, to some extent, equated the army with the dominant Protestants, although they had been “emancipated” in 1813. Thus, we expect that neo-Calvinist and Roman Catholics tried to evade conscription more than others.
On the day of the lottery, most conscripts wanted to draft their own number, apparently because of superstitious beliefs. Because it was allowed to have one’s parents or the mayor to stand in, we expect (hypothesis 6) a higher percentage absent among sailors (who tended to be short), migrants (presumably taller in the case of long-distance migrants), and those who had themselves replaced (probably also taller). We also suspect that heights were often not written down when a flagrant reason for exemption existed (hypothesis 7). Administrative practices regarding this, however, may differ across regions (hypothesis 8). There may also have been regional variation in reasons to be exempted or the ease of avoiding conscription.
Our last hypothesis (9) in figure 1 again deals with migrants. Those who skipped the lottery might have done that on purpose because they could be examined nearby if they requested that, which could have saved them a great deal of time.
Data and Method
This article is based on the 2010 release of reconstructed life courses of persons born between 1850 and 1922 from the HSN (Mandemakers Reference Mandemakers, Kelly Hall, McCaa and Thorvaldsen2000, release 2010.01), based on the original sample of birth certificates in the Netherlands. Until 1872 it is a 0.75 percent sample and from 1873 until 1922 it is a 0.5 percent sample of births. A random selection of 60 percent of research persons found in birth certificates was tracked in the population registers that were established in the entire Netherlands in 1850. These registers provide details of the household composition and all its changes over time, including out-migration (with destination) of the research persons. This makes it possible to reconstruct the life course of the research persons in the context of their families on a daily basis.
The research persons were subsequently looked up in the conscription records that can be found in the provincial archives. We applied a set of criteria to make sure that we had the best data set to test our hypotheses. Our steps are shown in table 1. To begin with, we only selected boys, for the simple reason that girls were not subject to conscription. We narrowed our research period to the birth years 1850 through 1890. This was done for several reasons: to make sure that we had register data, we did not encounter any problem with privacy regulations, we had complete conscription records, and our outcomes were not affected by World War I. Then, we selected five provinces representing different parts of the Netherlands. From the north we chose the province of Friesland, which has a modern, market-oriented agricultural economy. From the west we have Noord-Holland, which is similar to Friesland but includes the large city of Amsterdam. From the east we have the province of Overijssel, which was far more traditional in its agricultural economy although some factories were established in the cities. In this area we also find a sizeable number of stem family households (Bras et al. Reference Bras, Kok and Mandemakers2010). We selected the southern province of Limburg, which had a traditional rural economy as well, but also a high percentage of Roman Catholics compared to other provinces that had a Protestant majority. Finally, we included the province of Utrecht as a reference category.
Table 1. Selection of the data

Sources (linked): Historical Sample of the Netherlands (HSN). Data set life courses. Release 2010.01. HSN certificates release 2018.01.Beta.GIANTS. GIANTS Heights HSN Research Persons release 2017_01.Beta.
* 282 records are not yet part of the release.
For this article we ended up with 4,436 research persons for whom we tried to find out if there was a selection bias in relation to the conscription records. First, we look for two obvious reasons explaining why the research person was not found in the records: early death and (parental) migration out of the region. Did this attrition alter the distribution of heights in such a way that it cannot be taken to represent an entire birth cohort? To uncover systematic patterns, we conducted a logistic regression, but this was only possible for those who died as there were few out-migrants. We extracted the occupational status from the father from the birth certificate and recoded that according to the HISCLASS scheme (Van Leeuwen and Maas Reference Van Leeuwen and Maas2011). Religion is recorded in the population registers and we apply the categorization of different Dutch Protestant denominations in Liberal and Orthodox, as proposed by Kok (Reference Kok2017).
We applied logistic regression to see if the 2,801 research persons that should be in the conscription records are in fact found. From this group, we could not trace 299 persons. Out of the remaining 2,502 we found 311 boys without recorded heights. For each regression we discuss in the following text, we only used that group that made it to the next step. Thus, each subsequent iteration of the regression was conducted on a smaller data set. The number and characteristics of these data sets can be found in table 1.
For those boys who lived until the age of conscription, we included the family size (number of siblings) and birth order of surviving brothers because that may have influenced the outcomes. We have to take into account that there might be an underestimation of the number of siblings in the HSN (Van den Berg et al. Reference Van den Berg, van Dijk, Mourits, Slagboom, Janssens and Mandemakers2018). Because the observation starts at birth of the research person and ends after he left his parental household, some siblings may go unnoticed. Because we are only interested in brothers that survive at least 20 years, we do not expect severe problems. Moreover, we include whether the recruit indicated that he should be exempted because of brothers already serving. In this way, we are able to overcome a possible selection problem of the HSN. We also add variables considering if the recruit had a replacement and if he indicated any other reason to be exempted. On the basis of all these regressions we can determine possible selection biases along every step of the recruitment process.
Mortality and Migration
To be measured, boys first had to reach the age at which they were subject to conscription. As we have seen in table 1, more than one third of the boys died, with infant mortality as the most important cause, as 58 percent of the deaths occurred during the first year and another 14 percent in the second year of life. To what extent does early death in this period lead to a selection bias? Death seems to be equal for everyone, but infant mortality was somewhat higher in the lower social strata, especially among unskilled and casual workers (Van Poppel et al. Reference Van Poppel, Jonker and Mandemakers2005). This pattern is also visible in our data (see table 2), although with borderline significance. Clearly, the province of Friesland was an auspicious area in which to be born. An earlier study explained this from prolonged breastfeeding and relatively good sanitary conditions in this province (ibid.: 306). In this period, growing up in cities was decidedly unhealthy. For religion we did not find any truly significant effect, apart from a suggestion of lower mortality amongst Jews and orthodox Protestants. As expected, toward the end of our period, mortality rates were decreasing.
Table 2. Logistic regression of dying before the age of conscription, five Dutch provinces, 1850–90
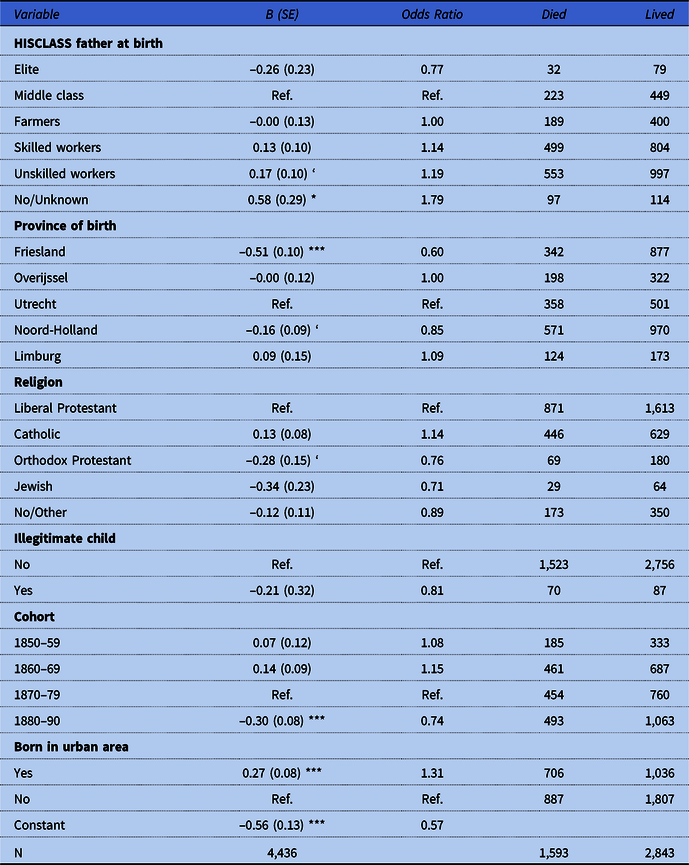
Sources (linked): Historical Sample of the Netherlands (HSN). Data set life courses. Release 2010.01. HSN certificates release 2018.01.Beta.GIANTS. GIANTS Heights HSN Research Persons release 2017_01.Beta.
0 = Lived and 1 = Died. So a higher odds ratio means a higher risk of dying before conscription.
Significance levels: *** 0.001; ** 0.01; * 0.05; ’ 0.1.
The findings in table 2 show that we need to be careful, but do they point at a serious selection bias? Death may take out the weakest, and therefore potentially the shortest, members of a cohort. But mortality levels also reflect general living conditions and the prevalence of diseases. Therefore, it is not surprising that we find a negative correlation between mortality (between 0 and 19) and aggregate heights. An OLS regression (results not shown in the table, but available on request) on yearly aggregate heights per year shows that a 10 percent rise in mortality led to a 1 centimeter decrease in average heights (p-value = 0.03). We also found that a drop in survival rates of 10 percent increased the standard deviation with 5 millimeters (p-value = 0.06). Although this might be the result of chance, it indicates that death did not affect everybody’s heights. When mortality went up, average height went down and the distribution shape stayed the same (we did not find a significant change in the difference between mean and median), so the higher standard deviation indicates a higher variation in heights. Therefore, when average heights dropped this might indicate that some of the taller people remained tall resulting in a higher standard deviation.
To investigate social-class differentials in mortality and their potential effects on the heights distribution more closely, we split the survival rate and aggregated mean heights for social class (by contrasting the first and last three groups in table 2). We see that for the well-to-do, epidemic years around the time of birth mattered for heights (odds ratio = 1.18 p = 0.03). For this group, the percentage of survivors was the lowest in years with epidemic outbreaks (1866–67, 1875, and 1880, based on the newspaper database and n-gram viewer of the Royal Dutch Library [Koninklijke bibliotheek, Delpher 2018; De Goede et al. Reference De Goede, van Wees and Marx2013]). We also explore the magnitude of the effect in a linear regression controlling for the average amount of available calories per person in the year of birth (Knibbe Reference Knibbe2007). We find that mortality was 10 percent higher in epidemic years for this elite group (p = 0.00). However, when we conduct the same regression but now using aggregated heights as the dependent variable, we do not find such an effect of epidemic years for the elite (p = 0.82). This implies that epidemic years influenced the survival chances of the elite, but not their statures. Apparently, wealthier people could, if they survived, recover from a crisis later on and still reach a large part of their potential heights. We test that assumption in a linear regression as well with heights as a dependent variable and mortality rates as an independent variable and find no relation (p = 0.99).
The less fortunate did not have the possibly to recover later. Their mortality rate (p = 0.09) and aggregated heights (p = 0.00) were both influenced by the available number of calories, which was not the case for the elite group. Furthermore, epidemic years had an impact on the heights of the poor. We find that a 10 percent rise in mortality rates leads to a 1 centimeter decrease in average heights (p-value = 0.02) for this group. Therefore, we conclude that the effect of epidemic years and the available amount of food resulted in different effects for survival and heights for different socioeconomic groups. When an epidemic crisis is studied, death might be somewhat more equal to everyone compared to heights (analysis not shown here, available upon request as well).
As mentioned in the preceding text, out-migration was a potential problem with regard to absenteeism and the recording of heights. The law, however, was strict: even conscripts living abroad needed to report for service (National Militia Act 1861, s16–18), although it is unlikely that those who lived in farther-flung places like America returned for the occasion. Emigration of families was quite rare—out of more than 30,000 observed rural household heads (age 25–40), only 0.3 percent emigrated (Kok et al. Reference Kok, Mandemakers and Mönkediek2014: 32). Therefore, we will focus on those whose parents moved out of our research area as a proxy for long-distance migration. Family migration over longer distances was often for career purposes and, therefore, socially selective (Kok 2004). In our sample, there are only 42 research persons whose parents settled in another region in the Netherlands. Because this number is too low to conduct a useful logistic regression, we only looked at those numbers that stand out. On average only 1 percent of parents migrated, but we found two groups with a higher number. Within the elite group, 4 percent migrated and within the illegitimate children group 9 percent of the parents (probably single mothers) migrated. Obviously, these numbers are too small to affect height outcomes.
Evading the Conscript Records
Although the conscription system was designed in such a way that all boys had to register, 1 out of every 10 boys was not found in the enrollment list or conscription records. Many things can go wrong when searching for individuals in archives, but that would not necessarily result in a selection bias. We suspect that there are other reasons (see figure 1) why these research persons were not traced. The results of our logistic regression on the likelihood of being recorded are displayed in table 3.
Table 3. Likelihood of being registered in the conscription records, in five Dutch provinces, 1850–90
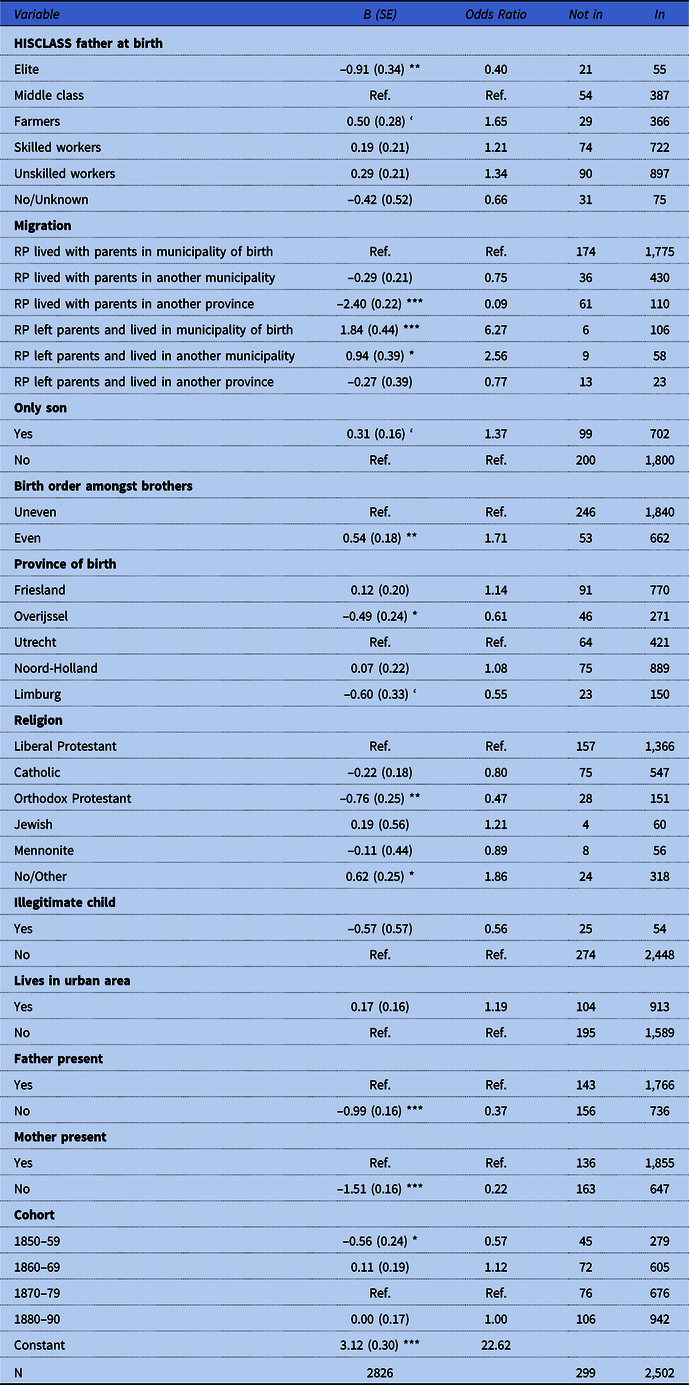
Sources (linked): Historical Sample of the Netherlands (HSN). Data set life courses. Release 2010.01. HSN certificates release 2018.01.Beta.GIANTS. GIANTS Heights HSN Research Persons release 2017_01.Beta.
0 = Not in conscription records and 1 = found in conscription records. So a higher odds ratio means a higher change of finding the conscript in the records.
Significance level: *** 0.001; ** 0.01; * 0.05; ’ 0.1.
Although it should not be possible under a system of perfect population administration, moving to another province—but still within the region in which we have used the archives—made it easier to avoid service. The Dutch system worked in such a way that conscripts, or their parents, had to make sure that they were registered for conscription. The list was checked by the local authorities and boys missing from the list were enlisted in the national militia right away. Apparently, moving to another province made it harder for the municipalities to check if the lists were complete. In addition, we find strong differences in avoidance by social class, which is clearly not caused by selective long-distance migration, as we control for that. Elite sons had lower odds than sons from middle-class fathers (the reference category) to end up in the records (also Rutten Reference Rutten1995: 142), whereas farmers had a higher chance to be recorded. This was not caused by more intense social control in rural communities, as we found that living in an urban area increased the odds ratios of being registered (+31 percent). Remarkably, boys not living with their parents were more likely to be recorded than boys who were (at least according to our reconstruction) still at home. Again, this may point at a social gradient—boys of 18 or 19 not living at home were generally working as servants and farmhands, and predominantly came from the lower classes (Kok Reference Kok1997).
Contrary to our expectations, only sons and brothers from an even birth order (a sound reason for exemption) tended to be recorded more often. So, it is not true that they could avoid conscription more easily because they would be exempted anyway. However, sons of widowed parents did manage to avoid registration, even though they did not have a legal reason to be exempted. Perhaps the authorities turned a blind eye in their cases.
As for religious motives to avoid enlistment, the signs of Mennonites, Jews, Roman Catholics, and Orthodox Protestants (many of them neo-Calvinists) are all in the expected direction, but hardly significant. It is unclear why nondenominationals and “others” (e.g., Anglicans) had a higher likelihood of being recorded—as having no religion was often indicative of socialist and antigovernment leanings.
To ensure that our findings are “real” historical selection biases and not flaws in our database construction we need to look at province and cohort variables. Three different search strategies were applied to find the research persons. For the province of Overijssel, research persons were looked up by printing out a list with their names, names of their parents, a birth date and location, and possible places to find the conscript and then they were searched in the conscription records by hand. In Limburg the same procedure was followed although here all conscripts were already listed in an alphabetical catalogue making it easier to find them. The conscript records of Friesland, Utrecht, and Noord-Holland were indexed and digitized by a crowd sourcing project (“Vele Handen,” https://velehanden.nl). The HSN was linked to the index using a maximal Levenshtein 3 difference (Levenshtein Reference Levenshtein1966) in first and last names. Also, the date of birth had to match. As the regression shows, the computer did a better job than the humans in the archives. It is important to note that this has nothing to do with the preservation of the records, which was accounted for in the selection of our research period and area. In the end, we did not discover any regional differences in absenteeism as was found for, for example, France or the Habsburg Empire. We can only conclude that in Friesland, Utrecht, and Noord-Holland, based on the same search method, no significant differences were found between the records.
The other variable to check is the effect of birth cohort. It is clear that boys born in 1850–60 were underrecorded relative to younger cohorts. This is probably related to the much more efficient organization of the population registers in the 1860s. Before the Royal Decree (November 1861) reorganizing the system, the population registers were maintained as part of the civil registry by officials also responsible for the registers of birth, marriage, and death. More importantly, the population was listed on a de jure basis, which means that people may have moved elsewhere, but were still recorded in their legal domicile. After 1861, this changed to registering the de facto population. Population registers fell directly under the responsibility of the municipalities, leading to the appointment of many new officials. Last but not least, declaring changes to the household became compulsory for the population (Vulsma Reference Vulsma2002: 111).
Height Recording
In principle, Dutch conscription records are very useful for anthropometric history, as all heights were recorded even of those clearly too short to be drafted. This has to do with the fact that the Dutch conscription was based on a lottery. Part of the conscripts were exempted because they drew a high number, but if any of the lower numbers was exempted because of his height, the conscript with the next number in line had to serve. To avoid complaints by disappointed draftees and their parents, heights of undersized boys were written down as well, and that is why the odds ratio in table 4 points in that direction.
Table 4. Likelihood of the height being registered in the conscription records, in five Dutch provinces, 1850–90
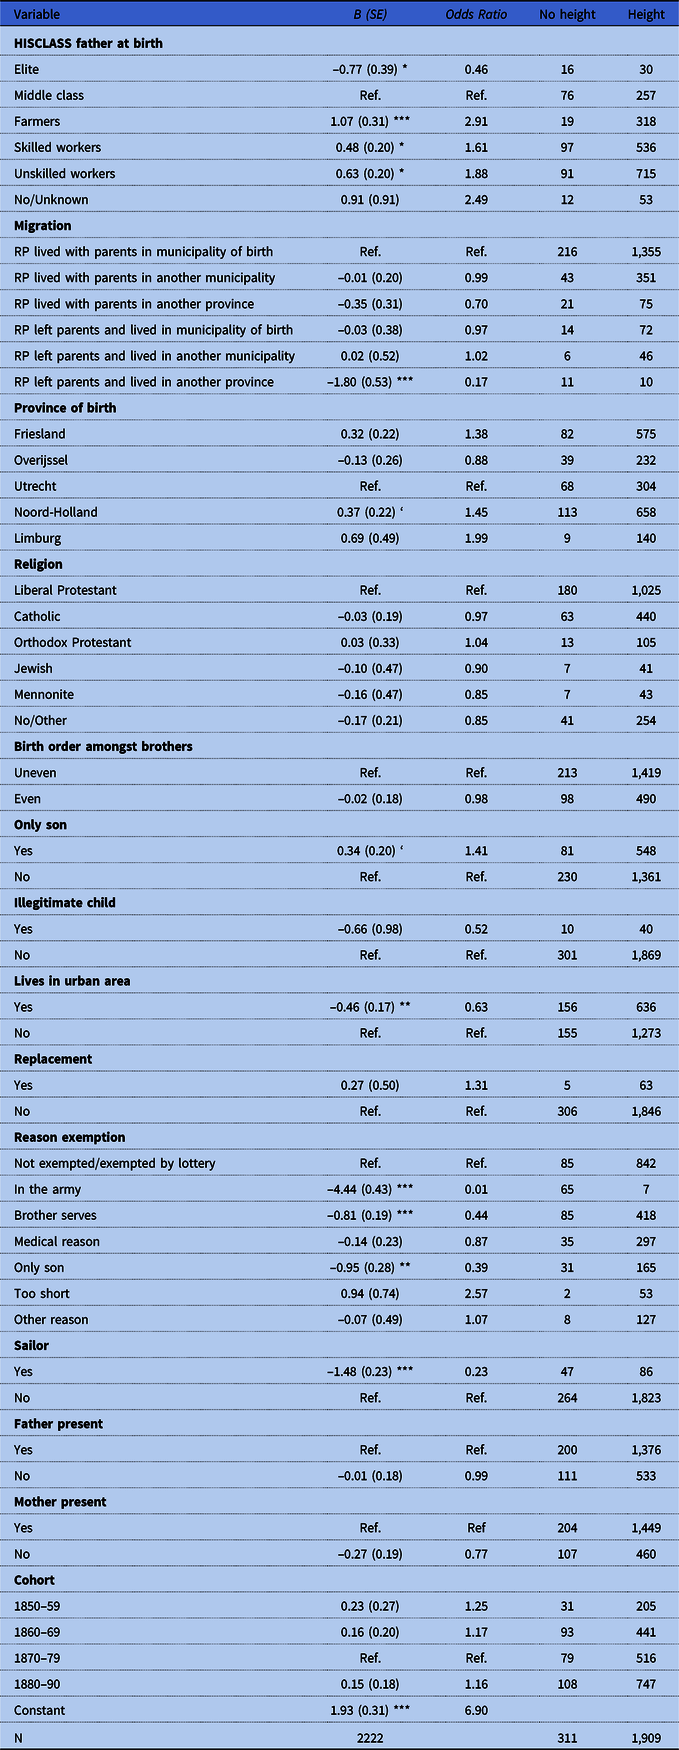
Sources (linked): Historical Sample of the Netherlands (HSN). Data set life courses. Release 2010.01. HSN certificates release 2018.01.Beta.GIANTS. GIANTS Heights HSN Research Persons release 2017_01.Beta.
0 = Height not in conscription records and 1 = height found in conscription records. So a higher odds ratio means a higher change of finding the height in the records.
Significance levels: *** 0.001; ** 0.01; * 0.05; ’ 0.1.
The other reasons to be exempted increased the risk that no height was found in the records, but only three are statistically significant. Those who had already volunteered for the army were exempted and also did not have their heights registered. This reason has already been studied before (Drukker et al. Reference Drukker, Brinkman and van Meerten1991) and it was estimated to have resulted in a maximum change of 3 millimeters in mean heights. Boys already serving were, of course, taller than the required minimum height, but they were not the tallest because they typically did not come from the elite or farmer classes, which are often found as the tallest social economic strata (e.g., Alter and Oris Reference Alter and Oris2008; Beekink and Kok Reference Beekink and Kok2017).
Next to those already enlisted, boys who were of an even birth order and had their brothers of an uneven birth order serving as a conscript were exempted, as were those who were the only son. Both reasons appear to cause nonregistration of heights. This is important when family composition is studied in relation to height because those last in the birth order are more often missing in the data.
That a reason to be exempted had an effect on underregistration of stature is not so surprising, but socioeconomic class had such an effect as well. It is often mentioned that this has to do with the replacement system, but we did not find a relation. In the Netherlands, there were insurance companies providing the funding for a replacement (Van Roon Reference Van Roon1994) and all social strata seemed to have made use of this option. Still the elite might have approached the lottery (having a replacement at hand) differently because they probably would not be too short whereas for other social strata this could also be a reason for exemption. So, the elite did not have a strong incentive to be present, but when we tested for an interaction effect between social economic status and replacement we found no significant effect.
Thus, the most likely explanation is that the elite had the social capital to avoid service in this step as well and therefore have their heights missing. In other words, there was corruption in the conscription system, which caused a selection bias in heights. From the remaining elite group of 46 conscripts, 10 (22 percent) avoided service because of a medical reason and 14 (30 percent) because of a serving brother. Only seven (15 percent) conscripts ended up serving in the national militia. If we look at those numbers for the unskilled workers, 57 (7 percent) claimed to be medically unfit and 176 (22 percent) had a serving brother. From this group, 232 (29 percent) were drafted in the end. It is unlikely that unskilled workers were healthier than the elite, it is more likely that friendly doctors (also in the elite group) were willing to file a reason for exemption. Occasionally, doctors were sued for helping the conscripts (Van Roon Reference Van Roon1994: 92). We also tried to test for this in a logistic regression with exempted and designated as dependent variable (results not in the table). The odds ratio was 0.70 for the elite but this was not significant, so we cannot statistically confirm this hypothesis.
The Combined Probability of Height Recording
In the previous analyses, we have conducted separate regressions for every step toward conscription, but it is the overall probability of having one´s height recorded that is interesting as well. Therefore, we also conducted a logistic regression to study the likelihood of a height being recorded, using all our 4,436 research persons as the population at risk. The results can be found in table 5. We could not include all variables used in the models from table 3 and 4 because we had no such information for the research persons who died before they reached their conscription age. Table 5 shows that from the 4,436 births used in this study only 1,909 heights are recorded during conscription. It cannot be taken for granted that a height is found in conscription records just because a person was born. Therefore, the major point that should be made when conscription data are used is that they do not contain all heights of a birth cohort.
Table 5. Logistic regression of the overall probability of the height being registered in the conscription records, in five Dutch provinces, 1850–90

Sources (linked): Historical Sample of the Netherlands (HSN). Data set life courses. Release 2010.01. HSN certificates release 2018.01.Beta.GIANTS. GIANTS Heights HSN Research Persons release 2017_01.Beta.
0 = No height and 1 = Height. so a higher odds ratio means a higher risk of the height of the research person being registered. Significance levels: *** 0.001; ** 0.01; * 0.05; ’ 0.1.
The majority of missing heights result from death before conscription (Died in table 2/No height in table 5 * 100% = 63%). Only in the elite group and for the Orthodox Protestants, death was not the major reason for a missing height. These numbers in table 5 do not only reflect the mortality rates for each group but also the will to evade conscription. Therefore, the results in tables 2, 3, and 4 show us that these two groups combined low mortality with a strong will to escape conscription. The only difference is that the elite also did not have their heights recorded in table 4 whereas the Orthodox Protestants did not report a significant effect.
From the percentages and the effects in table 5, we can derive the conclusion that the socioeconomic background has an important role in the likelihood of height registration. Compared to the other groups, the middle classes are missing relatively often and the elite to an even larger extent. Farmers, however, have a higher probability to have their heights recorded. From the share of research persons from which the stature is recorded, we know that these groups are relatively tall. Therefore, the contrasting odds ratios might cancel each other out when it comes to height on an aggregated level. However, we cannot know if there are any unobservable factors that bias the height of these particular groups in any direction. We can only establish that the mortality rates in table 2 did not differ significantly between these groups. Still the role mortality plays in the number of heights that were not found differs strongly.
The province of Friesland shows that a low number in the last column does not coincide with a higher likelihood of missing heights. Mortality rates were low for this province, but there were still a great deal of boys who did not have their heights recorded. Overall the result was still positive in comparison to Utrecht (our reference group), and Friesland reported the highest likelihood to have the heights recorded. Conscripts from Friesland were relatively tall, but this effect might be averaged out: for instance, boys from Limburg were relatively short in this period and were also registered more frequently than those from Utrecht.
Overall, religion seems to have played a minor part in determining whether or not heights were registered. The share of boys who died early is completely different for the denominations, but overall these effects did not prove to be significant. Illegitimacy also had no significant effect. There was no linear time trend in the cohorts, but the cohort used as reference (1870–79) resulted in the most recorded heights. The urban effect was significantly negative. This is not only caused with higher mortality in the cities as the share of death was almost similar to that of the rural areas.
The final question is whether the uncovered selection biases affected aggregate heights. Although the odds and logit parameters of the different variables seem to be quite large, their effects on height at an aggregated level is ultimately quite small. In our current data set the difference between the mean height (168.41 centimeters) and the median height (168.59 centimeters) is only 1.8 millimeter. This indicates that the distribution is almost normal, although slightly skewed to the left.
We can use the numbers from table 5 to study the impact of socioeconomic status on heights at an aggregated level. For each group, we used the number of research persons we set out with to get the distribution at birth. Based on these numbers, we calculated a weighted average height. We used the average heights per group under the assumption that there were no unobservable biases resulting in a higher of lower mean for the unrecorded group. This resulted in a mean height of 168.47 centimeters and a median height of 168.59 centimeters. This reduced the gap to only 1.2 millimeter, with the median height remaining constant. Still these numbers show that the effect of the selection biases on the aggregated data are very small.
Conclusion
We have formulated a number of hypotheses on reasons for lacking registration and measurement in the Dutch conscript system. We found that mortality was marginally higher for the lower socioeconomic classes when controlling for religion, province, cohort, and urban birth location. For migration this was the other way around, although the numbers were too low to have a real impact. When we look into our hypotheses on less obvious explanations for not being recorded and measured, we found that nepotism probably resulted in a lower share of elite in the final height data set. For other social groups, lack of social surveillance might have helped evading the system, but contrary to what we expected, more boys were “found” in urban areas. Possibly, the community was not so hard on those who lost a parent because this unofficial reason resulted in a lower number of conscripts recorded. Religious motives to avoid conscription did not have significant effects. Absenteeism proved a problem as was expected with high absent rates for sailors and migrants. Also, migrants had lower odds ratios as we anticipated. We did not find very large differences between the regions, certainly not in such a way that we think the law was interpreted differently resulting in a selection bias.
Our results show there is limited reason to question the quality of Dutch conscript records. The little amount of skewedness in historical height distributions is mostly caused by historical living conditions causing selection in life, not in the records. Studies looking for familial, social, and cultural variation in heights, however, need to take account of the differences between various social groups in being recorded and being measured.
To conclude, we were able to show a number of selection biases present in the conscription records. Historians should be aware of them when working with these records and they have to make sure that they know how the system worked. This is especially important when specific regions or social groups are studied. But as we showed, when the numbers are high enough the combined selection biases influence the distribution by only a couple of millimeters. Because height is often studied to examine the change of the biological standard of living of cohorts over a long time such a small difference is not problematic.
Acknowledgments
Funding received from the Netherlands Organisation for Scientific Research (NWO), Giants of the modern world project, 360-53-190.


 Open access