


The metabolic syndrome (MetS) is a metabolic disorder involving abdominal obesity, dyslipidaemia, elevated blood pressure and insulin resistance, all of which increase the risk of CVD and type 2 diabetes( Reference Lutsey, Steffen and Stevens 1 ). The prevalence of the MetS is rapidly increasing worldwide( Reference Mozumdar and Liguori 2 , Reference Nestel, Lyu and Low 3 ). It is estimated that 20–25 % of the world’s adult population has the MetS( Reference Kaduka, Kombe and Kenya 4 ).
Diet plays an important role in the development of the MetS( Reference Chung, Lee and Lee 5 ). Epidemiological studies have evaluated the relationship between dairy food consumption and risk of the MetS. Some studies reported an inverse association( Reference Lutsey, Steffen and Stevens 1 , Reference Huo Yung Kai, Bongard and Simon 6 – Reference Pereira, Jacobs and Van Horn 12 ), but others showed no association( Reference Drehmer, Pereira and Schmidt 13 – Reference Louie, Flood and Rangan 16 ). The different results on the associations might be because of the effects of various types of dairy foods on the risk of the MetS. A recent study suggested that individual dairy foods might have different effects on the risk of the MetS. A higher consumption of regular-fat dairy products was associated with a reduced risk of the MetS, whereas low-fat dairy products were not associated with the MetS in middle-aged and older US women( Reference Liu, Song and Ford 10 ). Inconsistently, a higher consumption of whole-fat yogurt and low-fat milk was associated with a reduced risk of the MetS, whereas whole-fat milk was not associated with the MetS, and a higher consumption of cheese was related to a higher risk of the MetS in a Mediterranean population( Reference Babio, Becerra-Tomas and Martinez-Gonzalez 14 ).
Two meta-analyses have shown a significant relationship between dairy food consumption and the MetS( Reference Chen, Szeto and Chen 17 , Reference Kim and Je 18 ). However, these studies only assessed the relationship between total dairy food consumption and risk of the MetS. None of the studies have investigated the effects of specific types of dairy foods on the MetS and individual components.
Therefore, we performed a systematic review and a meta-analysis of observational studies on the relationship between specific types of dairy foods, such as milk and yogurt as well as total dairy foods, and the MetS and individual components (abdominal obesity, low HDL-cholesterol, hypertriacylglycerolaemia, hyperglycaemia and high blood pressure) in the general population.
Methods
Literature search strategy
A systematic literature search was conducted using PubMed and EMBASE from January 1900 to June 2016. The following search terms were used: (‘dairy’ OR ‘milk’ OR ‘yogurt’) AND (‘metabolic syndrome’ OR ‘metabolic syndrome X’ OR ‘diabetes’ OR ‘diabetes mellitus’ OR ‘hyperglycemia’ OR ‘high blood pressure’ OR ‘high density lipoprotein’ OR ‘dyslipidemia’ OR ‘triglyceride’ OR ‘obesity’).
Study selection
For inclusion criteria in this meta-analysis, the studies had to be observational, have dairy food consumption as a dietary factor, have the MetS and/or its components (abdominal obesity, low HDL-cholesterol, hypertriacylglycerolaemia, hyperglycaemia, and high blood pressure) as outcomes and report relative risks (RR) or OR and CI (or data to calculate them) in healthy adults. The following studies were excluded: animal studies, randomised controlled trials, studies not published in English, studies that focused on patients who had specific diseases, studies not related to dietary factors (dairy foods) or outcomes (the MetS or its components), studies in which no full text was available, reviews and meta-analyses. In addition, the references from the retrieved articles and those from previous review studies were reviewed to identify additional relevant studies (Fig. 1).
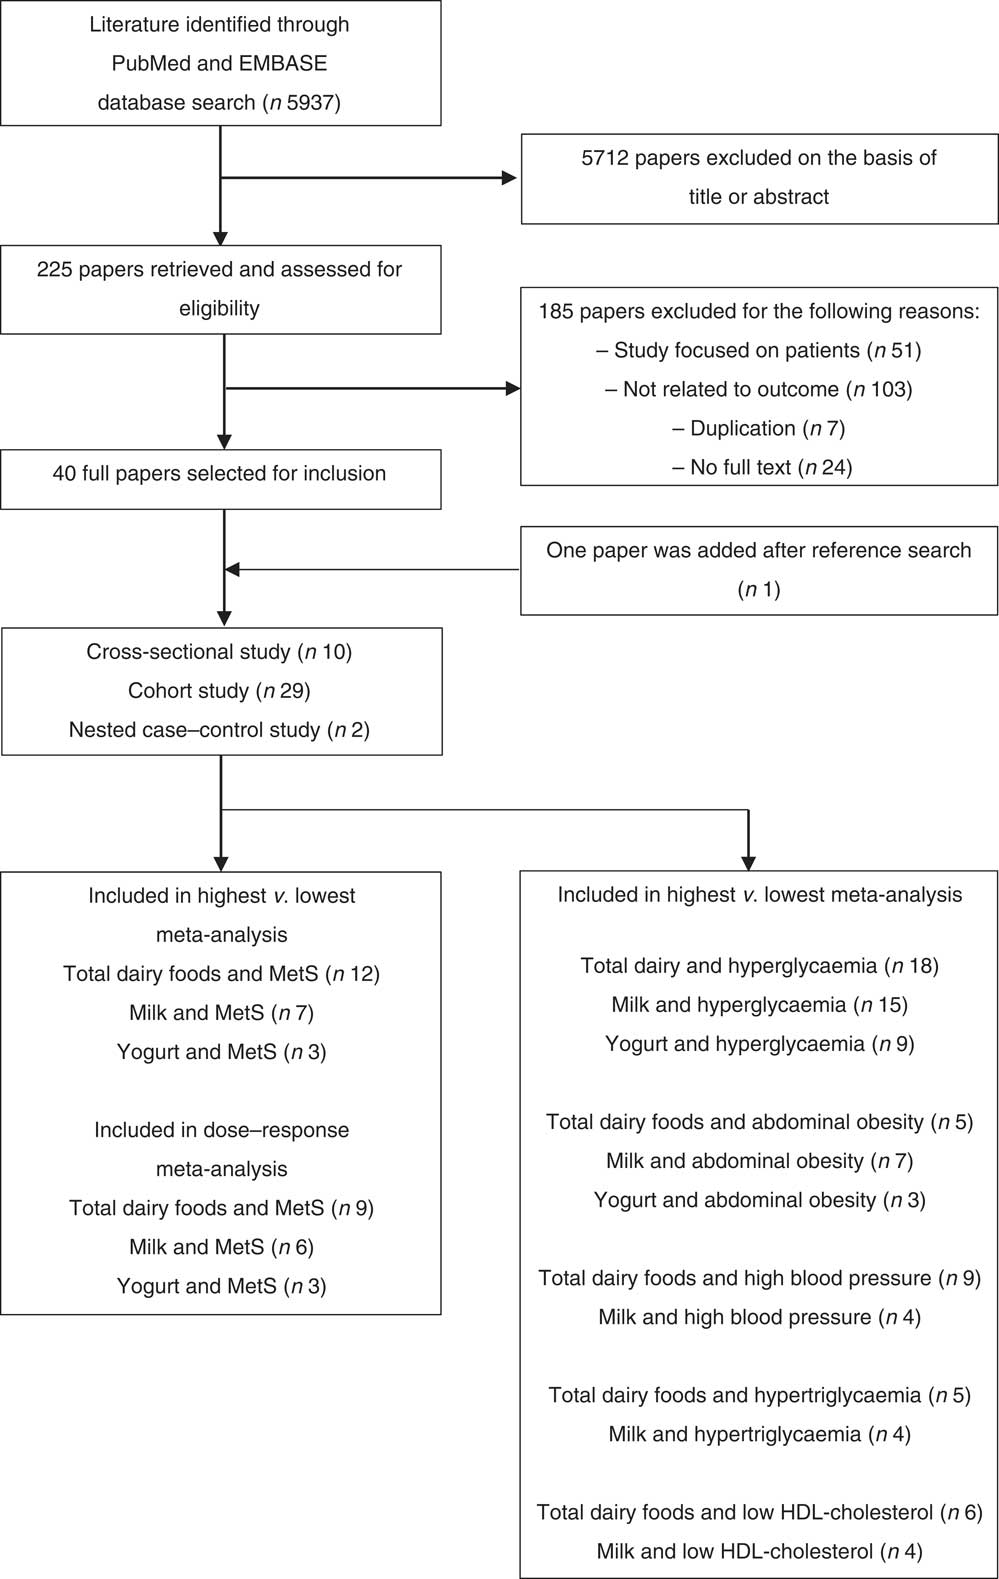
Fig. 1 Flow chart of literature search for meta-analysis. MetS, metabolic syndrome.
Data extraction and quality assessment
Two investigators (M. L. and J. K.) conducted study selection and data extraction, and further discussion was performed to resolve any disagreement by reviewing the original article. The following data were extracted from each study: first author’s last name, publication year, study location, study design, follow-up period, number of cases and subjects, age and sex of the subjects, type of outcome (MetS or individual components), type of dairy foods (total dairy foods, milk or yogurt), dietary assessment method, MetS criteria, OR or RR with the 95 % CI for the relationship between dairy foods ‘consumption and the MetS across dairy product intake levels and adjustment for confounding factors. We used the most-adjusted model among multivariable adjustment models.
In this study, total dairy foods included milk, yogurt, cheese and dairy desserts such as custard and ice cream. Definitions of whole-fat dairy foods or low-fat dairy foods were differed across studies. Most studies described what type of dairy foods were included in the whole-fat or low-fat dairy foods without information on fat content. Whole-fat or regular-fat dairy foods included whole milk, whole-fat yogurt, regular cheese and medium-fat dairy dessert; whereas, low-fat or reduced-fat dairy foods included skimmed or low-fat milk, skimmed or low-fat yogurt, cottage/ricotta cheese or low-fat cheese and reduced-fat dairy dessert( Reference Lutsey, Steffen and Stevens 1 , Reference Huo Yung Kai, Bongard and Simon 6 – Reference Louie, Flood and Rangan 16 , Reference Kwon, Lee and Park 19 – Reference Sayon-Orea, Bes-Rastrollo and Marti 23 ). A few studies defined whole-fat or low-fat dairy foods by fat content. Whole-fat dairy foods were defined as milk and milk products with a total fat content of ≥2 g/100 g( Reference Struijk, Heraclides and Witte 24 ) or >3·5 g/100 g( Reference Engberink, Geleijnse and de Jong 25 , Reference Engberink, Hendriksen and Schouten 26 ) or cheese products with a total fat content of ≥20 g/100 g( Reference Struijk, Heraclides and Witte 24 – Reference Engberink, Hendriksen and Schouten 26 ), whereas low-fat dairy foods were defined as milk and milk products with a total fat content of <2/100 g or cheese with a total fat content of <20/100 g( Reference Struijk, Heraclides and Witte 24 – Reference Engberink, Hendriksen and Schouten 26 ). Whole-fat dairy foods were defined as whole-fat milk (4 % fat), whole-fat cheese (30–35 % fat) and cream (19–24 % fat)( Reference Heraclides, Mishra and Hardy 27 ), whereas low-fat dairy foods were defined as skimmed milk (0·3 % fat), semi-skimmed milk (1·7 % fat) and low-fat cheese (12–16 % fat)( Reference Heraclides, Mishra and Hardy 27 ).
Two investigators (M. L. and J. K.) independently evaluated the quality of cohort studies using the Newcastle–Ottawa quality assessment scale( Reference Wells, Shea and O’Connell 28 ) for the following criteria: representativeness of the exposed cohort; dietary assessment methods of dairy food consumption; assessment of outcome; duration of follow up; adequacy of the follow up of cohorts; and adjustment for important confounders (age, BMI, smoking, alcohol and physical activity). The evaluation scores ranged from 0 to 9. Total scores ≥7 (out of 9) indicated good quality. The quality of cross-sectional studies was evaluated using the strengthening the reporting of observational studies in epidemiology statement( Reference Von Elm, Altman and Egger 29 ). The evaluation score ranged from 0 to 22. Total scores ≥16 (out of 22) indicated good quality. Any discrepancies in quality assessment between two reviewers were resolved by discussion until a consensus was reached. To avoid selection bias, no study was rejected because of these quality criteria.
Statistical analysis
The pooled estimates (RR or OR) of the MetS and 95 % CI for the highest v. the lowest category of dairy food consumption level or the linear or non-linear dose–response analysis were obtained using random effects, which accounted for the heterogeneity among studies( Reference DerSimonian and Laird 30 ). When a study provided the estimates for total dairy foods, low-fat dairy foods and whole-fat dairy foods, the effect estimates of total dairy food consumption were included in the main analysis. When a study reported the separate estimates for each dairy food according to fat content (skimmed/low-fat milk and whole/full-fat milk)( Reference Crichton and Alkerwi 31 – Reference Funtikova, Subirana and Gomez 35 ) or sex (men and women)( Reference Satija, Agrawal and Bowen 36 , Reference Kirii, Mizoue and Iso 37 ), the effect estimates from each dairy foods were combined using a fixed-effect model in the main analysis.
The dose–response relationship between dietary factor (total dairy foods, milk and yogurt) and outcome (MetS and its components) was examined using generalised least-square trend estimation analysis to estimate the study-specific slope lines first and then derive an overall slope, which requires the distribution of cases and person-years or subjects( Reference Greenland and Longnecker 38 , Reference Orsini, Bellocco and Greenland 39 ). When these numbers were not available, a variance-weighted least squares meta-regression analysis was used to estimate the dose–response slopes( Reference Greenland and Longnecker 38 , Reference Orsini, Bellocco and Greenland 39 ). For these two analyses, the median or the mean value for each category of intake levels was used. For studies not providing the median or mean consumption of each category, the midpoint of the upper and the lower boundary in each category was used as the average intake. Dairy food consumption reported as servings or portions per day, week or month was converted to g/d. One-serving/d was defined as 200 g for total dairy foods or milk, and 100 g for yogurt.
In addition, subgroup and meta-regression analyses were performed according to study design (cohort/cross-sectional), study location (Americas, Asia, Europe, Oceania) and adjustment factors (BMI, energy intake, alcohol, fruit intake and vegetable intake). Sensitivity analysis was conducted in which one study at a time was removed and the remaining studies were assessed to evaluate the impact of the single study. To explore the presence of statistical heterogeneity, Higgins I 2 ( Reference Higgins and Thompson 40 ) was conducted, and the I 2 statistic was calculated. The assumption of heterogeneity was considered valid for P values <0·05.
Forest plots were made to visualise and summarise the relationship between total dairy foods, milk or yogurt and the MetS and its components. Publication bias was evaluated by Egger’s test( Reference Egger, Davey Smith and Schneider 41 ). All statistical analysis was performed using Stata/SE 14.2 (STATA). A two-tailed P value <0·05 was considered statistically significant.
Results
Study characteristics
Ten cohort studies( Reference Lutsey, Steffen and Stevens 1 , Reference Shin, Yoon and Lee 7 , Reference Fumeron, Lamri and Abi Khalil 8 , Reference Pereira, Jacobs and Van Horn 12 – Reference Babio, Becerra-Tomas and Martinez-Gonzalez 14 , Reference Louie, Flood and Rangan 16 , Reference Elwood, Pickering and Fehily 20 , Reference Damiao, Castro and Cardoso 21 , Reference Sayon-Orea, Bes-Rastrollo and Marti 23 ) and seven cross-sectional studies( Reference Huo Yung Kai, Bongard and Simon 6 , Reference Ruidavets, Bongard and Dallongeville 9 – Reference Azadbakht, Mirmiran and Esmaillzadeh 11 , Reference Martins, Kac and Silva 15 , Reference Kwon, Lee and Park 19 , Reference Kim 22 ) were included in meta-analyses that compared the highest and lowest categories of dairy product intake, and seven cohort studies( Reference Lutsey, Steffen and Stevens 1 , Reference Shin, Yoon and Lee 7 , Reference Drehmer, Pereira and Schmidt 13 , Reference Babio, Becerra-Tomas and Martinez-Gonzalez 14 , Reference Louie, Flood and Rangan 16 , Reference Damiao, Castro and Cardoso 21 , Reference Sayon-Orea, Bes-Rastrollo and Marti 23 ) and six cross-sectional studies( Reference Huo Yung Kai, Bongard and Simon 6 , Reference Liu, Song and Ford 10 , Reference Azadbakht, Mirmiran and Esmaillzadeh 11 , Reference Martins, Kac and Silva 15 , Reference Kwon, Lee and Park 19 , Reference Kim 22 ) were included in the dose–response meta-analysis on the association between dairy foods (total dairy foods, milk and yogurt) and risk of the MetS (Table 1). Studies on the cheese intake were not included in the meta-analysis because of insufficient number of studies (n 2)( Reference Fumeron, Lamri and Abi Khalil 8 , Reference Babio, Becerra-Tomas and Martinez-Gonzalez 14 ). Five studies were conducted in Americas, four studies were conducted in Asia, three studies were conducted in Europe and one study was conducted in Oceania. The follow-up range of cohort studies was between 2·3 and 10 years. Two studies( Reference Martins, Kac and Silva 15 , Reference Louie, Flood and Rangan 16 ) defined the MetS using the criteria of the International Diabetes Federation( 42 ). One study( Reference Lutsey, Steffen and Stevens 1 ) defined the MetS based on the criteria of the American Heart Association/National Heart, Lung and Blood Institute( Reference Grundy, Cleeman and Daniels 43 ). Two studies( Reference Liu, Song and Ford 10 , Reference Azadbakht, Mirmiran and Esmaillzadeh 11 ) defined the MetS according to the guideline of the National Cholesterol Education Program, Adult Treatment Panel III (NCEP-ATP III)( 44 ). Three studies( Reference Shin, Yoon and Lee 7 , Reference Kwon, Lee and Park 19 , Reference Damiao, Castro and Cardoso 21 ) defined the MetS using the criteria of the modified NCEP-ATP III. Five studies( Reference Huo Yung Kai, Bongard and Simon 6 , Reference Drehmer, Pereira and Schmidt 13 , Reference Babio, Becerra-Tomas and Martinez-Gonzalez 14 , Reference Kim 22 , Reference Sayon-Orea, Bes-Rastrollo and Marti 23 ) defined the MetS by the criteria of the Joint Interim Statement( Reference Alberti, Eckel and Grundy 45 ). All studies adjusted for multiple confounders of age, smoking and physical activity. Most of the studies adjusted for sex( Reference Lutsey, Steffen and Stevens 1 , Reference Huo Yung Kai, Bongard and Simon 6 , Reference Shin, Yoon and Lee 7 , Reference Azadbakht, Mirmiran and Esmaillzadeh 11 , Reference Drehmer, Pereira and Schmidt 13 – Reference Louie, Flood and Rangan 16 , Reference Kwon, Lee and Park 19 , Reference Damiao, Castro and Cardoso 21 – Reference Sayon-Orea, Bes-Rastrollo and Marti 23 ), alcohol intake( Reference Huo Yung Kai, Bongard and Simon 6 , Reference Shin, Yoon and Lee 7 , Reference Liu, Song and Ford 10 , Reference Drehmer, Pereira and Schmidt 13 – Reference Martins, Kac and Silva 15 , Reference Kwon, Lee and Park 19 , Reference Damiao, Castro and Cardoso 21 – Reference Sayon-Orea, Bes-Rastrollo and Marti 23 ) and energy intake( Reference Lutsey, Steffen and Stevens 1 , Reference Huo Yung Kai, Bongard and Simon 6 , Reference Shin, Yoon and Lee 7 , Reference Liu, Song and Ford 10 , Reference Azadbakht, Mirmiran and Esmaillzadeh 11 , Reference Drehmer, Pereira and Schmidt 13 , Reference Martins, Kac and Silva 15 , Reference Louie, Flood and Rangan 16 , Reference Kwon, Lee and Park 19 , Reference Damiao, Castro and Cardoso 21 – Reference Sayon-Orea, Bes-Rastrollo and Marti 23 ). Four studies provided the adjusted RR for BMI( Reference Azadbakht, Mirmiran and Esmaillzadeh 11 , Reference Babio, Becerra-Tomas and Martinez-Gonzalez 14 , Reference Kwon, Lee and Park 19 , Reference Kim 22 ). For quality assessment of studies, quality score for seven cohort studies included in the dose–response analysis were between 6 and 8, with a mean score of 7. The majority of the cohort studies had good quality scores (five out of seven studies). Quality scores for six cross-sectional studies were between 14 and 17, with an average score of 16. The majority of the cross-sectional studies had good quality scores (four out of six studies). The studies on the relationship between dairy products (total dairy foods, milk and yogurt) and MetS components were described in the online Supplementary Table S1.
Table 1 Characteristics of the studies on the association between dairy products (total dairy foods, milk and yogurt) and the metabolic syndrome included in this meta-analysis (Numbers and percentages, odds ratios, relative risks (RR) and confidence intervals).
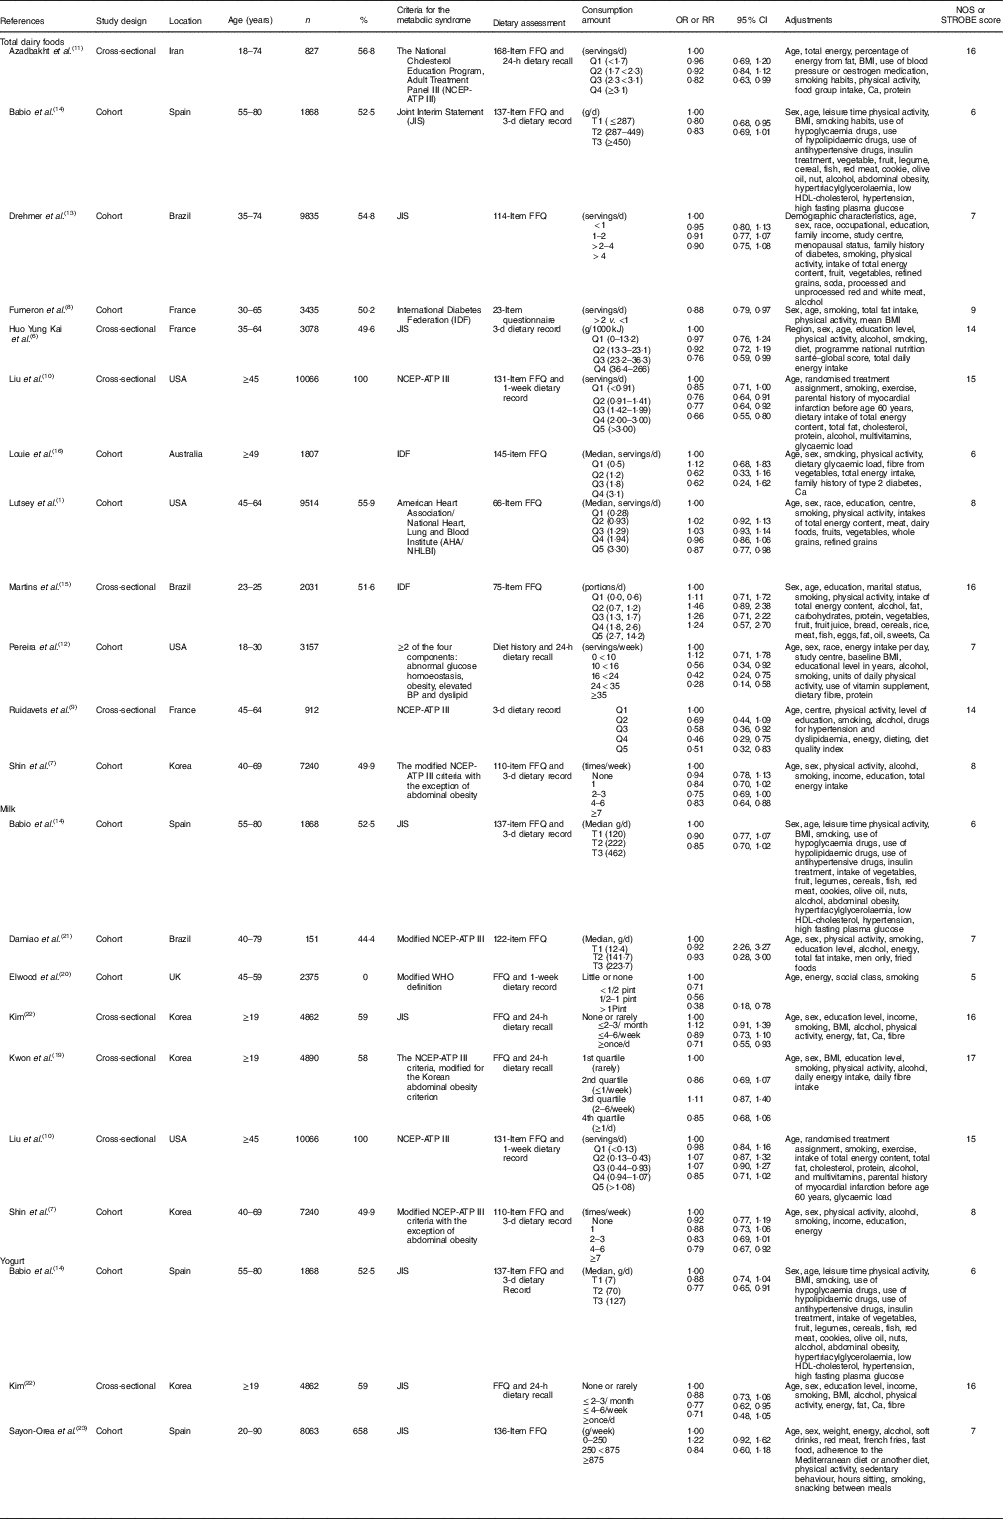
NOS, Newcastle–Ottawa quality assessment; STROBE, Strengthening the Reporting of Observational studies in Epidemiology statement; BP, blood pressure; NCEP-ATP III, National Cholesterol Education Program, Adult Treatment Panel III.
Association between dairy food consumption and the metabolic syndrome
A dose–response meta-analysis of nine studies( Reference Lutsey, Steffen and Stevens 1 , Reference Huo Yung Kai, Bongard and Simon 6 , Reference Shin, Yoon and Lee 7 , Reference Liu, Song and Ford 10 , Reference Azadbakht, Mirmiran and Esmaillzadeh 11 , Reference Drehmer, Pereira and Schmidt 13 – Reference Louie, Flood and Rangan 16 ) that included five cohort studies, involving 9126 cases and 30 264 participants, and four cross-sectional studies, involving 3680 cases and 16 002 participants, was conducted to explore the association between total dairy food consumption and the MetS. The multivariable-adjusted RR and 95 % CI of the MetS according to one-serving/d increment of dairy food consumption and the MetS are shown in Fig. 2. In a dose–response meta-analysis combining the two types of study design, an increase of 200 g/d of total dairy product intake was associated with a 9 % lower risk of the MetS (RR=0·91; 95 % CI 0·85, 0·96) with moderate heterogeneity (I 2=51·7 %, P=0·04).
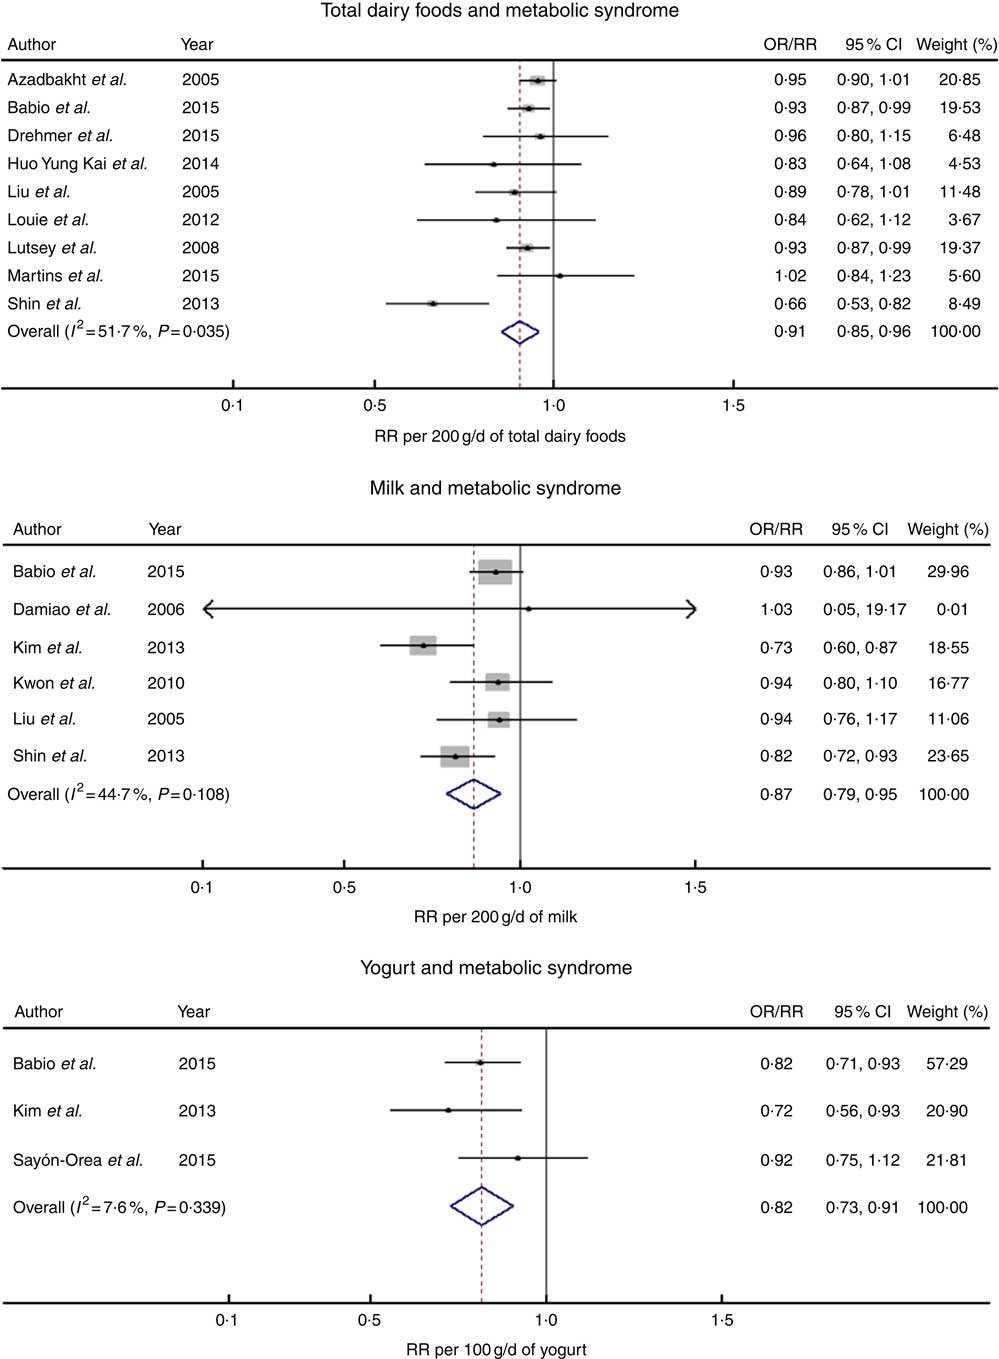
Fig. 2 The forest plot for the linear dose–response relationship between dairy food consumption (per increment of g/d) by subtype and the metabolic syndrome. RR, relative risk.
Six studies( Reference Shin, Yoon and Lee 7 , Reference Liu, Song and Ford 10 , Reference Babio, Becerra-Tomas and Martinez-Gonzalez 14 , Reference Kwon, Lee and Park 19 , Reference Damiao, Castro and Cardoso 21 , Reference Kim 22 ) that included three cohort studies involving 2227 cases and 9259 participants and three cross-sectional studies involving 4775 cases and 19 818 participants examined the relationship between milk consumption and risk of the MetS. In a dose–response analysis, an increase of 200 g/d of milk intake was associated with a 13 % lower risk of the MetS (RR=0·87; 95 % CI 0·79, 0·95) with no significant heterogeneity (I 2=44·7 %, P=0·11).
Three studies( Reference Babio, Becerra-Tomas and Martinez-Gonzalez 14 , Reference Kim 22 , Reference Sayon-Orea, Bes-Rastrollo and Marti 23 ) including two cohort studies involving 1236 cases and 9931 participants and one cross-sectional study involving 1298 cases and 4862 participants explored the relationship between yogurt intake and the MetS. In a dose–response analysis, the risk of the MetS decreased by 18 % for a 100 g/d increment in yogurt consumption (RR=0·82; 95 % CI 0·73, 0·91) with no significant heterogeneity (I 2=7·6 %, P=0·34).
Associations between dairy food consumption and metabolic syndrome components
A meta-analysis of the relationship between dairy food consumption and MetS components is shown in Table 2. In a dose–response analysis, an increase of 200 g/d of total dairy product intake was related to a lower risk of MetS components such as hyperglycaemia (seventeen studies), high blood pressure (ten studies), hypertriacylglycerolaemia (five studies) and low HDL-cholesterol (six studies). An increase of 200 g/d of milk intake (seven studies) was related to a 12 % lower risk of abdominal obesity (RR=0·88; 95 % CI 0·79, 0·97). An increase of 100 g/d of yogurt intake (nine studies) was associated with a 16 % lower risk of hyperglycaemia (RR=0·84; 95 % CI 0·70, 0·98).
Table 2 Meta-analyses for dairy food consumption by subtype and the metabolic syndrome and its components (Relative risks and 95 % confidence intervals)
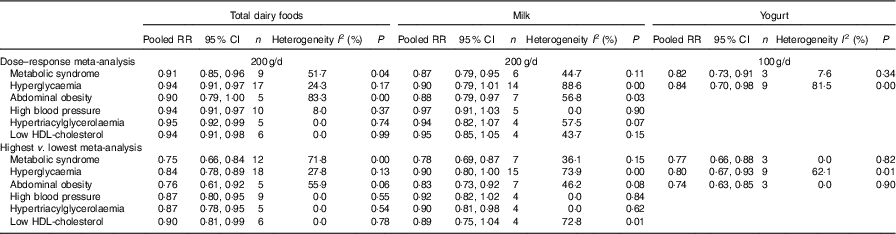
In a meta-analysis that compared the highest v. the lowest category of dairy product intake, the pooled RR for the MetS in the highest category of total dairy product intake (twelve studies) compared with those in the lowest category of total dairy product intake was 0·75 (95 % CI 0·66, 0·84). The pooled RR for the MetS in the highest category of milk (seven studies) and yogurt intake (three studies) compared with those in the lowest category of milk and yogurt were 0·78 (95 % CI 0·69, 0·87) and 0·77 (95 % CI 0·66, 0·88), respectively, with no significant heterogeneity.
In meta-analyses that compared the highest and lowest categories of dairy product intake, total dairy product intake was related to a lower risk of all components of the MetS, and milk intake was related to a lower risk of abdominal obesity (seven studies) and hypertriacylglycerolaemia (four studies). Yogurt intake was related to a lower risk of hyperglycaemia (nine studies) and abdominal obesity (three studies).
Subgroup, meta-regression and sensitivity analyses
The results for subgroup analysis and meta-regression analyses are shown in Table 3. Subgroup analyses for total dairy foods and the MetS found no significant differences in study design. With regard to study location, Americas (RR=0·93; 95 % CI 0·88, 0·98) and Europe (RR=0·92; 95 % CI 0·87, 0·98) showed significant inverse associations, whereas Asia and Oceania showed a non-significant inverse association; however, the difference was not significant (P≥0·2 for all comparisons). With regard to the quality assessment of studies, both good (RR=0·91; 95 % CI 0·82, 0·99) and others (RR=0·91; 95 % CI 0·86, 0·96) showed significant inverse associations with no significant difference (P=0·50). With regard to fat content of dairy foods, whole-fat dairy product intake showed a significant inverse association (RR=0·78; 95 % CI 0·61, 0·96) with no significant heterogeneity (I 2=29 %, P=0·24), whereas low-fat dairy foods showed no association. Only one study that provided the RR adjusted for fruit and vegetable intake showed an inverse association (RR=0·94; 95 % CI 0·91, 0·97) compared with the pooled RR of the other studies (RR=0·80; 95 % CI 0·68, 0·92), and the results of the meta-regression analysis showed that the difference was significant (P=0·01). In addition, meta-regression analyses showed that adjustment for alcohol, BMI or energy intake did not contribute to heterogeneity (P≥0·2 for all comparisons). In a sensitivity analysis, the pooled RR were in the range of 0·89 (95 % CI 0·83, 0·95)–0·93 (95 % CI 0·90, 0·96). When one study with no adjustment for dietary factors( Reference Shin, Yoon and Lee 7 ) (e.g. adjustments for dietary factors such as fat, protein, fibre, Ca, fruit, vegetable, meat, fish and grain were made in other studies) was excluded, the significance for heterogeneity disappeared (P=0·84), and similar results were obtained (RR=0·93; 95 % CI 0·90, 0·96).
Table 3 Subgroup analyses of studies on the association of dairy food (total dairy foods and milk) consumption and risk of the metabolic syndrome (MetS) included in dose–response analysis (Relative risks and 95 % confidence intervals)
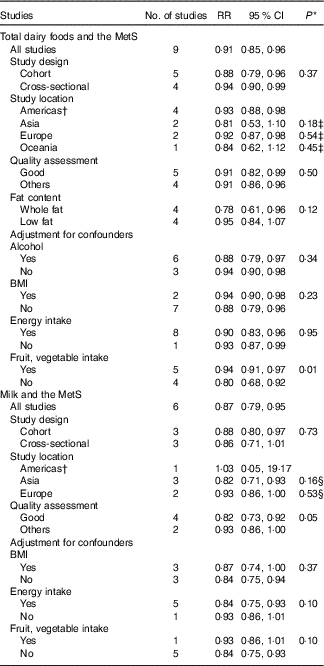
* P values for heterogeneity between subgroups with meta-regression analysis.
† Including USA and Brazil.
‡ P value for difference in RR of total dairy food consumption for Asia v. Americas, Europe v. Americas, Oceania v. Americas.
§ P value for difference in RR of milk consumption for Asia v. Americas, Europe v. Americas.
Subgroup analyses for milk intake and the MetS found no significant differences in study location (P≥0·2 for all comparisons). With regard to study design, a cohort study design showed a significant inverse relationship (RR=0·88; 95 % CI 0·80, 0·97), whereas a cross-sectional study showed a not significant relationship; however, the difference between them was not significant (P=0·73). With regard to the quality assessment of studies, studies with good quality (RR=0·82; 95 % CI 0·73, 0·92) showed significant inverse associations, whereas others showed a non-significant inverse association; however, the difference was not significant (P=0·05). According to adjustment factors, no significant differences with regard to BMI, energy intake and fruit and vegetable intake were found based on the results of meta-regression analyses (P≥0·1 for all comparisons). In a sensitivity analysis for milk intake and the MetS, the pooled RR were in the range of 0·84 (95 % CI 0·75, 0·93)–0·90 (95 % CI 0·85, 0·96).
Subgroup analysis for yogurt intake and the MetS were not conducted because only three studies were found.
Publication bias
There was no indication of publication bias for a dose–response meta-analysis of total dairy food consumption and the MetS (Egger’s P=0·12), milk intake and the MetS (Egger’s P=0·20) or yogurt intake and the MetS (Egger’s P=0·93).
Discussion
This meta-analysis of epidemiological studies including prospective cohort studies and cross-sectional studies showed an inverse relationship between specific types of dairy food consumption and incidence or prevalence of the MetS. In a dose–response meta-analysis, a one-serving increment of total dairy food consumption was associated with a 9 % lower risk of the MetS. In addition, a one-serving increment/d in milk and yogurt consumption was related to a 13 and 18 % lower risk of the MetS, respectively. Dairy food consumption was associated with individual components of the MetS as well as the MetS. Total dairy food consumption was inversely associated with the components of the MetS such as hyperglycaemia, high blood pressure, hypertriacylglycerolaemia and low HDL-cholesterol. A one-serving increment/d of milk consumption was related to a 12 % lower risk of abdominal obesity, respectively, and a one-serving increment/d in yogurt consumption was related to a 16 % lower risk of hyperglycaemia. This inverse association did not vary in terms of study design, study location or adjustment factors. These results suggest that specific types of dairy food consumption such as milk and yogurt as well as total dairy product intake were inversely linked to the MetS and its components.
These results are consistent with the findings from previous studies showing the effects of consumption of total dairy foods or specific types of dairy foods on metabolic risk factors. A meta-analysis of cohort studies showed an inverse association between total dairy food consumption and the MetS( Reference Kim and Je 18 ). Increased total dairy food consumption has also been reported to reduce abdominal obesity in a clinical trial( Reference Zemel, Richards and Milstead 46 ). Another meta-analysis of cohort studies showed an inverse association between total dairy food consumption and the risk of hypertension( Reference Ralston, Lee and Truby 47 ). Furthermore, a high intake of milk and yogurt consumption was inversely related to risk of the MetS and hypertriacylglycerolaemia in a cohort study( Reference Kim and Kim 48 ). A systematic review of intervention studies and a multi-centre study reported that dairy foods improved insulin sensitivity( Reference Turner, Keogh and Clifton 49 ) and lipid profiles( Reference Abdullah, Cyr and Lepine 50 ).
Potential mechanisms explaining the beneficial effect of dairy foods such as milk and yogurt on metabolic risk factors have been suggested. Milk and yogurt have several nutrients such as Ca and dairy proteins, which are known to have favourable effects on health.Ca, which is abundant in milk and yogurt, combines with fatty acids and bile acids in the intestine, thereby increasing faecal fat excretion and/or inhibiting fat reabsorption( Reference Boon, Hul and Stegen 51 ). This can result in an improved ratio of HDL-cholesterol:LDL-cholesterol( Reference Reid, Mason and Horne 52 ). In addition, Ca might affect lipid profiles by regulating intracellular Ca concentration. Well-regulated serum Ca level through the intake of Ca from dairy foods decreases intracellular Ca level and results in the inhibition of fatty acid synthesis and stimulation of lipolysis( Reference Welberg, Monkelbaan and de Vries 53 ). Milk proteins, such as whey protein and casein, might be responsible for the beneficial effects of dairy foods on blood pressure as they can regulate blood pressure via inhibition of angiotensin I-converting enzyme and, as a result, by reducing angiotensin II, a potent vasoconstrictor( Reference Choi, Sabikni and Hassan 54 ). In addition, specific amino acids from whey protein, in particular branched-chain amino acids and dairy protein-derived peptides, might play an important role in the regulation of insulinaemia, blood pressure, dyslipidaemia and fat accumulation( Reference Nilsson, Holst and Bjorck 55 , Reference Ricci-Cabello, Herrera and Artacho 56 ). Specifically, yogurt consumption was associated with a lower risk of hyperglycaemia. This phenomenon could be partly explained by the fact that yogurt is a good source of vitamin K2, which is synthesised by bacteria and there only present in fermented dairy foods( Reference Schurgers and Vermeer 57 ). Vitamin K2 has recently been linked to a reduced risk of type 2 diabetes( Reference Beulens, van der and Grobbee 58 ). The combined and synergic effects of various nutrients in dairy foods might contribute to favourable effects on the MetS risk factors.
Interestingly, low-fat dairy foods were not significantly linked to risk of the MetS in the subgroup analysis. Low-fat dairy product intake is associated with reduced saturated fat intake, which could be protective against the components of the MetS such as lipid profiles and insulin resistance( Reference Louie, Flood and Rangan 16 ). Possibly, the favourable effect of low-fat dairy foods on the MetS might be diminished because people consuming low-fat dairy foods increased fat or carbohydrate intake from the diet, which may affect metabolic risk factors. A recent clinical study is in-line with our findings. Daily intake of low-fat dairy products for 8 weeks did not improve metabolic risk factors related to the MetS except for a slight decrease in systolic blood pressure in obese subjects( Reference van Meijl and Mensink 59 ).
The present meta-analysis has several strengths. To the best of our knowledge, this is the first meta-analysis of epidemiological studies to investigate the relationship between specific types of dairy food consumption and the risk of the MetS and its components. In addition, this study assessed a linear association between the consumption of individual dairy foods and the risk of the MetS using dose–response meta-analysis. All studies included in the meta-analysis were of good quality according to quality assessment, and most of the studies adjusted for critical confounders of the MetS such as age, sex, BMI, energy intake, alcohol intake, smoking and physical activity.
The present study has some limitations. This meta-analysis only included observational studies; thus, there is a possibility of residual or unmeasured confounding factors, although we used multivariable RR and adjusted for potential confounders, and the subgroup analyses showed no significant difference in terms of adjustment factors (study design, study location, BMI, alcohol, energy intake). Second, different criteria were used to diagnose the MetS, and the studies included in this meta-analysis used different methods for dietary assessment; the use of different criteria or method might affect the strength of the link between dairy food consumption and risk of the MetS and its components. Third, we could not conduct a meta-analysis for various types of dairy foods such as cheese because of the lack of studies conducted.
In conclusion, the results from this dose–response meta-analysis of prospective cohort studies and cross-sectional studies showed that individual dairy food consumption such as milk and yogurt as well as total dairy food consumption was inversely associated with risk of the MetS and its components. A meta-analysis on randomised clinical trials should be conducted to provide strong evidence for the relationship between individual dairy food consumption and risk of the MetS and its components.
Acknowledgements
We thank Korea Centers for Disease Control and Prevention (KCDC) for providing open source data. This research was supported by the Basic Science Research Program of the National Research Foundation of Korea (NRF), funded by the Ministry of Education, Science and Technology (grant no. NRF2016 R1D1A1B03931307). The NRF had no role in the study design, data analysis or writing of this article.
All authors had a significant role in the study. M. L. and H. L. contributed to data analysis and writing the manuscript. J. K. contributed to designing the research and writing the manuscript; she has primary responsibility for the final content. All authors read and approved the final manuscript.
The authors declare that there are no conflicts of interest.
Supplementary material
For supplementary material/s referred to in this article, please visit https://doi.org/10.1017/S0007114518001460


